Oct
22
Government shutdown question, from Cagdas Tuna
October 22, 2025 | Leave a Comment
Are the furloughed government employees going to be counted as unemployed? I believe they will be which will be considered as a huge green light for 50bps rate cut in the December FOMC. This shutdown is the perfect storm for Trump’s “Fire Powell and get rates to 0%” scenario.
Bill Rafter responds:
The requirements for being “Unemployed” are that (a) the person is not working , and (b) that person is “looking for work”. I believe the latter qualification would disqualify those furloughed from being considered as unemployed. Not only the shutdown [will delay BLS releases], but the recently nominated BLS head, E.J. Antoni has withdrawn his name from nomination. So BLS is headless.
Alex Castaldo comments:
That is good news for all statisticians, I am sure he is a wonderful guy but he had a reputation for mistakes in calculations.
Oct
16
Hubris is going to a New All Time High, from Sushil Kedia
October 16, 2025 | Leave a Comment
Saudi Arabia has announced the Rise Tower that is likely to have a height twice that of Burj Khalifa! 2000 meters up from the ground! It is likely to cost 5 Billion Dollars. One is left wondering in a world where everyone manages to almost manages to get decent enough sleep every night with Trillion Dollar deficits, what is Hubris doing having been left so far behind!

Nils Poertner writes:
Wondering what to make of this though, Sunil. Saudi Arabia's main stock Index (TASII peaked in 2006. and never fully recovered properly. Any idea how to express it into some trading idea so we can test our hypothesis?
William Huggins comments:
The 2006 Saudis run is very similar to the soul al manakh run up 20 years before. In particular for Saudis though, it's a market that forbid ahoet selling so when the bulls got started there was no guardrail until they simply could find no bigger fool.
Nils Poertner responds:
Thanks William. Maybe one needs to look at oil (bearish oil story?) - oil doesn't move forever and then it moves a lot. (not an oil trader though - just something that came to mind)
Alex Castaldo offers:
For those too young to remember the events of 1981:
The Souk al-Manakh Crash
From 1978 to 1981, Kuwait’s two stock markets, one the conservatively regulated “official” market and the other the unregulated Souk al-Manakh, exploded in size, growing to the point where the amount of capital actively traded exceeded that of every other country in the world except the United States and Japan. A year later, the system collapsed in an instant, causing huge real losses to the economy and financial disruption lasting nearly a decade. This Commentary examines the emergence of the Souk, the simple financial innovation that evolved to solve its rapidly increasing need for liquidity and credit, and the herculean efforts to solve the tangled problems resulting from the collapse. Two lessons of Kuwait’s crisis are that it is difficult to separate the banking and unregulated financial sectors and that regulators need detailed data on the transactions being conducted at all financial institutions to give them the understanding of the entire network they must have to maintain financial stability. If Kuwaiti officials had had transaction-by-transaction data on the trades being made in both the regulated and unregulated stock markets, then the Kuwaiti crisis and its aftermath might not have been so severe.
Aug
25
Robert Z. Aliber, 1930-2025, from Alex Castaldo
August 25, 2025 | Leave a Comment

Friend of the Chair, Robert Z Aliber, a professor of International Economics and Finance at the University of Chicago, died in June 2025, I recently found out.
Just before the Financial Crisis (I don't remember the exact date) he sent a prescient Email to the Chair, arguing that problems caused by carelessly underwritten mortgages would soon cause a recession in the US. At the time I was not really aware of what was going in in the field of mortgage securitization, so I found the information surprising and was impressed later when it was confirmed by subsequent events.
Big Al adds:
Robert Z. Aliber on "The Next Financial Crisis?"
The University of Chicago
Apr 24, 2013
In 1982, 1997, 2003, and 2008, Asia and the world were rocked by major financial crises. Robert Z. Aliber discusses past crises and the possible trajectory of the next one. Where is the next major crisis likely to begin? How will its impact compare to previous crises? Aliber, a regular speaker for Chicago Booth, co-authored Manias, Panics, and Crashes: A History of Financial Crises.
Jun
13
Alasdair MacIntyre (1929-2025), from Alex Castaldo
June 13, 2025 | Leave a Comment

A few weeks ago I read about the death of Alasdair MacIntyre, described in Wikipedia as a Scottish American philosopher. And in some obituaries as "one of the great moral philosophers of the 20th century".
I heard his name here on the SpecList about 10 years ago when someone (sorry, I do not remember who, maybe GB?) recommended his book After Virtue, saying that it described how philosophy has gone wrong in the 20th century and how to correct it.
Intrigued, I bought the book, but like many things on SpecList, it was harder to understand than I expected. I think I read the 1st chapter or so, but I guess my knowledge of Aristotelian philosophy was not adequate and I could not make much progress. So the book sat on my shelf until now. I also did not quite grasp what Aristotle got right that later philosophers missed or what going back to Aristotle's views would mean in practice. The whole idea of reviving an earlier tradition seemed odd to me, I guess.
But still I am glad Daily Speculations made me a better person, at least judging by the books I claim to have (partially) read. Maybe someone else can explain it in terms I would understand.
Dec
29
Chance, luck, and ignorance: how to put our uncertainty into numbers
December 29, 2024 | Leave a Comment

Chance, luck, and ignorance: how to put our uncertainty into numbers - David Spiegelhalter, Oxford Mathematics
We all have to live with uncertainty. We attribute good and bad events as ‘due to chance’, label people as ‘lucky’, and (sometimes) admit our ignorance. In this Oxford Mathematics Public Lecture David shows how to use the theory of probability to take apart all these ideas, and demonstrate how you can put numbers on your ignorance, and then measure how good those numbers are.
Coffee cup he got from MI5 showing verbal-numerical scale they use.
Also: The Art of Statistics
William Huggins offers:
i like to give this guide to my students for whom English is a 2nd/3rd (sometimes 4th+ language).
Kim Zussman is unimpressed:
David Spiegelhalter was Cambridge University's first Winton Professor of the Public Understanding of Risk.
Translation: He is the most qualified of the vast array of those who don't know WTF they are talking about, but are knighted to tell us.
Peter Grieve responds:
I heard a story a decade ago about one of the big decision theorists, I think it was a Harvard professor. He was offered a position somewhere else, and was agonizing about whether to accept it. A colleague suggested he use his decision theory, and he said "Come on! This is serious!" I've no idea about the veracity of the story, or who was involved.
Alex Castaldo clarifies:
You are talking about Howard Raiffa. The story was told by another professor, although apparently Raiffa later denied that he had said it.
Sep
28
What is in Brooklyn?, from Asindu Drileba
September 28, 2024 | Leave a Comment

Lana Del Rey — My boyfriends really cool, but he is not as cool as me. Cause I'm a Brooklyn Baby. An interview recently posted here with The Chair — "I attribute your being humble to being from Brooklyn" (interviewer referring to The Chair). Another person I listen to - Such mistakes can only be made by people who have not spent a lot of time in Brooklyn. Brooklyn comes up so many times. What's is there to know about it? Of course I have heard of people talking about other cities.
But people that talk about Brooklyn always say it like there is something they know which others don't know. What is in Brooklyn? What does it do to people?
David Lillienfeld adds:
In the epidemiology world, when one of the organizations meets in Manhattan, inevitably someone will suggest to the younger members to go across the Brooklyn Bridge and experience Brooklyn. There is definitely something about Brooklyn that focuses one's thoughts.

Steve Ellison offers:
The Chair wrote a whole chapter on this topic, the first chapter of Education of a Speculator, titled Brighton Beach Training.
Laurel Kenner suggests:
Survivors go there when they get to America.
Alex Castaldo responds:
Agreed, immigrants from Central and Eastern Europe often arrived in Brooklyn as a first step towards success and acceptance in America.
H. Humbert writes:
There is a hierarchy among the real estate developers of New York. Those who develop real estate (especially large commercial buildings) in the central area (the island of Manhattan, also known as New York County) consider themselves socially above the multimillionaires who develop property in the boroughs of Brooklyn, Queens, Bronx and Staten Island. They refer to Manhattan as simply "the City" and seldom go to the other boroughs (other than to take an airplane at LGA or JFK airports, which are in Queens).
Donald Trump's father was a developer of large number of properties all of which were in Queens and Brooklyn and he considered Manhattan development too financially risky. He was quite wealthy but in view of the above was not considered a "major New York developer", like Roth, Reichmann and other well known names.
His son Donald was very ambitious and wanted to move up in society. Contrary to his father's policy he took a gamble and decided to put up a large building, the Grand Hyatt Hotel on 42d street in Manhattan. The project was completed in 1978 and Donald Trump joined the ranks of major NY real estate developers. (What the other developers thought of his operation is another subject and requires a separate article). Even if he wasn't fully accepted by all, when his daughter married a member of the Kushner family, another prominent Manhattan developer, a few years later, it confirmed that the Trump family had reached the first rank among New York's wealthy families. But Donald Trump, having overcome his Queens handicap and shown that he could do better than his father, was not quite satisfied and he decided to enter national politics.
In summary, there is a slight prejudice against people from Queens and Brooklyn, which sometimes causes people to be even more motivated to succeed and be accepted.
In addition Brooklyn has its own distinct accent, which causes the prejudice to be slightly greater. If you would like to know what a Brooklyn accent sounds like you can listen to any speech by Janet Yellen. When she was in line for a top job in Washington, a previous Treasury secretary (probably hoping to get the job himself) mentioned her accent as a reason she should not be appointed. She got the job anyway. Another success for Brooklyn.
Jeff Watson gets musical:
Steely Dan nailed it.
Aug
18
A Spec recalls fondly
August 18, 2024 | Leave a Comment

Back in the day, Chair treated spec-listers to a night of classical music at Lincoln center, then dinner at Picholine. It was an unsurpassed evening, especially in generosity. The last course was a cheese course, and the restaurant's cheese sommelier - Max McCalman - made a short presentation about the wonderful cheeses being served.
This was Mrs and my introduction to fine/delicious cheeses, which we enjoy to this day. Max showed us his book The Cheese Plate, and immediately Chair offered free copies to all the ladies in the room and asked Max to autograph them. The Cheese Plate remains a valued book in our collection.
Here is Max and an aficionado.
Alex Castaldo adds:
Yes, I remember that dinner well! Vic took guests to the best restaurants of New York in the early 2000s (Boulud, Le Bernardin, Picholine, Four Seasons, etc.). Those were great occasions, that I will always remember. Met some knowledgeable people, including Henry Gifford, on some of those occasions. Unfortunately I also remember that I never adequately thanked Victor for his generosity. Which I regret.
Jul
17

I don't have much knowledge of foreign exchange, although I admire and envy people like John Floyd who do. In 2017 I was interested in the idea of using PPP (purchasing power parity theory) to select countries that might be good prospects for stock investing over a 4-5 years horizon.
Looking at 2 different publicly available PPP rankings I noticed that SAR (South African Rand) was considered undervalued approximately 50% (!) on a PPP basis. In addition after several years of mismanagement the country seemed ready for a turnaround (bad policies cannot continue indefinitely). I purchased some shares of EZA (IShares South Africa ETF) in October 2017 at 59.36 usd a share.
Today, 7 years later, EZA is at 44.32 a share. More interestingly SAR is considered undervalued by 52.5% (on one of the 2 rankings, I can't find the other at the moment) and has been one of the most undervalued currencies throughout this period.
My mistake was not to do a thorough historical study of stock markets of countries that are undervalued on a PPP basis, and giving too much credit to the academic theory that PPP undervaluations are substantially corrected in 4 or 5 years time. Clearly some countries (eg Switzerland) can stay PPP overvalued more or less forever, and some like SAR can be consistently undervalued more or less continuously.
I learned my lesson.
Humbert H. writes:
I have been involved in raising private equity funds for emerging markets (Asia, Latin America, and Sub-Saharan Africa) since 2004. I have been specifically focused on Sub-Saharan Africa since 2017.
In my view and the view of others who I know that have been tasked with raising capital for these markets over the past 20 years, investors in these markets have not and do not get paid for the risk they are taking.
Nils Poertner responds:
maybe you are right on SA. am interested in the liquid stuff - and that is already a challenge in some of the EM markets.
Bruce Kovner used to say that most investors never really practise much imagination and test new ideas- they tend to go along with what others tell them - and then repeat the learned ideas (as their own). keeping this in the back of the mind everyday (even intelligent ppl forget that).
H. Humbert comments:
Investing in places where property rights are fundamentally not respected just isn't worth it because you can't calculate the risk. I've always considered Russia uninvestable, had one Chinese stock, would never buy any stock in a country led by a dictator. I do have a Mexican stock but in general avoid highly corrupt countries. SA is just too full of crazies to calculate the risk. The US love of sanctions and confiscations of Russian assets and the desire to impose wealth taxes endangers property rights and thus the overall level of attractiveness. At the moment, looking what happened in France, that makes it un-investable. When an Antifa leader leader on the national security watchlist gets elected to the National Assembly and and admirer of Hugo Chavez and Fidel Castro has a realistic path to be PM, watch out.
Henry Gifford responds:
Investing in places where property rights are fundamentally not respected just isn't worth it.
Indeed there is no need to look to outside the US to find examples. Just buy an apartment building in New York City and try to make a profit with the politicians telling you how much rent to charge. A politician looks at an apartment building and sees the owner as one vote, but the tenants as a large number of votes, thus the politician "buys" votes by "giving" low rent to the tenants. A few years ago the property owners in California lobbied for universal rent control on all properties, and got it, out of fear of a worse version passing into law.
In general avoid highly corrupt countries: In New York City it is impossible to get a gas or electric meter installed without a cash bribe to a utility company employee, and almost impossible to get any improvement to a building, including a single-family house, past inspection without a cash bribe to a city inspector. And the sanitation police who come fine store owners $250.00 for a cigarette butt or a leaf on the sidewalk (or on the street within 18" of the curb) have been reported paying their supervisors to assign them to areas with lots of stores, not single-family homes, so they can collect bribes for not fining the store owners $250/day.
Yes, it is possible to do honest business in New York, but it is very, very hard. I have never paid a bribe but don't make nearly the money I would if I did. Things are getting worse this way in New York City, which is perhaps the future of the US as the idea that our chair says has the world in its grip gets ever more popular.
I think Mr. Humbert's advice is very wise, but amounts of socialism and corruption are relative - find someplace completely free of both and I will move this afternoon.
Pamela Van Giessen suggests:
Wyoming might be the closest we get to corruption and socialist-free from what I can tell. Corruption, tho, is hard to uncover from a distance.
Dec
18
TLT follow-up, from Big Al
December 18, 2023 | Leave a Comment

TLT was way down since we discussed it at the end of August. Interestingly, HYG down nowhere near as much and still ahead of TLT YTD. My intuition would *not* be to see a narrowing of the spread between UST and HY.
Zubin Al Genubi responds:
Bonds have positive convexity, and will experience larger and larger price increases as the yield falls.
Alex Castaldo explains:
I am disappointed that the major ETF web sites (etfdb.com, etf.com, etc.) don't seem to give Duration values for Bond ETFs in a reliable and consistent way (sometimes they have it sometimes they don't). With a little effort I was able to find the following on 2 different sites:
TLT Portfolio Data
DURATION 16.11
YIELD TO MATURITY 5.19%
HYG Portfolio Characteristics
Average Yield to Maturity as of Dec 15, 2023 7.64%
Effective Duration as of Dec 15, 2023 3.37 yrs
Assuming these are both correct, up to date, etc. we can see that the Duration (responsiveness of price to yield change) of TLT is about 4.7 times that of HYG. And this is quite common when comparing high yield and high rating bonds (or bond funds).
Zubin Al Genubi adds:
Convexity, along with duration explains bank issues with rapid yield changes, and TLTs rise this month.
Dec
15
Why does Japan have a CA surplus? from Alex Castaldo
December 15, 2023 | Leave a Comment

Not for the reason I thought:
Japan’s current account surplus may not be a surprise to those of us who remember Japan as a major exporter. But a closer examination shows that the current account surpluses recorded today are NOT DUE TO THE TRADE ACCOUNT but rather the net primary income balance. Japan used the trade surpluses of the 1970s and 1980s to build up its holdings of foreign assets and prepare for the day when it would need income from abroad to pay for its aging population. Last year, according to The Economist, the country earned a net $269 billion on its primary income balance, equal to 6% of its GDP.
Oct
9
Remote viewing? from Nils Poertner
October 9, 2023 | Leave a Comment

For the military guys here- does remote viewing work? friend of mine - a statistician - who was tangentially involved decades ago- said what is striking: "those who didn't believe in it - scored worse than chance". Can imagine that.
I go with the notion it may work in rare cases - but when it comes to forecasting mkts - one may run into many new challenges. probably takes time and would require years of training. not exact science anyway. could help with overall intuition perhaps.
Alex Castaldo is skeptical:
"those who didn't believe in it - scored worse than chance".
Trying to salvage something from a negative experimental result. Reminds me of "Well, our anticancer drug failed in a large sample test, but it seemed to work for left handed women between 65 and 75 years of age. That's very promising". Shifting the analysis to a question other than what was asked.
Nils Poertner responds:
for trading (or life in general) - it is good to be skeptical- and don't believe anything that comes along. on the other hand, one wants to keep the option of some (pleasant) surprises that one does not know everything. Controlled RV was used by the Military to my knowledge. that itself is a hint it may work.
Eric Lindell asks:
were these controlled experiments where either the viewer or viewed were in a faraday cage? Personally, I think there are two possible outcomes statistically: chance and not chance.
I'd like to see a rigorous study of remote viewing by those who don't believe in it — with faraday and standard scientific controls. I'd be surprised if it held up. You would need an objective measure of similarity of appearance between viewed and vision — which itself would be hard to gauge — statistically or even anecdotally. The faraday control especially is key to identifying the question itself — let alone its answer.
Humbert H. writes:
I've seen at least two Sci-Fi type movies where the remote viewer is tortured by all the evil he can see to the point of not being able to live on. I would say there are enough people in this world who wouldn't be troubled by seeing evil if they can become really rich, so I would say there is no real evidence of statistically significant remote viewing.
Steve Ellison comments:
There is a huge problem in academia, where the paradigm is "publish or perish", of research that can't be replicated. A 1940 study by Rhine and Pratt that found evidence of extrasensory perception was the original poster child for this problem. A big part of the problem is the traditional significance cutoff of p = 0.05. That's a reasonable starting point, but when thousands of researchers are working at any moment, 5% of their studies will reject the null hypothesis purely by chance. It adds up to a lot of non-replicability.
I have often thought that an advantage for those of us who are scholars of the market is that we don't have any pressure to publish and hence don't need to force dubious findings into practice. Instead of a pat on the back for being published, we get a cruel but not unusual form of "capital punishment" if our backtests can't be replicated in the market.
Anders Hallen actually finds research for critique:
Stock Market Prediction Using Associative Remote Viewing by Inexperienced Remote Viewers
Jul
6
The Chair poses a question
July 6, 2023 | Leave a Comment
how has the evolution of regularities in markets made it much harder to beat the 52% accuracy that no sports better can achieve to break even? one way is the ever changing relation between bonds and stocks between years. what else?
Larry Williams writes:
Crude's influence on stocks [has changed over time]
Alex Castaldo offers:
The Great Financial Crisis of 2007 and 2008 revealed a number of regularities that (I believed) would be very profitable in the future, but careful monitoring of them after their discovery proved very disappointing to me. For example, trend following that would have gotten you out of stocks and back in during that decade did not work well in the Covid crisis with a faster decline and faster recovery.
Nils Poertner comments:
a mystery indeed - some folks have lousy accuracies (say sub 25pc) and still do well - since a few things they do on top turn out great, eg, the lousy equity trader who got into ethereum early enough (and out when others got into it).
Kim Zussman adds:
Yield curve inversion from 3 months and 500 points ago:

Hernan Avella comments:
Like sports, the evolution of markets is guided by the fitness of the players. We are not competing against prospective cab drivers trading in the pits anymore. But armies of highly talented people that invest thoughtfully and systematically in every step of the process: Infrastructure, trading business practices, research, execution, recruiting. I have a friend working in one of these highly capable groups. Around 70 people. All markets 24 hours, every single approach possible.
Very few of us from the old days survive. The Chair might be the oldest and longest lasting point and click trader. Such a great competitor!!! Ray Cahnman, founder of Transmarket Group is up there as well.
Vic replies:
the point-and-click survivor owes it all to Lorie and Dimson who taught there is a drift. also one learned not to succumb to conspiracies to margin one out.
Jared Albert writes:
Modern technology, particularly around real time customer segmentation and portfolio correlation, squeezed more value from the 'customer as the product' than before.
May
29
in what other areas, apart from financial markets and sports betting, is there vig? and what is really relevant for everyday life? and how to avoid it?
maybe we don't see it that way because of Gell-Mann Amnesia affect.
Hernan Avella responds:
There’s a rich literature on rent-seeking behavior. It’s pervasive, Pharma, Telecom, Agriculture, Natural Resources. Not all lobbying is RS but the majority is.
Vic asks:
is there a universal law of vig where it goes to 2% in all activities like sports betting?
Jeff Watson offers:
I wrote this in 2009 about vig:
The Vig Keeps Grinding Away, from Jeff Watson
Steve Ellison comments:
Games that advertise that they're commission free usually charge the highest vig of all …
Mr. Watson's statement was written well before all the retail brokerages offered commission-free trading, which I contend simply means convoluted execution that costs customers much more than the $7.95 commissions that existed previously. "Where are the customers' yachts?", indeed.
Separately, the way the CME evolved is a good example of the Professor's constructal theory that all systems evolve to increase flow and velocity.
Hernan Avella disagrees:
Your insights on electronic trading seem to lack sufficient grounding. Abundant evidence disputes your hypothesis, highlighting the significance of the percentage extracted rather than the total volume. The evidence is clear that more opaque markets, like credit and emerging debt, are more expensive, for everybody except for a selected group that invests heavily in keeping the status quo. Electronic markets are more transparent, more anonymous, standardized, continuous, centralized, offer multilateral interaction and informationally more efficient.
Zubin Al Genubi responds:
Give the evidence then, if its so abundant, rather than your usual vague negative comments.
H. Humbert comments:
The beauty of long term investing is there's no vig and there are no taxes, other than once or twice in a few years.
The origin of the word is interesting. It's a Yiddish corruption of a Russian (or some other Slavic) word pronounced "vi igrish" or "gain", but it's more like "winning in a game", and the root means "game".
Alex Castaldo adds:
Interesting. The word can be found in online Russian dictionaries.
"vigorish" has a similar pronunciation, though the meaning has changed to be the fee for the game instead of the winnings.
Nils Poertner writes:
we want to battle against vig in all aspects of our lives. almost build a register where there is vig and share it with family and friends.
Henry Gifford comments:
Vig is one of the many things I find it helpful to view with an understanding of the laws of thermodynamics. The laws of thermodynamics describe the movement of heat in the universe, and because all energy is either heat now or becoming heat, they could be called the laws of heat.
The idea of “follow the money” to understand a system or organization or relationship is closely parallel by “follow the heat”, and heat follows clearly defined laws.
In approximate inverse sequence to importance, the fourth law says that if things A and B are at the same temperature, and things B and C are at the same temperature, then things A and C are at the same temperature. This is also called the zeroth law because it is so basic it should have been thought of first. The fourth law reminds me of the unlikelihood of much true arbitrage existing.
The third law says nothing can be cooled to absolute zero, because that would require something colder to absorb the heat, and nothing can be colder than absolute zero.
The first law says energy can neither be created nor destroyed.
The second law, most analogous to vig, says that heat always flows from hot things to cold things, and never flows the other way on its own. This law is the most profound, with many implications.
For example, one implication of the second law is that a car engine cannot convert all the energy in gasoline to mechanical energy - some will leave as heat that is not useful (except for heating the passenger compartment during the winter). Vig. A utility power plant burns fuel and about 31% of the energy in the fuel gets to the customer’s electric meter - 5 or 10% transmission losses (heat escaping from wires is “lost” - see first law), the rest is waste heat at the power plant. Vig. Various devices can reduce the amount lost to heat, but these devices have too high a vig themselves.
Big Al adds:
The first law makes me think of markets (not the Fed or banking) where money is neither created nor destroyed. For example, in the FTX collapse, the media talked about all the money that was "lost". But of course it wasn't lost, it was simply transferred from one group of entities to others.
Hernan Avella critiques:
This line of thought fails empirically when looking at deflationary crises, loss of crypto keys, central bank operations, bad loans, bankruptcy.
Henry Gifford responds:
Loss of crypto keys and central bank operations both follow the first law - printing money leads to inflation (if inflation is defined as a lowering of the value of money), destroying some of the money in circulation by losing keys, or destroying a dollar left in the pocket of clothing getting washed, increases the value of the remaining money.
I have heard the term “deflationary crisis” before, but don’t believe there has ever been a crisis whose root cause is the increase in the value of money.
In the saving and loan crisis of the late 80s, lenders sometimes asked borrowers to make sure they borrowed enough to make the payments for two years, as it was taxpayer money being lent out, and the lenders were collecting enough vig to make it worth going under I s couple of years.
A bankruptcy stops wasteful behavior, and the threat of bankruptcy causes people to take steps to prevent it. But I guess the waste in a government can continue forever, apparently violating the first law, while also proving that a perpetual motion mechanism really can exist, violating both the first and second laws.
Larry Williams comments:
printing money leads to inflation—data does not suggest that to be true
Jan
2
Thoughts on EUR for January 2023, from Alex Castaldo
January 2, 2023 | 2 Comments
I do not focus on foreign currencies in my trading. And there are people here, such as Mr. John Floyd, who are far more knowledgeable about FX. So some of you may find these thoughts a bit simplistic; keep in mind I am an amateur!
I believe that a factor that makes a country's currency attractive to investors is the success (or lack thereof) that foreign investors have investing in the country in question. We can gauge this success by using ETF's that specialize in particular countries. For example SPY measures the performance of stock investors in the US, while EZU tracks investing in Eurozone stock markets.
What do we see? In recent months EZU has been performing better than SPY. For example in the last 6 months of 2022 SPY had a total return of 2.03% and EZU 9.56%. For 2022 as a whole SPY -18.38% and EZU -16.67%, two ugly numbers, but EZU did better. (These numbers will change between now and Dec 31, but not by much).
In my view this kind of comparison (especially given that Europe did poorly the previous few years, so it's a remarkable turnaround) will attract additional US investors to Europe, strengthening the currency. That is why I am bullish on EURUSD for the month of January 2023.
Bud Conrad responds:
Your logic is that if the stock market of a country rises, the currency of that country will rise in exchange rate. In the early days of this Speclist, the chair would ask me if I had "counted" the historical experience, which you cite for the last six months and year, but usually you need something like three cycles of inflection to get confidence.
The more usual comparison for currency strength are the Interest Rate Parity, using the futures market expected exchange rate and the difference in Interest rates.
And there the International Fisher Effect, also described here.
Often international traders look at trade balances for the country that has a trade surplus to be more attractive so the currency might rise. Trade surpluses mean they are a lender and not in debt to other countries. The US is the world's largest debtor, but the currency has been doing well.
John Floyd writes:
Doc makes the broadest, cleanest, and most accurate point about what drives currencies: what are expectations for return by BOTH domestic and foreign participants, and how does that drive investment flows into equities, FI, FDI, etc, which shows up in the BOP and Capital Account - on the other side of the ledge is the Current Account and the Errors and Omissions.
Admittedly I don’t know much about currencies and this is the area I know least about, but flow data is well researched and document by many at banks, independent research firms, IIF, IMF, BIS, etc. One challenge is it is often very much lagged, so Doc’s idea of looking at actual market instruments makes sense, and this is often particularly useful for emerging markets.
Capital account flows can fund a current account deficit for a very long period of time. Look at the US now or look at the Asian Currencies pre the crisis: errors and omissions become important given capital flight, particularly EM. Think Russia pre ’98 and Swiss bank accounts, etc.
As Doc well knows infinitely better than me, we need some more data and this can all be tested.
More broadly, outside of equity flows, Bud’s point of interest differentials will drive some capital flows. Also consider FDI from Europe to North America to diversify dependence on European energy costs and to friend shore manufacturing capacity.
And I would be remiss to not mention Italy (sorry Doc). Italy is in a Euro straightjacket that not even Houdini could get of. ECB is tightening with inflation at 10%, Italy 150% debt to GDP, Italian per capita GDP is barely higher than when joined Euro in 1999, Italy needs circa $250 billion in funding in 2023, 10 year yields in Italy up from 1 to 4.5%, all Italy issuance past few years was essentially bought by the ECB. This is not politically sustainable. Just look at the evolution of recent German politics. The ECB’s TPI is there but is intended for temporary dislocations and will require Italian political concessions. Oh and Italy is 10x Greece and the world’s 3rd largest sovereign debt market behind the US and Japan.
Read the full discussion here with additional contributors and charts.
May
29
Financial Analyst Journal, Vol. 26 No.2, pages 111-113:
The above Tables I and II […] show that the traditional Wall Street belief concerning the market's preference for Republicans is in accord with observed market movements surrounding Election Day.
If this Republican bias were justified, one would expect the market to perform significantly better during a Republican administration than during a Democratic one. To test this hypothesis, we looked at every year since 1897 and classified it by party in power and by its yearly position in the administration. The following table summarizes the results:
Year Republican Democratic
1 6.88% 10.35%
2 10.18% -1.21%
3 -6.84% 20.76%
4 7.15% 3.50%There appear to be no systematic differences in the performance of the market during Republican and Democratic administrations, except that during the third year of Democratic administrations the market performs significantly better than during the third year of Republican administrations. Thus, there appears to be no long term pattern in market movements which would justify Wall Street's Republican bias.
For those who would like to know: This article was written by Victor Niederhoffer, Steven Gibbs and Jim Bullock. It was published in the March-April 1970 issue of FAJ.
Zubin Al Genubi comments:
This year is on track with regularity. Will next year be up big contrary to all the bearish pundits?
Jan
19
Shipping Container Homes, from Bo Keely
January 19, 2022 | Leave a Comment

I’ve reviewed elaborate videos and glossy books on shipping container homes at the high scale end. It’s far simpler for cheap. I’ve lived in two containers in different valleys and it’s as easy as going to the bread aisle at the grocery store.
You go to the vendor – around the Salton Sea it’s the Calpatria hay store or trucking companies near the border. You pick out a used one from the lot, fork over $1-2000 that includes transportation, and lead the flatbed with your new home out to your place. The driver slides it onto pre-laid RR ties, you put a lock on the door, and celebrate the new home.
The biggest advantages are it’s difficult to rob, arson, or blow over like in the Three Little Pigs, and without building codes since it’s on skids.
I had no idea on moving into my first container in 1999 on the Sonora that I was looking into the architectural future. I installed a loft with waterbed, office with a solar powered laptop, and garage beneath a trap door. Chilled air rose from the garage through stovepipes into the interior and vented hot air out the roof. A satellite dish pulled in the Nature and History channels on an upside-down B&W TV. A pet packrat was a muse and road partner in search of gold in abandoned mining camps that it had been trained to retrieve. We drove two hours to sub-teach when mining was poor.
Then, in 2013, I owned the first container home in Slab City and am as content as a clam. There are three more now, the nearest scavenged and dragged from a bombing range target and riddled with hundreds of high-caliber holes. The second was towed from the Mexican border and is hemmed with painted flowers. And, the third was trucked from Los Angeles and converted into a church.
I thought I was on the vanguard of a would craze that is verified.
In the South Africa capital of Johannesburg, thousands of brightly colored boxes piled on and around each other, are stacked and re-stacked, and hauled away on trucks and freight trains, as homeowners decide where they want to live or sell. In Sudan, a prison is built of old containers slammed together. That’s how secure they are. Now container architecture is a hip fad in European cities for offices and homes. London has one of the biggest housing projects in the world of containers, and Amsterdam has the largest student village with over 1000 containers.
In USSR, shipping containers are used for market stalls and warehouses. Southeast Asia bazars are typically double-stacked containers. New Zealand earthquake rocked malls were rebuilt of shipping containers in the business districts. A Tokyo company provides container modules for multi architectural use. Prefab container homes are bomb across China. Google barges ply the seven seas with superstructures of stacked containers.
Shipping containers were invented in the USA in 1953 when trucking businessman Malcolm McLean gave a lot of thought when, frustrated by the glacial pace of overnight freight transport on the American highway system, he fashioned a set of stackable aluminum boxes and outfitted a decommissioned tanker ship to shuttle boxes of cargo up-and-down the eastern seaboard. In the next two decades, it spread over the oceans to other continents to radically change the face of global shipping. No longer does cargo have to be loaded and unloaded by a cadre of dock workers. Suddenly, the major cost of getting consumer goods around the world efficiently dissolved, and with it, many millions of boxes have been built and shipped, trucked, and trained, and now lived in.
Today, at any given moment, there are about 20 million more bobbing across the ocean or sitting in ports around the world. Union Pacific trains slide them three miles from my Conex home, and hobos know that a ride on a container train is a cannonball to any destination.
The sky is the limit. I think shipping containers will advance to fill into our architectural dreams for city projects, apartments, condos, hotels, and single housing units. Shipping containers are legal homes in California and elsewhere. They are cheap, built like a tank, fit the Golden Ratio, fast to construct, without codes, with high resale value, and can be moved as your heart pleases.
Alex Castaldo comments:
I have never lived in a container, but I would not recommend it. They lack the natural insulation properties of a wood or brick home, so they are chilly in winter and hot in summer. There is also the problem of no windows….
Larry Williams responds:
They work well here in the usvi where folks put 2-3 together for L or U shaped home.
Henry Gifford expands:
A steel box leaks almost no air unless doors and windows are installed in a sloppy way.
In rare cases, a building's heating and cooling loads are actually calculated before equipment is chosen. The job involves lots of measuring, and some simple math in the case of heating, and some fancier calculations for cooling loads.
Having calculated the heating and cooling loads of each room in many buildings over the years, I have found that very roughly half the peak and annual heating loads for a building are attributable to cold outdoor air leaking through the building, about one fourth is heat transmitted (conducted and radiated) out the walls and roof, with the other one fourth going out the closed windows. This is a rough generalization, but about equally true for old, poorly insulated buildings and new, very well insulated and airtightened buildings.
So, the lack of air leaking through a shipping container goes a long way toward comfort - it eliminates maybe half the heating load. And without the usual chemical soup of construction materials (glues, sealants, caulk, paint) in a normal house, the need for ventilation for health is reduced to a smaller amount. As few houses, old or new, are ventilated (few people open windows, as they also admit cold air, hot air, humidity, insects, rain, snow, and criminals), reducing the need for ventilation is a nice thing.
One way to explain the leakiness of normal construction is to point out that a person can hold a concrete block to their mouth (or a piece of a block) and breath in and out at a rate sufficient to satisfy the needs of an adult. I don't recommend vigorous exercise while trying this, but the point is that normal, sturdy looking materials leak a surprisingly large amount of air. The leaking is worse at connections between materials, and even worse than that at connections between assemblies (walls to roof, etc.).
Cooling loads are much more complicated mathematically because of the effects of humidity on indoor comfort, and because a cooling load calculation has to account for solar gain into windows (usually the largest part of a cooling load for a house), internal gains of heat and humidity from cooking, lights, showering, breathing, etc. Numbers for heat and humidity output from a bowl of soup or a lab mouse can be looked up, and are useful for calculating the cooling load on a restaurant or a medical lab.
The total lack of windows, or lack of numerous large windows in a shipping container goes a long way to keeping a shipping container comfortable during the summer.
Bo Keely responds:
You make the mundane details of buildings interesting, and this more than usual. The only air leaks in my container are fork holes where they loaded it over the years. This brought the price down to my wallet. I choose to not plug them near the roof as they vent the air in the summer. Where there is air, there is sound. My almost hermetically sealed box is soundproof. Also, roaches and rats can't get in. These are things money can't buy in Manhattan. I've never been so content.
Dec
27
Beating the Stock Market
December 27, 2021 | Leave a Comment
Beating the Stock Market, by R. W. McNeel (1926), could have been written by Graham in 1950 and contains the worst advice for customers that could have been given 1000 years ago and is still being given today: "Stocks are to be bought at low price - and only by so doing can one make money." the idea is that when stocks are low, people get frightened and at these times they would not think of taking money out of their banks and buying stocks. the idea is to sell when stocks are high, get out of the market, wait for the inevitable decline and then get back in. This is almost like it was written by Alan Abelson and his current day followers except that even after the 1987 fall where stocks fell 30% to Dow 400 the former was still bearish and called the decline a start.
What are the problems with this approach? (1) the market is more bullish at a new high than at a new low. (2) the stocks that go up the most have a higher expectation than the stocks that are down the most. (3) the market has a 10,000 fold a century drift upwards and thus you can never never be successful if you get out and wait for the "inevitable drop". (4) growth stocks perform much better than value stocks.
Other bad advice in the book which reads like it was written today is never buy new flotations as Rockefeller and Morgan lost money. Rock and Morgan lost money when they didn't stick to their list and invested in railroads. New Haven and Colorado Fuel and Iron were their downfall.
all these counter to the terrible and destructive advice in the book and other uttered today in the media must be tested. I will endeavor to provide such tests here in the near future.
here's a more current version of McNeel but the original book that Alan Millhone gave me as present was written in 1926.
James Lackey writes:
My immediate question is why are these books sellable? We realized they get published because as Pam might say that’s what book sellers do. She’s one of the many book published experts on this list.
Perhaps Vic's advice which is granite rock solid is that it seems too easy! To be honest I thought that as a young spec. Now I realize this:
It’s hard to be bullish all the time.
Everyone calls us fools.
Then they point out our faults.
If we dare share logic and my goodness statistical data to prove why we are bullish all the time they weaponize our insecurities. The bears are smart and have very good arguments. They can be spiteful mean men. I’d be an old mean SOB too if I was wrong on average about everything.
Alex Castaldo adds:
It has been more than 25 years since I read this book in the reading room of the New York Public Library and I don't have a full recollection of it. I went to read it because it was mentioned in another book (or article) by Dean LeBaron and the library seemed to be the only place to find it. At the time I was reading as much as I could about investing, both recent works and what others considered "classics".
The main point of the book I thought was the importance of independent thinking in investment. The author points out that most people are like sheep and follow what they hear from others. A good investor should guard against this and try to come up with his own judgements. If I recall correctly the author coined the term "contrarian investing" to describe this. He explained that "contrarian investing" does not mean believing or doing the opposite of what everyone else does or believes. Rather it means doubting what others believe and being willing at times (but not all the time) to take a different position.
I did not dislike the book. I did think it perhaps a bit too obvious. If you are going to "outperform the market" almost by definition you have to do something different than what everyone else is doing. Also, it may be easier said than done. Some people, such as the Chair, seem to be good at coming up with their own opinions, but most people are somewhat conventional and it is not clear what they could do to change. Would just being aware of the need to think independently be enough?
I also thought the term contrarian does not seem the best choice for what McNeel is trying to describe. (It sounds like mulish opposition to what everyone believes). "Independent thinking" or the term coined by Michael Steinhardt "variant perception" seem more appropriate to me. But still it was interesting to see what the originator of the term thought it should mean.
Feb
11
What Does Dr Burry Mean by His btc Mining Tweet Today
February 11, 2021 | Leave a Comment
Alex Castaldo writes:
what does dr burry mean by his btc mining tweet today
(20) Cassandra on Twitter: "70% of $BTC is mined in sanctioned countries, China, Iran, Russia. Crypto is in a race - add enough reputable agents of commerce to counter and overcome the inevitable coordinated actions of the ECB/BoJ/Fed/IMF/WorldBank-level powers-that-be to crush it. https://t.co/glYdmeTJ4g." / Twitter
70% of $BTC is mined in sanctioned countries, China, Iran, Russia. Crypto is in a race - add enough reputable agents of commerce to counter and overcome the inevitable coordinated actions of the ECB/BoJ/Fed/IMF/WorldBank-level powers-that-be to crush it.
Pete Earle writes:
He's saying that BTC needs to grow its network and become a more compelling medium of exchange in order to survive the likely outcome of the governments and monetary authorities in China and Russia (Iran?) putting severe criminal penalties on its mining and usage. Meh.
Does not follow that if mining were quashed in those countries other miners elsewhere wouldn't fill the gap, but it would be a bumpy ride and the price would almost definitely suffer. (There's also the remote chance that in the tumult that would follow miners going offline there could be a 51% attack.) But it strikes me that when an illicit enterprise becomes big enough (gambling, marijuana, etc.) governments would rather become privileged providers and gatekeepers than suppressors.
Jayson Pifer writes:
Burry seems to be missing that cheap electricity wins. It's not a matter of simply adding reputable agents when they will not be able to scale to compete with Chinese miners. Not to mention that those sanctioned countries are incentivized to mine heavily and therefore keep the security of the network high. I don't really see this changing.
I'm curious what sort of coordinated actions he supposes will be taken by the power-that-be. For the foreseeable future it appears to be concurrent debasement of currencies to the benefit of cryptos.
I forget who on the list was running a mining operation, the information shared was valuable. Perhaps we could get some recent insight.
Dec
1
Something I Noticed in The Tbond Futures Roll
December 1, 2020 | Leave a Comment
Alex Castaldo writes:
Last Friday was the day to roll long positions in ZB futures: to sell
the December futures (which are nearing expiration) and buy the March futures instead. I noticed something a little puzzling. For the last 2 years the far away (new contract) future was cheaper than the nearby one (the old contract). But last Friday it was the opposite:
> 2PriceDate old contr new contr oc price nc price roll cost
> 05/30/2018 ZBM8 ZBU8 145 14/32 144 19/32 - 27/32
> 08/30/2018 ZBU8 ZBZ8 144 31/32 144 7/32 - 24/32
> 11/29/2018 ZBZ8 ZBH9 140 4/32 139 16/32 - 20/32
> 02/28/2019 ZBH9 ZBM9 145 4/32 144 15/32 - 21/32
> 05/30/2019 ZBM9 ZBU9 153 2/32 152 14/32 - 20/32
> 08/29/2019 ZBU9 ZBZ9 166 2/32 165 8/32 - 26/32
> 11/27/2019 ZBZ9 ZBH0 160 3/32 159 10/32 - 25/32
> 02/27/2020 ZBH0 ZBM0 168 16/32 167 15/32 -1 1/32
> 05/28/2020 ZBM0 ZBU0 178 21/32 177 2/32 -1 19/32
> 08/28/2020 ZBU0 ZBZ0 176 14/32 174 25/32 -1 21/32
> 11/27/2020 ZBZ0 ZBH1 173 28/32 175 1/32 +1 5/32
As long as short term interest rates (repo rates) are positive, it would seem that an object delivered 3 months further away should be cheaper than the same object delivered 3 months sooner. (The good old Time Value of Money). Which makes me think that the Cheapest to Deliver for ZB March 2021 must be different from the CTD for ZB December 2020 if the March is priced higher? But I am not sure if this explanation is correct. And I find it disturbing that even though I traded tbonds for a while I do not fully understand some of the basic mechanics. Do you have any insight? Why did the price difference (technically know as the Roll Cost) flip like this?
George Zachar writes:
On Bloomberg, pull up USZ0 and USH1 CMTY DLV.
The cheapest to delivers did change:
Z0 = 4.5% '36
H1 = 5.0% '37
Nov
23
Change in Settlement Procedure for S&P Eminis
November 23, 2020 | Leave a Comment
Alex Castaldo writes:
BUT THIS IS NO LONGER THE CASE. Since Monday October 26, 2020 the CME always uses 4pm as the settlement time. So the 4:15 price and the settlement are now different every day, not just on the last day of the month.
Steve Ellison writes:
Thanks, Doc. I had done a double take a couple of times when the S&P 500 settlement price was completely outside the range of the last 15-minute bar. For example, on November 12 the range of the 16:00-16:15 period was 3543.75 to 3533.00, but the emini settlement price was 3532.50. Because I do intermarket analysis, I have long kept a separate database of each day's 16:00 price in the S&P 500 and other markets (US Eastern time).
Victor Niederhoffer writes:
more important what is the predictive properties of the move from 1600 to the real 1615 price
Nov
16
Views on Financial Transact Tax
November 16, 2020 | Leave a Comment
Alex Castaldo writes:
Hello fellow Spec Listers -
I'm curious as to anybody's informed take on the likelihood of the implementation of a Financial Transaction Tax, especially at a Federal Level - as this would quite materially harm our craft. Looking to learn more, and to prepare if necessary by pivoting asset classes / markets etc.
Kim Zussman writes:
https://som.yale.edu/faculty-research-centers/centers-initiatives/international-center-for-finance/data/historical-financial-research-data/st-petersburg-stock-exchange-project
Aug
24
American Odds
August 24, 2020 | Leave a Comment
Alex Castaldo writes:
On this web site https://www.oddsshark.com/politics/2020-usa-presidential-odds-futures the American Odds for Biden to win are quoted as -135 and for Trump +115
For those not familiar with America Odds here is how you convert AO to a probability
if AO < 0:
prob = |AO| / ( |AO| + 100)
else
prob = 100 / (AO + 100)
So the probability for Biden is 135/235 = 0.574
and for Trump 100/215 = 0.465
Richard Owen writes:
What is the origin of the AO format? It was deemed more accessible to punters to speak in terms of $100 units? Is the negative sign subconsciously in front of the favourite to dissuade people from betting the favourite? Old school bookrunners tended to be overweight the favourite winning, but now tend to be hedged?
Stefan Jovanovich writes:
I hate to disagree with Jeff about anything regarding gambling, but he is ignoring what he knows about hedging. The amount of money actually bet online on American politics is - at most - a tiny fraction of what is wagered on sports. The success of DraftKings alone confirms this.
https://sportsbook.draftkings.com/help/sports-betting/where-is-sports-betting-legal
The line on Predict-It and other politics wagering sites can be moved with a bet that will have zero effect on any of the dozen parlays that are offered for the next Liverpool match. Since the actual wagering does not need to be balanced by the bookies, they can set whatever line will attract the most attention and give them the most publicity and general traffic. Political odds are used the way Sam Walton used the stacks of peanut brittle when he started with his J. C. Penney stores. He put them on the sidewalk or just inside the entrance and the people walking/driving down Main Street have to take a look.
Biden and his odds are the peanut brittle. Odds favoring Trump would have the opposite emotional effect.
Jul
11
Coming back from behind
July 11, 2020 | Leave a Comment
Alex Castaldo writes:
Heres the skinny. from math puzzles volume 1, by presh talwalkar. doc here. from nature walk. originally to stretch aubrey's mind . odds of a comebak victory
Consider 2 teams a and b that are completely evenly matched. given that a team is behind in score at half time, what is the prob that a team will overcome the deficit and win the game. assume the first halve and the second half are taken to be independent events. Presh solves it as follows logically:
Since the two teams are evenly matched, it is equally likely that the team will score enuf points to overcome the deficit or that it will not score enuf points. fo example the event of falling behind 6 pts in a half game happens with the same prob as gaining 6 pts in a half game. He concludes prob is 0.25
Now we posted the empirical resutls from basektaball games and many others have given the empiriclal results for football games … and i gave some results for the markets.. this seems to be of interest to everyone , had the most views of any posts, and it was good for 7 or 8 points today.. lets have your discussion and solution of this problem. presh says the answer is 0.25 both empirically (NFL in 1995) and logically.
Jared Albert writes:
In a game with two teams where in the first round, the team 1 advantage varies from flat to all the points available in the second round, the probability of team 0 coming from behind to win are in array with 20 available points in the second round:
[0.49, 0.306, 0.22, 0.129, 0.09, 0.03, 0.018, 0.011, 0.004, 0.002, 0.002, 0.0, 0.0, 0.0, 0.0, 0.0, 0.0, 0.0, 0.0, 0.0]
For example, if the teams are even going into the second round with 20 available points, .490 chance that team0 wins; with a one point advantage to team1 at the start of round2, team0 wins .306 of the time;
2 points to team1, team0 wins .220 of the time etc
Here's the montecarlo:
import numpy as np
np.random.seed(10)
out_list = []
out_list = []
count = 1000
win = 1
lose = 0
team0_start = 0
team1_start = 0
size=20
def runs():
z = np.sum(np.random.choice([win, lose], size=size, replace=True, p=None))
return z
def outcome(team1_start, count = count, team0_start=team0_start):
l= []
for _ in range(count):
team0_end = runs() + team0_start
team1_end = runs() + team1_start
came_from_behind = team0_end > team1_end
l.append(came_from_behind)
#print(f'l: {l}')
outcome = sum(i > 0 for i in l)
return(outcome)
for i in range(size):
out_list.append(outcome(team1_start=i)/count)
print(f'outlist: {out_list}')
Victor Niederhoffer writes:
up your alley i think. we have done something similar for market with real empirical results. the unconditional prob is much less than20%
Stephen Stigler writes:
I am sure you know but I repeat anyway:
1) the simple calculations ignore correlation between teams.
2) they also ignore information on the distribution of changes
3) Calculations using the distribution of changes are not hard.
4) But the information about the probability of extreme events is not well determined so they can be inaccurate
5) In any case markets unlike sports are not zero sum games.
Nov
25
Neither One Nor Three But Two, from Kim Zussman
November 25, 2017 | Leave a Comment
Black was right: Price is within a factor 2 of Value:
J. P. Bouchaud, S. Ciliberti, Y. Lempérière, A. Majewski, P. Seager & K. Sin Ronia Capital Fund Management, 23 rue de l'Université, 75007 Paris, France
We provide further evidence that markets trend on the medium term (months) and mean-revert on the long term (several years). Our results bolster Black's intuition that prices tend to be off roughly by a factor of 2, and take years to equilibrate. The story behind these results fits well with the existence of two types of behaviour in financial markets: "chartists", who act as trend followers, and "fundamentalists", who set in when the price is clearly out of line. Mean-reversion is a self-correcting mechanism, tempering (albeit only weakly) the exuberance of financial markets.
See also: "the holy hand grenade"
Doc Castaldo writes:
"Black was right: Price is within a factor 2 of Value"
This goes back to a famous difference of opinion between Robert C. Merton and Fischer Black.
In trying to explain Efficient Markets to a student audience, Merton said that to him an Efficient market was one where prices are within 5% of true value 95% of the time. This was his subjective estimate of how efficient he thought the stock market was, and a way of communicating the idea of high but not perfect efficiency to the audience.
Fischer Black had a looser concept and said that to him, efficiency only meant that prices are within a factor of 2 of true value at least half the time. The rest was what he called "noise", i.e. random divergences from true value.
The problem of course is that these are only analogies and no one knows what the "true value" is and therefore how far away from it the market is.
Sep
14
Jamie Dimon and Bitcoin, from Stef Estebiza
September 14, 2017 | 1 Comment
 DIMON: BITCOIN IS A FRAUD
DIMON: BITCOIN IS WORSE THAN TULIP BULBS
DIMON: BITCOIN WILL EVENTUALLY BLOW UP
DIMON: BITCOIN WON'T END WELL
DIMON: WOULD FIRE ANY TRADER TRADING BITCOIN FOR BEING STUPID
Andy Aiken writes:
And in response, bitcoin says that Dimon is a fraud…
Alex Castaldo writes:
Not very courageous either:
JPM's Jamie Dimon on #Bitcoin: "Don't ask me to short it, it could be at $20,000 before this happens but it will eventually blow up."
anonymous writes:
Mine, it's better ![]()
Aug
16
Turkeys on the Tennis Court, from Alex Castaldo
August 16, 2017 | Leave a Comment
Are these turkeys here to challenge Victor to a tennis game?

Mar
15
Why, from Victor Niederhoffer
March 15, 2017 | Leave a Comment
 Why does Scholes say that option pricing is like crowd sourcing as opposed to the market itself? Also are option prices calling for a decline or rise? And are option prices generally right? If it were worth studying what Dr. Scholes wrote in detail, I would have many more questions but since he was well known I think as the weakest link in our program, I will not delve into it, possibly at my cost.
Alex Castaldo writes:
The article in question is
"Return to 'Old Normal' Hasn't Begun Yet: Scholes and Alankar After Trump's election, option prices signaled greater inflation risk. That no longer seems to be true." By Myron Scholes and Ash Alankar
I don't quite grasp what option markets are telling us, and how it relates to real and nominal rates.
Jan
2
Reduce Risk by Selling Vega? from Henrik Andersson
January 2, 2017 | Leave a Comment
Today I attended a lunch presentation with pension funds as the target audience. They defined risk as volatility and wanted reduce risk while maintaining much of the return. It was said that buying puts reduced return too much for most fund managers. The strategy presented was to reduce equity exposure from 100% to 50% and invest 50% in a low risk asset (short term bonds), at the same time sell both OTM calls and puts. They presented a back test of 10 years where the strategy outperformed index slightly while having a lower volatility (they outperformed during the 2008 crash and vol looked to be lower all along). I'd think they expose themselves tail risk by selling OTM puts, so was surprised they outperformed during the GFC and that they came out ahead. I still think they make it 'look' good during 'normal' markets but will get killed performance wise during sufficiently high upside and downside volatility–so I really think it is somewhat of an intellectual fraud to call this a 'low risk equity exposure' for pension funds.
Alex Castaldo responds:
I did not attend the presentation mentioned, but I am familiar with this kind of option selling strategy. One of the simplest is the PUTW (or PUTSM) strategy whose results are updated daily on the CBOE web site.
In the attached chart I compare it's total return since 1/2007 to the SPY total return (the S&P 500). Starting both strategies at an arbitrary level of 923, we see that PUTW falls to 690 in early 2009 (a 25% drop), while SPY falls much further to 503 (a 45% drop). What I find particularly interesting is how well PUTW holds up in the first half of 2008: while the stock market is going down PUTW manages to be steady or slightly up because it is selling puts at a high implied vol; only when the stock market begins to sell off very sharply after 9/30/2008 does PUTW also drop.
But even more interesting is what happens in March 2009 and after: the SPY begins to climb faster than the PUTW, slightly faster at first but markedly so after September 2012 and soon thereafter SPY passes PUTW. At the end of December 2016 SPY is at 1798 while PUTW is at 1668.
My conclusions are:
(1) The PUTW strategy has a lower volatility than SPY, both in terms of a lower drawdown in 2008 and a generally smoother path throughout the period (std dev of 11.5% per year versus 15.2% for SPY). The claims made during the presentation are believable. There is no intellectual fraud here.
(2) Everything has drawbacks as well as benefits. The drawback of PUTW is not that it will lose heavily in the future during periods of enormous volatility, but the opposite: that it will underperform during prolonged bullish periods for the market and probably over any sufficiently long period (long enough for the implied vol to adjust to whatever the situation might be and for the law of large numbers to take effect). So there is nothing magical here, as Dr. Zussman would say just the familiar tradeoff between volatility and return.
(3) The correlation between SPY and PUTW monthly returns is 0.85 (beta is 0.65) so PUTW is not all that different from SPY in terms of sources of risk (it is not a very good diversifier for stock market risk).
(4) The performance of PUTW is not theoretical or proprietary or reserved only for pension funds; it is explained on the CBOE web site (roughly speaking: sell 1 month ATM puts fully collateralized with cash) and since February 2016 there has been an ETF (also called PUTW) that implements it. So far it is small (30 million in assets). It has a 0.38% expense ratio, and so far has been tracking the CBOE version with accuracy that is quite respectable, and in line with expectations.
(5) Yes, you can reduce risk by selling Vega. Or increase risk by selling Vega, it is all in the proportions and how you do it.
Nov
14
The Future of International Trade and Investment, from Alex Castaldo
November 14, 2016 | Leave a Comment
 Up to now the trade balance of the United States has been determined as a residual item, in other words it is not a target that policy makers and citizens look at but is the result of other variables like GNP growth, inflation, productivity, the value of the dollar, opportunities, preferences, etc. in the US and abroad.
If the Trump administration decides to target a reduction in the trade deficit (as seemed implicit in the campaign) that is a MAJOR change in how the economy operates and I wonder what consequences it would have. Is it even possible? Of course it is possible and many countries (such as Japan in the 60-70s, germany, china) have operated with such policies), but it is a big change in thinking for the US. My economics professors decades ago derided such policies with the epithet 'mercantilist' and refused to even discuss them ("it's not Pareto optimal, so forget it"). But at least some countries (esp. developing countries) have had some success with it as long as the ROW did not follow their example. We now understand such policies have some *benefits* as well as costs.
What form would the trade policy of the Trump administration take?
The most attractive would be an export promotion strategy, like the Asian Tiger countries. I have a friend who believes that the US should set up Special Economic Zones like the Shenzhen area in China, where special rules are applied to favor the establishment of new enterprises that are oriented to export. Low taxes, light regulation, waiver of union rules and so on would be targeted to a small geographic area (near an international transportation hub) with a view to boosting its productivity and export ability. It is a very Asian top-down approach and have some doubts whether this could be done in the context of Western decentralized, democratic and rule of law traditions. But there is an even bigger problem: where would the exports go to, when there are no longer any large developed countries available as export destinations.
The other strategy would be an import compression or 'onshoring production' strategy. This can be accomplished via Tariffs such as Trump has proposed but would have the side effect of raising the cost of products to US consumers. In addition because one country's imports are another country's exports it would result in a decrease in international trade. Since the mid-2000s international trade has been stagnant (after a period of high growth) so it would not be surprising that after Trump, Brexit, etc, it would turn down. What would be the investment implications of a fall in international trade and investment? Historical periods of decreased international trade are not exactly bullish for the economy.
As you can see, although I do believe the Trump administration will be the greatest and best, I have trouble seeing how the policies can be applied without causing major changes and some kind of negative disruptions in the world economy. I would like to hear from you any ideas how we can analyze the situation in a clear and practical way. What asset prices will be affected and how.
Anonymous replies:
My sense is that the Trump trade policy would work through tax incentives (like the tax incentives now offered by states to businesses who locate or stay there) rather than through tariffs.
West coast dude suggests:
Future increases in prices of consumer products as a result of switching to domestic production are already being reflected in the price of bonds, which are falling in response to higher expected inflation.
Aug
17
Palindrome Doubles His Bet, from Kurt Kurts
August 17, 2016 | Leave a Comment
 Based on the timing indicated, he must be significantly underwater at this time. That assumes he has not thrown in the towel by now: "Soros Doubles His Bet Against S&P 500 Index"
John Bollinger writes:
The interesting question for me is: Why is he advertising this now?
Peter Tep writes:
Good point, John.
Sounds like he is releasing the hounds, so to speak.
Did the same for his short Aussie dollar trade some years back and also his long gold position–get long, get loud.
Jeff Watson writes:
The more important thing is, who cares what the Palindrome says he does. Whenever anyone who's purportedly a big player discloses his supposed position, I look at his motives with a big grain of salt.. People bluff in the markets as much as they bluff at final table of the WSOP. It's all a mind game, and while one should take in what the opponent says, keep in mind that their disclosure is not for your benefit and it could be a bluff. A good lesson is to look at announcements like this and try to find tells….they exist. Nobody ever discloses their position(real or fake) to the media to be altruistic and benevolent. The sad thing is that many people(retail investors, CNBC watchers etc) believe in the good will of the Palindrome and the Oracle to the small investor. Those same unknowing investors are the pilchards that are eaten by the sharks.
anonymous writes:
"keep in mind that their disclosure is not for your benefit"
That is a key. Even if it is true it is still not for our benefit. For example "they" cover while "we are riding a growing loss waiting for the idea to play out. Our entry was their exit. The flexions/greats/insiders see angles we can't, if we listen regularly our account balances will be eaten.
Petr Pinkasov writes:
I struggle to see how in 2016 it's even intellectually sound to present Q as another 'dagger on the steering wheel'. It's hard to quantify the intellectual capital that investors are willing to pay 50x earnings.
Alex Castaldo writes:
Exactly. What is the Q ratio for AAPL, how many factories do they own and how much are those factories worth in the marketplace? (Rhetorical question). The Q Ratio is a statistic from another era, when John D. Rockefeller built oil refineries bigger than anybody else's or when Mr. Ford bragged about his new River Rouge plant. It has limited value in many businesses today.
Another smaller point: the proposed tail hedging strategy is designed to break even if the S&P declines by 20% in a calendar month. In the last 30+ years (367 months) this has happened on only one occasion (October 1987). It is quite a rare event. Would you do this tail hedging all the time? I am not convinced that the numbers work when you consider that every month you are paying for put options.
 Alston Mabry writes:
Doing some searching, I ran across this on FRED:
Nonfinancial Corporate Business; Corporate Equities; Liability, Level/Gross Domestic Product
Cheap-seat question: I know what GDP is, but I'm not sure about "Nonfinancial Corporate Business; Corporate Equities; Liability". Is that simply adding up the liabilities side of the ledger for public companies? Actually, it peaks Q1 2000, so it must involve market capitalization.
But it does peak Q1 2000 and Q3 2007. Of course, ex ante how do you know it has "peaked"?
Ralph Vince writes:
All measures from an era when there was an ALTERNATIVE to assuming risk — that alternative now is to assume a certain loss, or, at best, a large rate markets exposure for the (slightly) positive rates at the longer durations.
This is an ocean of money that is coming through the breaking dam. It likely will go much farther and for much longer than anyone ever dreamed. Imagine the unwinding of the government-required-soviet-style Ponzi schemes like Social Security, which, at some point must start affording for self-direction to provide an orderly unwinding. Not only from the natural bookends of life expectancy, and pushing out the book ends to where too few could expect to ever collect from it, but the pressure from below in a runaway market for self-direction. This too will fuel the hell out of this run and make it last much longer than anyone dreams of.
Every equity that yields a dime has greater value than the certain loss; every wigwam that provides shelter too, from investing in the ingredients of pizza in Pulaski to Poontang in Pyongyang, all the wealth of the world must come out of the shadows and find a risk — and this creates a self-perpetuating feedback that is something we've never seen.
This is the move that comes along once in a century at best, and we're already starting into it. The measures of the world of positive rates (which may not be seen for a long time) I do not believe are germane to the world today.
Jan
14
Our Calendar Color Coding Scheme, from Alex Castaldo
January 14, 2016 | 5 Comments
Can you please outline the color coding rationale for the daily performance chart. I am confused on why some down days are red and the others are yellow..etc - A Reader
We track daily movements in U.S. stocks and bonds (specifically S&P Index futures and Long Bond futures).
The colors are based on the performance of both markets:
Red days: both stocks and bonds down.
Green days: both stocks and bonds up.
Yellow: stocks up, bonds down.
Blue (technically azure): stocks down, bonds up.
The bond futures movements are expressed in points and thirty-seconds of a point. For example 1.25 actually means 1' 25" i.e. 1+25/32. The S&P futures changes are in points.The abbreviation USB stands for US Bonds (the actual futures symbol is US on Bloomberg, ZB on some other systems).
(Original post dated June 25, 2011. Edited January 14, 2016)
Aug
10
Percentage or Log Returns, from Stefan Martinek
August 10, 2015 | Leave a Comment
There are arguments for and against the log returns in data analysis. Any preferences and why?
Alex Castaldo writes:
The nice thing about log returns is they are additive across time. The log return for the year is the sum of the log returns for Jan, Feb, Mar… Also the log return is to a first approximation normally distributed.
The nice thing about the percentage return is that the % portfolio return is a weighted average of the individual stock percentage returns, weighted by portfolio weights. So for example if you have 1/2 your money in MSFT and 1/2 in GOOG, the portfolio percent return will be the average of the percent returns on these two stocks.
So when I work with portfolios I always prefer the percentage returns. When I work with indexes I work either with percents or with logs (especially when concerned with options, since option theory is all in terms of log returns).
Jul
5
Greece, from David Lillienfeld
July 5, 2015 | Leave a Comment
 I was looking at Greece's unemployment rates historically last night and found something interesting. The Greek economy seemed to hit a pothole in 1981 from which it never extricated itself. Between 1980 and 1982, unemployment tripled, and has stayed that way as a base since then. (I say 1981 because the rate didn't return to where it was, it increased.) Now, there were recessions in the US in 1980 and 1982, and Greece is a tourism-based economy. So a short-term increase in the rate can be explained in that way. However, that doesn't explain that the rate didn't go down in the 1980s. Why? Any suggestions as to the reason? It seems to me that that reason may provide more insights to the current situation than simply that the Greeks lived beyond their means. Something changed in their means.
Alex Castaldo writes:
According to Greek analyst Nick Tsafos, one reason for the low growth rate that started in 1981 was monetary mismanagement.
From 1953 to 1973 the 'third drachma' like most currencies was tied to the dollar; the exchange rate was 30 GRD per USD. This was the period that Greece experienced its best economic performance.
After the mid 70's the currency floated. It was (in round numbers) 58 in June 1981, 148 at the end of 1985, 157 at the end of 1989, 240 at the end of 1994, 328 at the end of 1999 and 325 in 2002. (In 2002 the Euro was introduced).
In other words from 1981 to 2001 the GRD was a 'soft currency' that allowed the Greek government to finance itself easily at the cost of higher inflation and currency depreciation. It could create government jobs, pay generous retirement benefits and get away with it by issuing more drachma. And the Greek politicians were masters at this kind of thing, buying support with monetarily financed expenditures.
The inflation ended in 2002 with the introduction of an externally managed currency, the Euro. For a time everything seemed wonderful. But old habits die hard and the politicians kept up their old ways of solving problems. Government debt increased but interest rates were very low, so it did not seem to matter. But the debt this time was hard debt, that inflation and devaluation would not erase…
Now for a rhetorical question: if Greece abandons the Euro and introduces the new drachma, how do you think the new currency will be managed? The past history is not encouraging.
Jun
19
Plaque at NYBG, from Alex Castaldo
June 19, 2015 | Leave a Comment
See picture enclosed.

.
.
.
.
.
.
.
.
.
.
.
.
.
.
.
.
.
.
.
.
.
Mar
4
Humor From Yellen, from Alex Castaldo
March 4, 2015 | 1 Comment
 Humor from Yellen:
"The economic and financial news has been grim," she told colleagues at a mid-March2009 policy meeting, according to the transcripts. "Things are now so bad that I actually open the Greenbook with greater trepidation than my 401(k)." The Fed's so-called Greenbook is its official summary of economic and financial conditions.
Jan
15
The Manipulator’s Dilemma, from Alex Castaldo
January 15, 2015 | Leave a Comment
The Fundamental Dilemma of all market manipulation, whether legal (as in this case) or illegal: when you stop pushing up the value of an asset, it falls back, giving you mark to market losses on your inventory. Today the SNB is taking tremendous losses on the Euro assets it has accumulated in its Euro buying binge. I would not want to be a private shareholder of the SNB (or a swiss taxpayer) on a day like this.
Jan
7
How I met Ed, from Alex Castaldo
January 7, 2015 | Leave a Comment
I first met Ed sometime in 1997 or 1998. I was in graduate school and trying to earn a few bucks by working as a data cleaner and spreadsheet builder at a hedge fund not far from the university. I and the rest of the staff worked in cubicles in the middle of a big trading room, while the important people had glass enclosed offices around the perimeter. One of these people, a well dressed, tall and large gentleman soon introduced himself as Ed Dunne. In the following few days he would often stop by and chat about what was going on in markets all over the world. Most often I could see him in the office of the head of the firm, the billionaire Mr. Why, talking and gesturing while Mr. Why nodded politely from time to time. I never talked to Mr. Why, but I felt I had a indirect link to him via my conversations with Ed. And he knew or spoke with so many other important people in the investment world.
Ed was to me was the quintessential expert on international financial markets. He would explain how hedge funds and re-insurance companies work together, how oil can be stored in idle ships for later delivery, what factors affect the prices of grains, and a hundred other things. All things that I was very curious to learn about. To become as savvy and as wealthy as Ed seemed within easy reach if I could have a few more discussions with him. One time he invited me to attend one of his meetings at Princeton University with several economics and statistics professors (though I did not see Ben Bernanke there), and afterwards to a sumptuous lunch in a nearby restaurant. That was just one example of his generosity.
Later on Ed claimed that he introduced me to Victor and got me the dream job that I now have. I think it was more complicated than that and that there were several people involved but I don't remember the details. But certainly Ed played a role and I am grateful to him for that.
Dec
23
Here’s a Pretty Kettle of Fish, from Victor Niederhoffer
December 23, 2014 | 1 Comment
Here's a pretty kettle of fish. Suppose you have two forecasts that are disparate. One is bullish and the other is bearish. For example it's up 100 over 4 days. That's bearish. But it's up 4 days in a row, that's bullish. How to combine? There's a bayesian approach, a regression approach, and an inverse variance weighted approach, and a practical approach that Zarnowitz found. Just add up the number of bullish and bearish and that's your forecast. But what's your best way of solving same? The answer might provide a meal for a lifetime. I asked Stigler this question 15 years ago, and he thought it was a very good question, and I've not seen a good answer yet.
Alex Castaldo writes:
I would start with Diebold and Pauly: The use of prior information in forecast combination.
Gary Rogan writes:
There has got to be some way of incorporating the rare nature of one of the set of circumstances. Clearly 100 points is more unique than 4 days. Does this carry any special weight? Also there is a very large number of other possible "circumstances", like time of day, month, year, what the future portends if prior history was similar during this time of day, month, year. where are we in the economic cycle? With respect to various moving averages? What's the money supply and it's history? What has the price of oil and any number of other thing doing and where is it? And what matters more: all these other things or the one unique thing?
anonymous writes:
You're mixing apples and oranges. The premise for regression and related approaches is that there is a fixed law that can be discerned, or at least modeled, in such a way that it does not vary in any dimension. Whatever the model/rule was 50 years ago is still what it is today—unless of course, additional information either disproves the model or allows for its refinement. Either way, it's time invariant. Bayesian analyses are different by definition. Unless the prior is the same, the result will be different. Since priors will change with the passage of time, the analysis is time-dependent. You might try to specify the Bayesian model as fixed at any one point in time and try some form of combination, but since the moment you do that, the prior will shift and the exercise becomes worthless.
Apr
22
Trading Performance Criteria, from Leo Jia
April 22, 2014 | 2 Comments
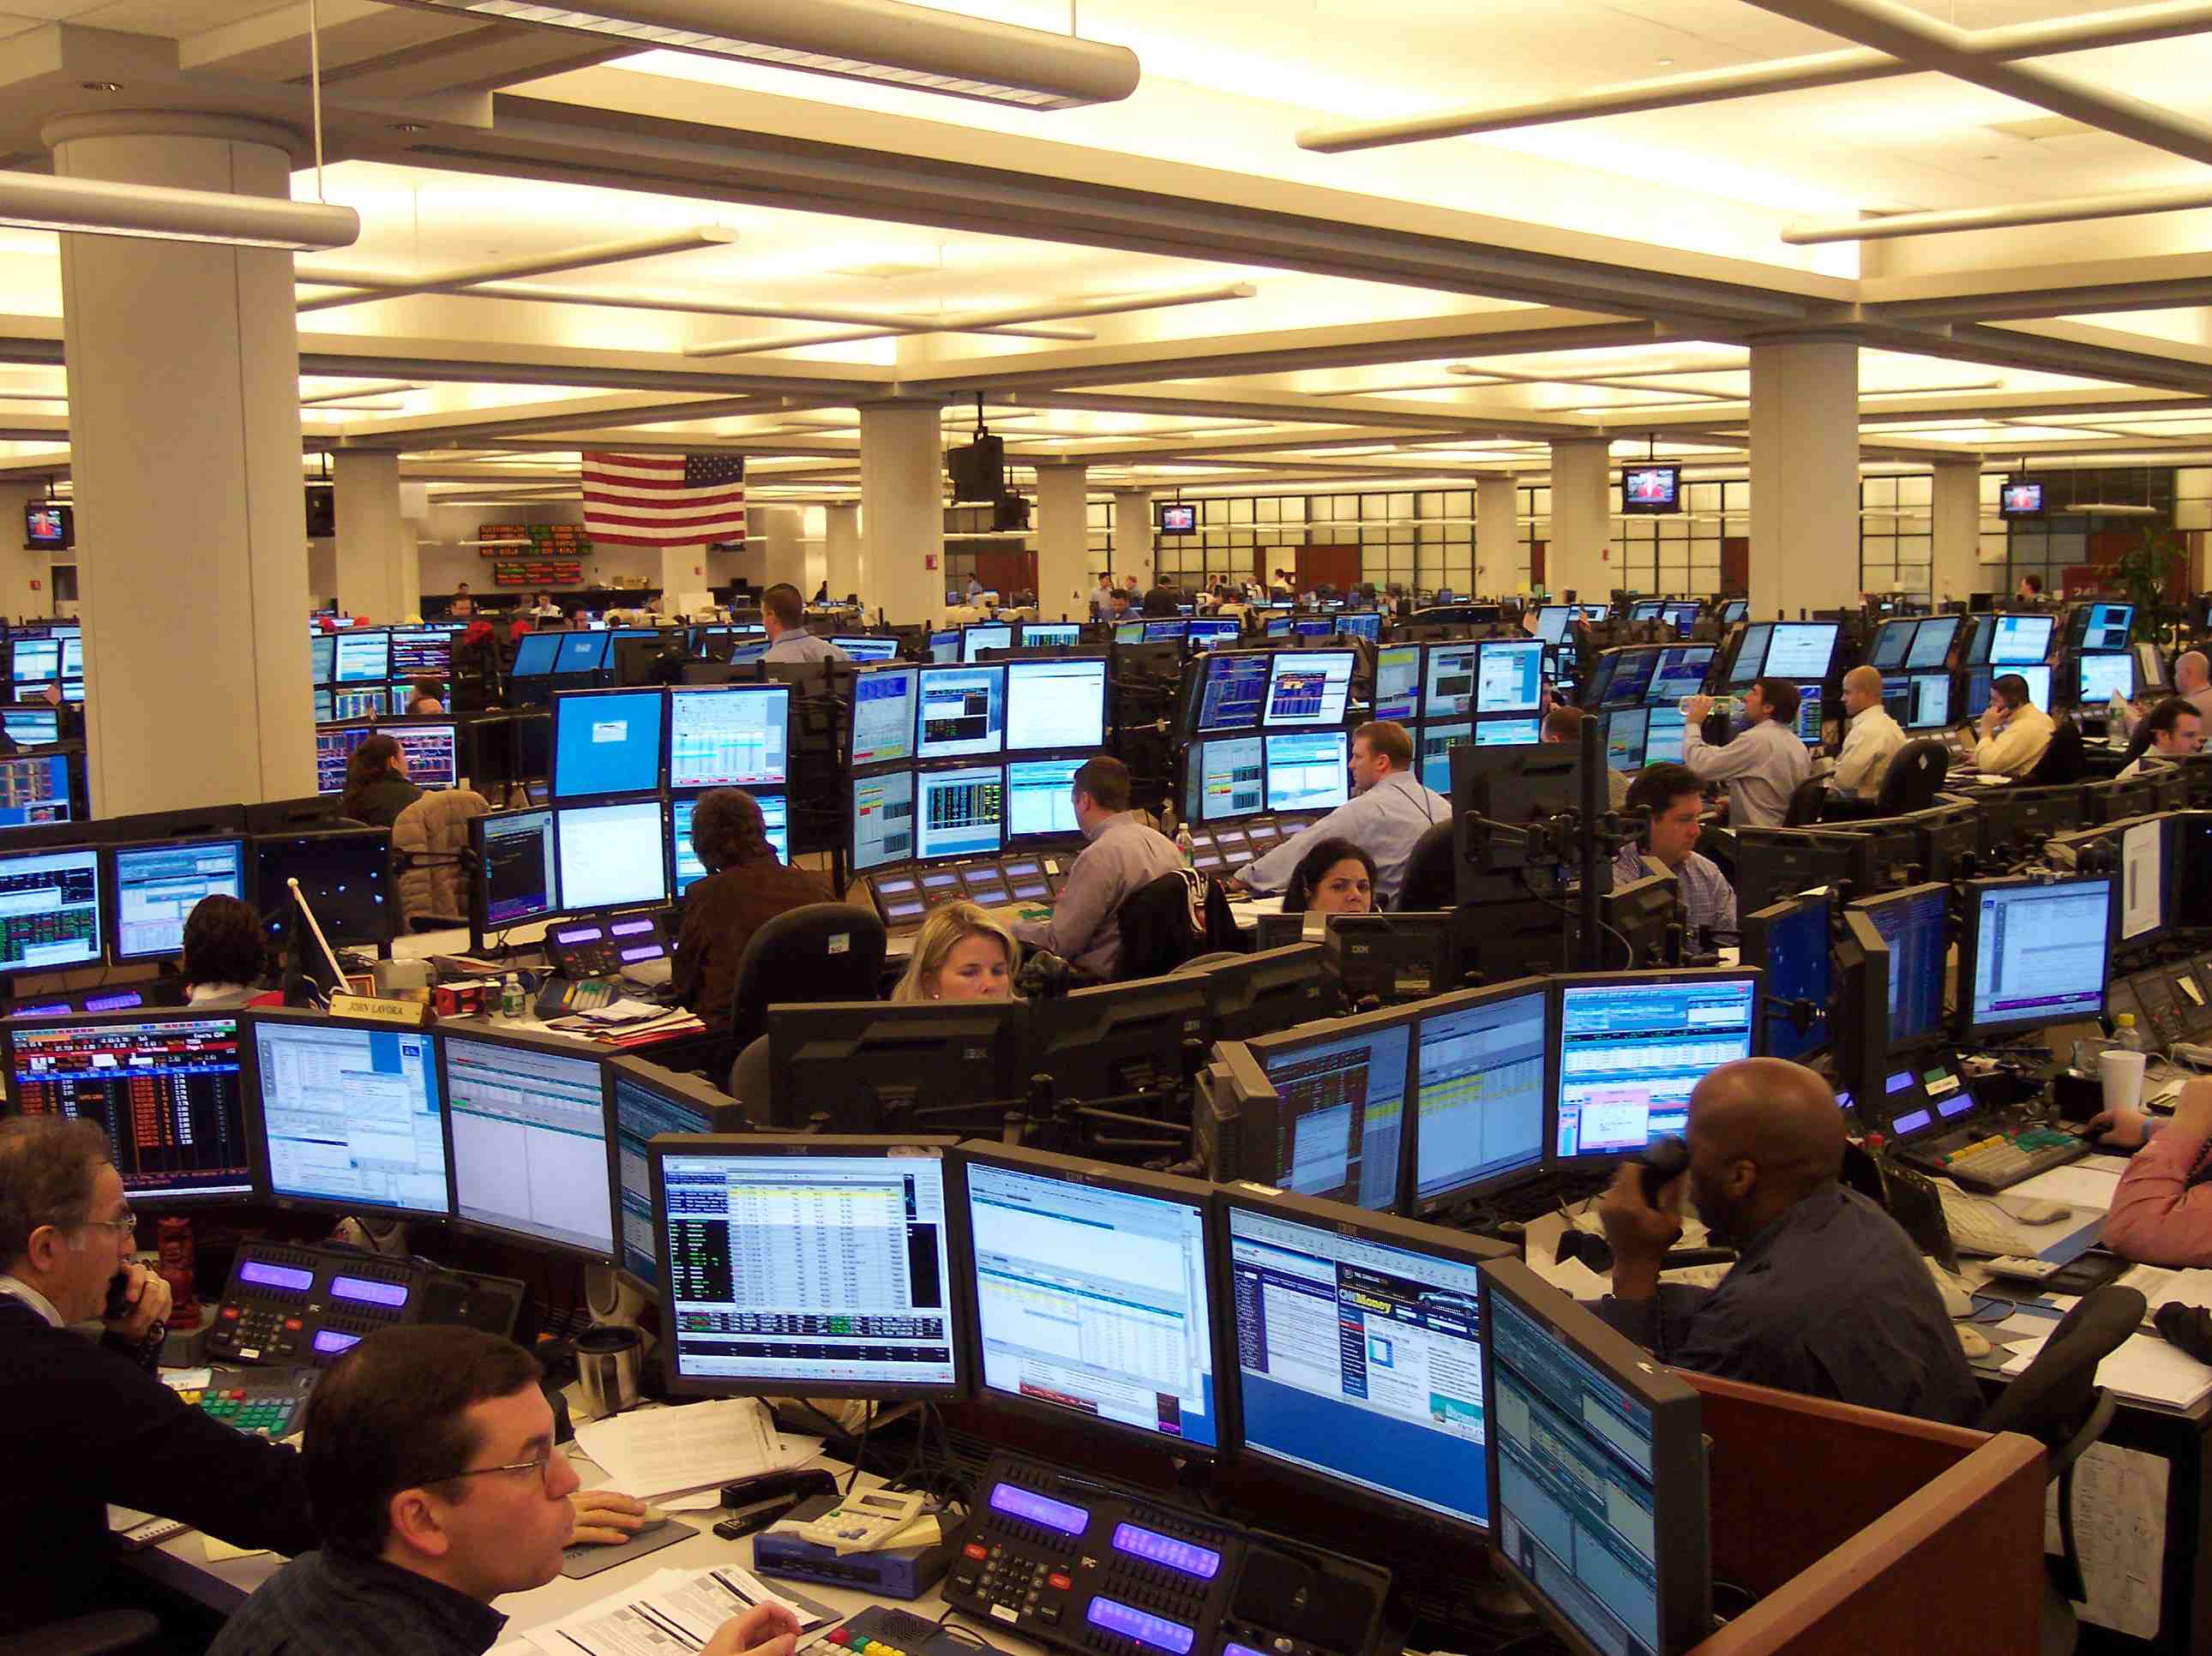 I have been thinking about what could be a good set of criteria to measure trading (strategy) performance for individual traders.
The criterion of average return divided by the variance of the returns seems to have its shortcomings. One reason is that some large positive returns can cause the variance to go up resulting in an indication by the criterion that the performance deteriorates. But some large positive returns are good to have.
Other criteria like Sharpe ratio seem more suitable for institutions.
I think using properties of the linear regression line of the cumulative return curve might be a better choice.
Two useful properties are the slope and the "width" of the linear regression line. By "width" I mean the deviation of the cumulative return curve around the linear regression line.
A good performance should have high slope on the one hand. And if we do not consider reinvesting profits, it should have narrow "width" around the linear line.
So then the value of slope/width seems meaningful.
If we take the linear regression line as a risk free benchmark, then this value may be very similar to the definition of Sharpe ratio, but practical for individuals.
Would anyone please comment on the pros and cons of this, or any other better ways to measure performance.
Alexander Good writes:
Great post!
I think it makes sense to measure linearity of PNL and convexity separately so I agree with you that R sq is a good one to employ. I am curious how width differs from the strategy's std though…
One thing that you can do as a cheap proxy is median return * sqrt(252)/std return and then for skew then have a (rolling max peak to trough draw down)/(rolling max peak to trough draw up).
You can benchmark your strategy vs. bonds, the S&P and a traditional 60-40 mix or your other strategies. It's very hard to beat a vol weighted portfolio of stocks and bonds so it's a good benchmark in my humble opinion assuming you're trading your PA and you don't have large retirement holdings. I assign different weights to skew and median return depending on my portfolio construction.
In portfolio construction you'll often find things with strongly positive skew have good inverse correlation to market PNL series and are typically 'long vol' (idea ripped off AQR's value and momentum everywhere).
Trending strategies frequently have very positive skew (momentum) whereas mean reversion tend to have skew that looks like the S&P (value). So if I'm net long beta my marginal utility of doing trending models is higher whereas if I'm net short I tend to size up mean reversion strategies.
Would be curious to know what other people are using/ how other people think about this/ if they have good papers on the subject.
Leo Jia writes:
Aren't they different?
std of returns has this term: (Ri - mu)^2, where mu is the same for all i's.
The width has this term instead: (CRi - Vi)^2 where Vi is the value on the linear regression line at time i and is all different across all i's.
Alex Castaldo writes:
Personally I just like to look at the equity curve visually, and it is not difficult to store large numbers of graphic files in a folder and quickly "flip" through them by hitting a key on the computer.
But for automated evaluation Leo's two criteria (slope of regression, and "width around the regression" (which is also called the SEE or standard error of estimate.in regression textbooks) make sense to me.
However I know there are many other criteria that have been proposed. There is one with a foreign name that I think starts with "v" but that I can't remember. I am sure some people here know what I am talking about, it was much blogged about 2 or 3 years ago.
In looking for it I accidentally googled another measure of equity quality, the k-ratio , that believe it or not has 3 different versions.
Any other ways to measure equity curve "quality"?
anonymous writes:
As with many things involving non linear information, my experience suggests that one must mix, blend or combine different 'quantities' to form a unique and proprietary time series.
For example, some form of 3D 'curve' that combined the three quantities return, AUM & volatility that gets thicker as AUM in the strategy grows and changes colour as volatility of returns increases perhaps…
Ralph Vince writes:
percent of 6 month periods underwater
percent of 1 year periods underwater
percent of 2 year periods underwater
percent of time at equity highs
percent of time within 1% of equity highs
percent of time within 5% of equity highs
percent of time within 10% of equity highs
percent of time within 20% of equity highs
I have all of these programmed up in javascript which you can peruse at lspindexes.com and click the "compare" tab.
Feb
19
How High and Low Compare to Yesterday’s High and Low, from Alex Castaldo
February 19, 2014 | Leave a Comment
I believe there are 4 cases, conventionally called:
h(t) > h(t-1) and l(t) > l(t-1) an uptrend day
h(t) < h(t-1) and l(t) > l(t-1) an inside day
h(t) > h(t-1) and l(t) < l(t-1) an outside day
h(t) < h(t-1) and l(t) < l(t-1) a downtrend day
Victor Niederhoffer writes:
Excuse me?
Alex Castaldo replies:
OK, OK, let's call then upshift day and downshift day then.
;-)
Kim Zussman adds:
What about outie and innie?
Using SPY (2000-present), checked for outside days (today's high > yesterday's high, today's low < yesterday's low). Then checked the return for the next day.
Days after outies were also checked if the market was up-trending (20DMA > 100DMA), and, in addition to up-trending, if the intra-day return was up (C>O). Here are the c-c returns after (vs zero), for all days (c-c ret), all days after outside days outie+1), days after outside days and up-trending (and 20>100), days after outside days and up-trending, and the outside day was up intra-day (and C>O):
One-Sample T: c-c ret, outie+1, and 20>100, and C>O
Test of mu = 0 vs not = 0
Variable N Mean StDev SE Mean 95% CI T
c-c ret 3550 0.00022 0.0131 0.0002 (-0.0002, 0.0006) 1.01
outie+1 353 0.00049 0.0118 0.0006 (-0.0007, 0.0017) 0.77
and 20>100 234 0.00061 0.0090 0.0005 (-0.0005, 0.0017) 1.03
and C>O 89 -0.00047 0.0090 0.0009 (-0.0023, 0.0014) -0.49
Zeroish, with none significant, and days after outside days and up-trending winning the race at 0.06% per day avg.
Feb
14
MagicFormula Investing, from Alex Castaldo
February 14, 2014 | 1 Comment
 There was a lot of interest a few years ago in Joel Greenblatt's book The Little Book That Beats the Market . He set up a web site www.magicformulainvesting.com which selects stocks based on this method (using a combination of 2 criteria: earnings yield and return on capital).
Two years ago I saved a list of 30 stocks it recommended and just recently I calculated the performance up to now. The results are below:
MagicFormula Investing Stock total return from 2012/01/29 to 2014/01/29
Source: Bloomberg
%Ret
atvi 43.04
apol -40.51
amat 44.77
hrb 87.55
cub 9.80
dell -14.40 acquired 10/30/2013
dlx 102.63
dlb 27.57
xls 110.55
expe 111.76
gtat 10.06
gme 54.34
esi -44.16
icon 95.89
idcc -18.98
klac 24.79
lps 129.00 acquired 1/3/2014
lo 51.17
mant -10.67
mrx 37.67 acquired 12/11/2012
msft 32.90
nsu -38.53
noc 103.22
prx 37.99 acquired 10/01/2012
rtn 94.84
ldos 48.21 ticker change from sai to ldos
sndk 48.91
save 183.80
stra -65.67
vphm 67.37
average 44.16
spy 40.30
rsp 44.02
As you can see the return over 2 years was good, at 44.16%, but indistinguishable from the equal weighted S&P at 44.02% and close to the (ordinary) S&P at 40.30%.
[Strictly speaking you are supposed to hold the portfolio for a year and then rebalance it, which I forgot to do, so it is not a completely accurate replication of the MagicFormula method.].
Bill Rafter writes:
Before Greenblatt there was Haugen who ranked stocks by 60+ variables. He published them in his book, the Inefficient Stock Market. BTW all of his books are interesting. Haugen's material looked really good, but seemed to fail to deliver outstanding returns.
Then Greenblatt's book came out and showed good results from only using two variables: ROE and ROA. One of those was a Haugen variable (I forget which). Then Haugen produced a second edition in which he bumped up the number of variables to ~70, and included both ROE and ROA.
We did a lot^2 of work with both H and G and found that neither are particularly good at picking winners, but both are very good at finding clunkers. And of course if you eliminate the clunkers, the remaining portfolio will certainly outperform the market indices. But of course that only really works if you essentially invest in ALL of the non-clunkers. Thus they are good strategies for large mutual funds.
FWIW we found that you can cull out most of Haugen's variables (but include ROA and ROE) and do fairly well with 16 variables. But again, they are best used as ranking tools to eliminate the underperformers. Our opinion is that both H and G methods are the financial markets equivalent to comfort food. If comfort food makes you feel better, then use it.
anonymous writes:
I agree that Haugen (1942-2013) was an interesting character who did some innovative work. I have read many of his books/papers; how well it holds up remains to be seen. He used the kitchen sink approach which Rocky so detests, but he found things (such as the low vol phenomenon) that were new and interesting (now low vol has maybe become too popular). BTW the two year test period I used is far too short, it could be argued. You need more like 10 years.
Gordon Haave writes:
"Our opinion is that both H and G methods are the financial markets equivalent to comfort food."
This by the way is very important for non-professionals. Most not-professionals lose money because of over-trading, moving in and out on a whim, chasing winners, etc. (actually, most professionals do as well).
A system like Greenblatt's that tells a good story, tells you to only re-balance one per year, and does "as good" as the market will tend to outperform what the individual otherwise would have done.
Richard Owen writes:
Bill, when you say clunkers, do you mean it was great at selecting clunkers by the lowest ranking? Or it was great at selecting clunkers by false positives - i.e, many of the best stocks were very bad despite their attractive ROE etc. and this is what hurt performance? And so they are good for 'cleanup'? Perhaps it's a bit unfair to pick '12-14 data, but very interesting nonetheless. I suspect the best outperformance of such strategies would come in the early bull market and then converge with the market as it matures, then lagging at the end / collapse of the bull?
Bill Rafter writes:
Richard,
Sorry, I did not mean to be cryptic. By clunkers I meant stocks that you should not own, because they are and will be poor performers.
We used both Greenblatt and Haugen variables to rank the Russell 3000 for 20 years and put the stocks into 10 bins (i.e. deciles) and observed the performance of those bins over the following 6 months (with no overlapping periods). Considering the deceased stocks the total number of securities exceeded 8,000. You have to include the dead stocks or you will have survivor bias. The lowest ranked bin performed really bad, such that they could have been shorted profitably (we are long-only and had no interest). Importantly the performance of each higher decile was monotone increasing. That last bit means the strategy has merit. However, the top three deciles did not have the performance that would encourage us to pursue the strategy. That is, they outperformed the market, but they were not an improvement over other strategies.
It makes perfect sense to find those clunkers and eliminate them from your subsequent ranking routines. But there are many ways to find them. It turns out that the underperforming stocks have the mark of the beast written all over them, and you don't need to look at 10+ variables. If data mining for fundamentals is too onerous for the researcher, ranking by volatility will find clunkers. Deselecting for volatility will also keep you out of some high-flyers, but that's a good price to pay. High short interest coupled with declining prices is another.
We did the research 2-3 years ago and I apologize that I don't have the time to dig it out and clean it up for public consumption, as it was only done for our shop. Realize that we are statistical traders who typically hold either ~20 or ~50 positions because we cannot forecast individual security performance, but only bin performance.
Jan
31
The Business of Movies, from Alex Castaldo
January 31, 2014 | Leave a Comment
Every business has its peculiarities. In the article
"The Tell All Diary of a Sundance Producer" by Galt Niederhoffer we get a window into the world of independent film production from this week's New York magazine.
Jul
21
Dimson, Marsh and Staunton Update, from Alex Castaldo
July 21, 2013 | Leave a Comment
I am only now taking a look at "credit suisse global investment returns sourcebook 2013" which was published in February 2013.
Chart 2
Cumulative returns on US asset classes in nominal terms 1900-2012
Equities 1 to 25507 (9.4% per year)
Bonds 1 to 253 (5.0% per year)
Bills 1 to 74 (3.9% per year)
Inflation 1 to 27 (3.0% per year)
Chart 3
Cumulative returns on US asset classes in real terms 1900-2012
Equities 1 to 952 (6.3% per year)
Bonds 1 to 9.4 (2.0% per year)
Bills 1 to 2.7 (0.9% per year)
Table 1 shows real equity returns for various countries 1900-2012:
USA 6.3% per year (see above)
UK 5.2% per year
World 5.0% per year
The authors are exceedingly cautious about the future, making various downward adjustments to these figures for prediction purposes.
N.B. The Sourcebook is not easily found online, an abbreviated free version called the Yearbook is available here: Credit Suisse Yearbook 2013 [69 page PDF] . The range of data is less and it is not organized in the same manner, however.
Jun
7
A Rainbow Has Appeared, from Alex Castaldo
June 7, 2013 | 1 Comment
In the last 4 days we have seen every colour on our calendar (see above).
Tueday June 4 Red - Stocks and Bonds down
June 5 Blue - Stocks down and Bonds up
June 6 Green day - Both Stocks and Bonds up
June 7 (today) Yellow - Stocks up and Bonds down
Interesting, but what does it portend?
May
26
Option Pricing Under GARCH, from Alex Castaldo
May 26, 2013 | Leave a Comment
I learned today there is an apparently relatively simple and practical option pricing formula for the case when the stock follows a (slightly extended) GARCH(1,1) process.
"Fast Analytic Option Valuation with GARCH" by Thomas Mazzoni, September 2008
I thought it might interest the option theorists on this site.
May
2
I attended a presentation yesterday on "Optimal Order Placement in Limit Order Markets" given by Arseniy Kukanov.
It was an interesting presentation but was perhaps best summarized by a well dressed white haired gentleman in the audience who asked at the end: "given all the simplifications and assumptions you had to make, of what use is this 'solution' other than to enable you to get a PhD".
In choosing between limit orders and market orders you have to trade off cost savings provided by limit orders against "non-execution risk" that accompanies limit orders (risk that the limit order will not execute).
The problem is: you must buy S shares of stock within a time horizon T.
There are N markets (exchanges) available, for each market you know: the bid ask spread the bid queue lengths at time zero the maker/taker fees that each market charges.
In each market you can at time zero place a market order (which has a 100% probability immediate of execution) and/or or a limit order at the best bid price (other price choices are not included in this version of the model).
There are two parameters lo and lu which are the penalties (in dollars per share) that you charge yourself for buying fewer than S or more that S shares in the available time.
The model minimizes the sum of the trading costs plus the penalty.
The simplest solution is in the case of only one exchange (ex: the minis are only traded on the CME).
In this case there is an algebraic expression for the optimal strategy, and what to do depends on the value of lo:
If lo is below a certain value lbar1, it is optimal to enter a limit order.
If lo is above a certain value lbar2, meaning there is a high urgency to buying the stock, it is optimal to enter a market order.
For lo intermediate between these two values it is optimal to enter both a limit order and a market order at time zero that add up to the desired quantity.
Certain theorems about the solution can be derived, for example as the amount of stock S to be bought increases there is an increased reliance on market orders.
From my point of view one of the most unrealistic assumptions is that the probability distribution of future order flows and cancellations does not depend on the size of the order you enter. In my experience on the contrary if you enter a big limit order it can 'scare' the market and move it away from you.
All in all it was very good for an academic presentation.
The full paper can be found here.
Thanks to Anatoly for the invitation.
Mar
14
Watch Out for Those Splits, from Vic Niederhoffer and Alex Castaldo
March 14, 2013 | Leave a Comment
 Written in honour of all splitters, rookies and lookbackers:
A common pursuit in decision making is to compare data of many kinds and find the best way of separating the observations into different classes.
For example you mite be considering what are the factors that contribute to long life. Weight, height, mid range of parents age , % of meat consumed , exercise mite be the variables. You mite find that when parents mid range was above 140, and meat eaten less than 2 times week, and exercise more than 5 hours a day, the longevity is 10 years higher than the average.
Trees are usually used to separate the groups. An example picture of such a tree is here: [pic ] Lots of good pictures of such trees and a discussion of a typical tree sort is in An Introduction to Classification and Regression Tree (cart) by Roger Lewis. And programs like CART and AID and many modern variants are widely used in medicine and markets. In fact all market people systematically or implicitly consider such problems. When does the market go up? When gold is down more than 10, when bonds are up more than 100, and the previous 5 day sp move is between -1% and 0 %? The problem is that there are many variables to consider, and many levels at which one would reasonably split the data.
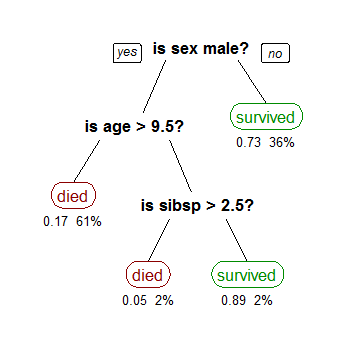
A good starting point in considering such problems is to note that when there are two mutually exclusive groups X and Y the variance of the difference between means is the sum of the variances of the means. The variance of a mean is the variance of an individual observation divided by the number of observations. For example, consider the average move in sp during a day has a sd of 10 and variance of 100. If you take two independent samples of 10 from such a distribution , the variance of one mean will be 100/10= 10 and the variance of the difference between means is 20. The standard dev of the difference is 4.4 What does this mean in practice? One will round. A 50% confidence interval in which 50% of the observation range is 0.65 x 4.4 = 3 points on either side of the difference between means which we'll assume to be 0. That means that by chance half of all the observations will show a difference in means ranging from -3 to +3. To find a region where 95% of the observations lie, ie. A 95% confidence interval we'd multiply 2 x 4.4 =8.8. In other words to find a difference that has less than a 5% chance of occurring thru randomness we would have to find a difference between means of 8.8 on any binary split.
But of course that's not all. Normally we look at 2, or 3 or 4 different splits to find the one that gives the greatest difference. It turns out that if we look at the highest of two differences, the average difference is 1.5 times as high as for one difference. In other words by randomness , the standard deviation for the highest of 2 difference between means is 1.5 x 4.4 = 6 a 50% confidence interval assuming randomness for the highest of 2 differences is 0.65 x 6 or from -4 to + 4. A 95% confidence interval would be between 2×6 and -2 x 6 i.e. between -12 and +12.
Now there were several assumptions made in this analysis. We assumed normality. And we didn't take account that there is sampling without replacement for one. And there are two cases: you look at the algebraic difference (2 tailed test, as above) or you try to maximize the *magnitude* of the difference (the 1 tailed approach). To get a good handle on it, Doc and I simulated what would happen if we divided up 20 random observations from a distribution that had a mean of 0 and a standard deviation of 10. This corresponds to the most frequent and typical thing one does when dividing up stock market changes in points (S&P rises or falls by about 10 full points a day). We then took two random subsamples of 10 each and calculated the mean of each of the two groups of 10. We then looked at the absolute value of the average difference between means when we repeated the process 1000 times. It turns out that the average absolute difference between means is 3.5 for a single split (this 3.5 absolute difference is in line with the std dev of 4.4 previously estimated)), 5 for the highest of two splits, and about 6 for the highest of 3 splits. This leads to incredibly high differences that you must be aware of when you split data to have anything more than a 50% chance that the difference occurred thru luck alone. To be 95% sure that you have something departing from luck for the highest of 3 splits you'd need a difference between the groups of 10. As the numbers in the group get less than 10 ,i.e. for a second or third split, the numbers would get increasingly large. This is a warning to all who search for regularities in data using methods that are implicitly or explicitly like tree sorts. By vic and doc.
Here is a more extensive table of simulation results
Table 1
Col A: number of observations being split
Col B: number of splits considered, best one is chosen
——-
Col C: mean absolute difference generated by best split (in S&P points)
Col D: standard deviation of absolute difference
Col E: lower 5% confidence interval
Col F: upper 95% confidence interval
20 1 | 3.56 2.66 0.27 8.65
20 2 | 4.97 2.67 1.24 9.81
20 3 | 5.84 2.64 2.07 10.55
20 4 | 6.45 2.55 2.84 11.05
48 1 | 2.26 1.72 0.18 5.63
48 2 | 3.25 1.71 0.90 6.40
48 3 | 3.75 1.66 1.36 6.78
48 4 | 4.20 1.68 1.79 7.24
Table 2 same as above but
Col C: average (algebraic) difference between means (in S&P points)
Col D: standard deviation of difference between means
20 1 | -0.06 4.61
20 2 | -0.13 5.62
20 3 | 0.01 6.42
20 4 | -0.07 6.88
Let's try to apply this to a typical example.
The 30 year bonds each day have a move of about 80 points.i.e a move from 142 exactly to 142 and 26 /31. Call that the stand dev . Let's say you have 100 observations of bonds in your sample. And you split it into two equal halves based on whether gold is up the previous day or down. The variance of any mean difference would be 6400 x2 /50 =256 . That gives a stand dev of 16.
Turn to the prob that a standard normal deviate will be between -z and + z. the prob is 50% that a normal deviate will be etween -0.65 and + 0.65, the prob is 90% that a stand norm dev will be betweeen -1.6 andd +1.6. Thus if you find a difference that's less than 0.6 x 16 = 10 its 50% chance, and its 90% chance to be 1.6 x 16
Nov
2
It’s Now Clear, from a former rackets player
November 2, 2012 | 1 Comment
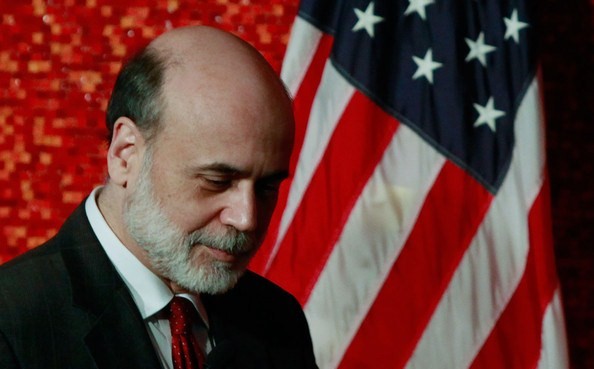 It's now clear to me that everything Rogan said recently is right. There is a force, probably without memorialization wishing to keep the world state going. That force will do everything it can to keep the market up before the election. Shortly after or in conjunction with the wish fulfillment of the incumbent win, a revulsion will occur.
Please help me with the timeline. It starts with the Roberts decision to allow medicare. Then the German decision to allow redistribution from Germany to Europe, then the GE 4 the cooling of Arab Spring protests so as not to embarrass their fellow traveler in the "circular" office, then the 7.8 % from a temporary head who lunches as agrarian party bashes with her kid.
Let us hope that the adversary does very well in cardinal events such as debates and polls in the interim so that massive European and central bank activities unlimited to support the stock market can be implemented in the remaining few weeks.
Alex Castaldo writes:
The next logical step would be a Nobel prize for Bernanke or one of his ilk.
Apr
26
Variance Futures Coming to CBOE, from Alex Castaldo
April 26, 2012 | Leave a Comment
The VIX futures never made much sense to me (among other things there is no real deliverable — it is just a bet on what a highly volatile number will be on a specific day in the future) , but maybe the Stock Index Variance Futures to be introduced by the CBOE later this year will have more applications (and certainly could make more economic sense):
Apr
23
The Mouse Traders vs. the HFT Cats, from Alex Castaldo
April 23, 2012 | 1 Comment
Some interesting stats from Easley, D., M. Lopez de Prado and M. O. Hara (2012b): Bulk Volume Classification, Working paper about E-mini trade sizes:
Most of the[..] trades are small, averaging 4.50 contracts per reported fill. Figure 1 plots the frequency of trades per trade size. […not shown…] The frequency line quickly decays as a function of the trade size, with the exception of round trade sizes (5, 10, 20, 25, 50, 100, 200, etc.).
That round trade sizes are much more common than their neighbors may be attributed to so-called ‘mouse’ or ‘GUI’ traders, i.e. human traders that send orders by clicking buttons on a GUI (Graphical User Interface). As an interesting aside, this footprint of ‘GUI traders’ could be used by machines to learn the patterns of their human competitors, and eventually anticipate them to the advantage of the ‘silicon traders’. For example, size 10 is 2.9 times more frequent than size 9. Size 50 is 10.86 times more likely than size 49. Size 100 is 16.78 times more frequent than size 99. Size 200 is 27.18 times more likely than size 199. Size 250 is 32.5 times more frequent than size 249, and size 500 is 57.06 times more frequent than size 499. Such patterns are not typical of ‘silicon traders’ who usually randomize trades to disguise their footprint in markets.
Feb
7
What is the Proper Model, from Victor Niederhoffer
February 7, 2012 | Leave a Comment
 Do markets learn from each other? For example, is the S&P market this year, following a similar path to bonds last year, with every trepidatious move down being requited with a rise? Are such "learnings" graduated to the point of regularities. And is it a domino effect or a path of least resistance or consilience or convergent evolution or what have you? What do you think? Can it be quantified? Should it be quantified?
Gary Phillips writes:
Price discovery has become as anachronistic a term as capital formation. The Fed is supposed to be listening to the market to give it guidance in it's policy decisions, not dictating to the market, what the market should do. If investors feel there are no surprises left, as the Fed is concerned, they will once again lever up, and inflate asset prices…QE1 - QE whatever. Rinse and repeat.
Bill Rafter adds:
Here’s a related (perhaps derivative) question: Do stocks learn from each other?
Let’s say you take a list of ~6,000 stocks and look at them over a 10+ year period encompassing both up and down markets. And you come up with a trading plan that buys a stock if it exhibits pattern ‘A’ and sell it if it exhibits pattern ‘B’. It is not unreasonable to then have a universe of perhaps 150,000 transactions.
On the first pattern you pick you will find positive average results for certain stocks, while other stocks on average will be negative. Some of these winning stocks will knock the cover off the ball by having say 35 of 50 trades positive, and vice-versa.
Now let’s say you pick different patterns, and again you find a collection of stocks that outperform. You think this is going to be somewhat of a random process where some of the winning stocks from pattern A/B become losers when you try patterns C/D or Y/Z. And that does occur. But you also find that some stocks are consistent winners throughout the various patterns. And of course, some are repeat losers (perhaps hoo-do stocks).
That leads to further inquiry to find what constitutes winning qualities or hoo-do qualities. Note that this is not a study of profitable patterns since the behavior is exhibited across different patterns, some mutually exclusive like trend-following and mean-reversion. Nor is it a study of good management styles, as the same behavior is exhibited with ETFs, which typically have no management.
You then try to identify specific characteristics (or group membership) of the winners. You might think sectors, because the behavior also occurs in ETFs, but not all of the constituents of a winning ETF are consistent winners, and ETFs behave differently than their constituents. You trot through the various possibilities: volume, volatility, beta, name recognition, size, sales, earnings, debt, short interest, institutional holdings, etc.
Continuously you come back to the possibility that some stocks are simply winners and others hoo-dos, until you can prove otherwise. It turns out (tongue firmly in cheek) that this is a good thing to know.
Alex Castaldo writes:
Probably I misunderstand or oversimplify the issue, but I think what is happening is like this.
Among stocks in your database there are some that have considerable price runups and declines, and others that have fewer such features. It is not exactly a question of volatility as conventionally defined, but it is somewhat related to it.
When you examine trading rules, selecting ones that are more successful with some stocks, you are necessarily picking up more stocks in the first category and fewer in the second.
There is a kind of oversampling at work that concentrates the successful population with stocks from the first category.
To take an absurd extreme to make things clear, if there is a stock that spent the entire data period at 10.00 (the ultimate quiet stock), then no method will make money from this stock, not trend-following, not mean-reversion, not seasonality, etc. This stock has zero chance of being among the 'winner' stocks, not because of its industry, or who is the CEO but simply because of the time-pattern of prices.
Aug
8
I Look Around Three Times, from Laurel Kenner
August 8, 2011 | 1 Comment
If there has been one consistency in the past two weeks, it is that market reactions have been the opposite of what might be logically expected. I look around three times when I say that for fear that reactions will now switch to the obvious.
Alex Castaldo adds:
Another example today 2011/08/08: The newly downgraded 10 Year US Bond went down in yield by 24 bips.
Jun
29
A Classic, from Victor Niederhoffer
June 29, 2011 | 2 Comments
Some hypotheses regarding the reaction to information? Case very similar to the flexionic move down when the bailout was passed. Since it was known to all flexes, they had to liquidate when they realized that what they positioned for happened? Of course there was the certainty that the new man of change would be elected also? Or was it a case of going up whenever it looked likely that the vote in Greece would be positive, and then when it happened, …as Dooley would say "how will they make it happen? What you think?".
Alex Castaldo writes:
Most were positioned in expectation of a favorable vote: long stocks and short bonds/bunds. For a while it seemed the markets cared about nothing else.
At 6:41 am ET Papadimitriou (from the opposition party) announced that he would vote for. The S&P vaulted past 1300 and the Bunds future fell below 126. The size of the market reaction perhaps incongruent with an announcement from a single politician.
Then the voting started.
At 8:45 Kouroublis voted against, and there was a noticeable sudden decline in stocks and rise in bonds, bunds. This did not last long.
At 8:56 Athanasiadis, who had been expected to vote against, voted in favor, with the opposite (though smaller) effect.
After the 9:04 announcement that the votes are available to guarantee passage, there was a period of hesitancy and then an attempt by the majority to make a dignified exit now that the expected had happened, only to find the exits rather more crowded and disorderly than hoped… The stock investors, especially, experiencing some downdrafts.
Alston Mabry writes:
Given the news about previous governments in Athens cooking the books to get into the €mark in the first place, and then all the reports of tax evasion and government benefit exploitation and so forth, it's easy to be skeptical, and even cynical, and take the view that things like "negotiated agreements" and "midnight parliamentary votes" and "austerity budgets" are things that politicians use as their own currency, and that they keep trying to spend this currency in an alternate imaginary world in which they believe they can hold off hard consequences with soft ideas. (See: "Munich agreement".)
Jun
25
Our Calendar Color Coding Scheme, from Alex Castaldo
June 25, 2011 | 1 Comment
Can you please outline the color coding rationale for the daily performance chart. I am confused on why some down days are red and the others are yellow..etc - A Reader
We track daily movements in U.S. stocks and bonds (specifically S&P Index futures and Long Bond futures).
The colors are based on the performance of both markets:
Red days: both stocks and bonds down.
Green days: both stocks and bonds up.
Yellow: stocks up, bonds down.
Blue (technically azure): stocks down, bonds up.
If you are interested in days when the Bonds are down, those would be Red or Yellow (depending on Stocks' performance). Personally, if I want to look at a single market I find it easier to ignore the color and just look at the sign of the price change shown.
Jun
15
A Scary Prediction, from Kevin Depew
June 15, 2011 | 2 Comments
 I think this essay is worth reading:
"primitive agricultural communities are `dynamic'. They are subject to continuing change in agricultural technology, induced by population pressure…"
And also this article by Grantham: "We're Heading Toward a Disaster of Biblical Proportions".
Victor Niederhoffer asks Alex Castaldo to explain to him what this is all about. Alex Castaldo writes:
The first link is a 108 page essay written in the early 1960s by Ester Boserup , a European agricultural economist I have heard about before but don't really know. At this time many people were concerned that overpopulation was a big problem for the world. In this essay she argues that actually in some cases a surge in population forced people in an area of the world to improve their agricultural technology and make other changes that were beneficial. So (local) population increase was actually a spur to innovation and economic progress.
Jeremy Grantham on the other hand is a contemporary money manager from Boston (born in England) who is always somewhat bearish (except in March 2009 when he briefly and correctly turned bullish). He is very environmentally concerned and always worries that humankind is using too many resources or using them unwisely. Quote: "Grantham [believes] that the world has undergone a permanent "paradigm shift" in which the number of people on planet Earth has finally and permanently outstripped the planet's ability to support us."
So the Boserup thesis and the Grantham thesis contradict each other, and Mr. Depew is quoting Boserup to counter Grantham.
Victor Niederhoffer writes:
Julian Simon would turn in his grave, as would the author of The Improving State of Humanity.
Vincent Andres writes:
If on the other hand, the most valuable resource is the human brain, a larger population is better.
Steve Ellison writes:
I would rephrase, "if on the other hand, the most valuable resource is the human independent brain,"(Because globally, what's the use of 1.000.000.000 similar brains ?).
The ratio in the brain distribution between the tails and the body probably matters. And the bigger the body, the bigger its reinforcement, and maybe (?) the bigger the crushing of independant brains.
… hopefully, this line of reasoning is wrong.
Feb
9
Article on the Fed Model, from Alex Castaldo
February 9, 2011 | Leave a Comment
Chair suggested this 2007 article of his (with Mr. Downing) on Dailyspeculations on the Fed Model (not the FRB/US econometric model) may be of interest to some.
Steve Ellison writes:
12 month forward earnings estimate now: 87.63
Index close today: 1320.88
Forward earnings yield: 6.63%
Alex Castaldo adds:
Ten year Treasury yield: 3.662%
Jan
25
Fantastic Wisdom, from Victor Niederhoffer
January 25, 2011 | 5 Comments
The more I learn and the more I experience the vicissitudes of life, (and the more aware of my ignorance I become), I think more and more that the wisdom of musicals, especially those of Hammerstein and Ira Gershwin, is especially poignant and sagacious.
Whenever I give advice, I find myself going back to things that I learned from my favorite musicals. I recently told a damsel in distress (one of my card's imperatives besides creating value, destroying ballyhoo, and fomenting revolutions) to listen to "September Song" by Kurt Weil and "Diamonds are a Girl's Best Friend".
I have to expand this thread to market wisdom but don't have the knack that the collab or my brother has in this regard. I believe because the musical word is so much slower than reading, and the scenes have to be so focused and riveting, and they have to appeal to the common American thread that the successful musicals are forced to get to the common nitty gritty that keeps one's feet on ground.
Alex Castaldo writes:
To be in Chair's trading room in August with the temperature 97 F and the musical Carousel playing for the 100th time is indeed a learning experience.
George Coyle writes:
 Well put, Doc. I had to walk outside into the cold for a second just reading that.
I wasn't a big fan of musicals until I heard them all several hundred times last summer, then they kinda stuck. I find the interesting thing to be that human psychology never seems to change as the messages inherent in the various musicals of the 40s-70s are the same things you hear today adjusted for the times.
The market takeaways to me are:
1. Patterns exist in musicals and markets, find them and potentially reap the benefits
2. Human psychology hasn't changed as evidenced by many of the themes in musicals still being applicable today. In as much as collective human psychology governs markets, markets probably haven't changed much either.
3. Sometimes a 3 minutes song can outdo a thousand page novel at describing some phenomenon…at times keeping it simple beats a lengthy analysis.
Ralph Di Fiore writes:
 I totally agree with you Victor. My all time favorite musical is the Fantasticks having watched it in Manhattan. Several of the songs from the Fantasticks have wisdom in them that would have saved immeasurable grief in the lives of some families I know (not my own thankfully) had they heeded the wisdom of this musical. One song from the Fantasticks screams out at me when I think of an older gentleman who botched up his family life and has an estranged son but this individual loves spending time in his garden. The closing line from the song Plant a Radish:
So
Plant a cabbage.
Get a cabbage.
Not a sauerkraut!
That’s why I love vegetables.
You know what you’re about!
Life is merry
If it’s very
Vegetarian.
A man who plants a garden
Is a very happy man!
A vegitari-
Very merry
Vegetarian!
Another family had a daughter that brought home a young man and asked her pa what he thought. He hated him so guess who got married… Here is the line from the song entitled Never Say No. Again from the Fantasticks:
Your daughter brings a young man in,
Says ‘Do you like him, Pa?’
Just say that he’s a fool and then:
You’ve got a son-in-law!
You’ve got a son-in-law!
Keep up the great posts, Victor.
Nov
23
J.P Morgan and Rockefeller, from Alex Castaldo
November 23, 2010 | Leave a Comment
At the time of his death on March 31, 1913 J.P. Morgan had an estate worth $80 million. Compared to his peers of the era, especially Rockefeller, it was not such a large estate. In fact, Rockefeller's comment at the time [after reading the pages and pages of obituaries, was rather sniffy:], "And to think he wasn't even a rich man."
Source: Ahamed: Lords of Finance
Oct
21
A Recent Study, from Victor Niederhoffer
October 21, 2010 | 4 Comments
 A recent study shows that Asians need about 50 points higher on the SAT to get into college than White students and 100 more than Black students. It is well known that Asians have a higher IQ by 5 points than Westerners. This is tested in numerous academic papers. Also, well known is that the more intelligent the CEO, the better the performance of his company or hedge fund. One hypothesizes therefore that the companies whose CEO's are Asian will show superior performance to those headed by your average non-Asian Harvard Business School Graduate, (although if they haven't taken the mandatory ethics course there, they are more likely to be caught in flexionic pursuits that the elite schools are so good at whitewashing). What is the support for all these statements? and: How could they be tested?
One knows that this is the most rancorous subject under the sun, and I have lost many friends when I was foolish enough to discuss this in the past, and point them to the incontrovertible evidence about individual differences from a Galtonesque perspective, but let us please try to keep it civil, and stick to the scientific literature (none of this armchair stuff about this or that study being culturally biased as the more culture free the tests, the greater the differences) and no anecdotes, but predictions and tests and references.
Alex Castaldo adds:
Since the Chair does not give footnotes, it is not easy to find the sources for his information.
I believe the "50 point study" may be the one mentioned by Steve Sailer's blog.
An IQ figure of "6 points higher" is given in the Rushton Jensen review paper.
Russ Sears comments:
I have doubts to the usefulness of CEO's IQ test as over-performance of a companies stock. It is not that CEO's do not need to be smart, it is simply that there are enough smart people around and business is tough enough that those that made it have been culled out and vetted pretty completely. Show me the numbers, I am a skeptic.
Further, while creativity to overcoming obstacles in ones life may suggest carry-over into a CEO's performance. I doubt that overcoming one political rigid standard of race by offsetting another no doubt equally rigid political standard for entry into elite colleges would translate into the creativity needed for a successful business. Rather it signals the willingness to conform for acceptance. You mention Asian, but how many of the Asian's admitted for instance are women, versus men? Any stock study of CEO IQ education and minority must consider that education by minority race in the USA is widely distorted by the politically preferred sex of a student. May I suggest that one takes the list of Jewish Noble winners find how many come from the ivy league schools and compare this percentage to the non-Jews. Yes, the ivy league alumnus have a smaller world than most. But may I suggest those with the creativity to overcome this lack of sheepskin, are those that would out perform.
Here are some reasons why I believe IQ can be a handicap to a CEO…
1. Those great at answering questions that others already have the answers, a test situation, often find it uncomfortable and difficult to switch to asking questions that the answers are not known. The ability to ask questions that others did not is a key to make a difference.
2. Necessity is the mother of invention and desperation is the mother of risks taking. A well paying job, is often the road-block to starting a business. Probable failure is hard to choose when you have almost certain path to mild success. Yet it is the probable failures that succeed that skyrockets company. And vise-a-visa its the probable successful businesses that are blind-sided by innovation.
3. Like Reagan, often the most brilliant performers as a team are those that want to work with the smartest minds, they do not have to be the smartest guy in the room. The successful CEO does not have to ask the right question, he simply has to ask the right person to ask the right question.
4. High IQ people perform best with less stress, they can choke more in stress, does the Peter Principle apply to them under stress?
There are a couple thoughts that come to mind that could be tested.
1. New Research has shown that the brain does develop new cells, These baby brain cells are produced by cardiovascular exercise. Further, test after test suggest that cardio improves your creativity. Do CEO's that exercises out perform? There was a study of CEO gulf handicaps, is there a similar study of say 5k times? Are there other test of creativity, say CEO's that are talented pianist, CEO's that are writers do they out perform? Do CEO rising from the operational side ( engineers, IT etc) outperform those that come from the marketing side?
2. A few years ago it was suggested that many CEO's are dyslexic, Could a twice exceptional CEO (high IQ but learning disability) out or under perform?
There are a couple thoughts that come to mind that could be tested.
Victor Niederhoffer adds:
For those interested in a factual, scientific discussion of environment versus innate influences, rather than armchair speculations so grievously present in our environment, and so dysfunctional to proper thinking about markets if similarly believed or proposed, I would recommend this article and the references cited thereto.
Also note the same kind of commentary there relating to making all individual differences consistent with the idea that has the world in its grip, and the purpose of life being self sacrifice.
Sep
2
NYC Junto for September 2010, from Alex Castaldo
September 2, 2010 | 1 Comment
The next meeting of the NYC Junto, on Thursday September 2, will feature Gene Epstein, Economics Editor of Barron's. He will be talking about "what is wrong with economics".
The meetings are at the Mechanics Institute, 20 West 44 th Street, starting at 7:00pm.
Jun
21
 The annual meeting of the IAFE in New York on 2010/06/18 featured UCLA's Prof. Richard Roll , who was a colleague of Chair at the University of Chicago many years ago. He started out by warning the audience that his explanation is different from everybody else's, cannot really be considered proven, and may be hard to accept. Nevertheless he urged the audience to keep an open mind, if only because if this explanation is correct then the current remedies may actually be harmful.
First he dismissed the popular idea that inappropriately low interest rates caused a bubble in real estate prices, which then crashed. Although nominal interest rates were low, the more relevant real interest rates (as shown by the yield on TIPS) were actually rising during the period 2004 to 2007.
Also, defaults in the debt or derivatives markets cannot have been at the root of the crisis, contrary to common opinion. The net amount of debt in the economy is zero (someone owns each debt and someone else owes it) as is the net amount of derivatives (for every long there is a short). Default on debt simply involves a redistribution of wealth, not a destruction of wealth. For example if a borrower defaults on a $300,000 mortgage, and the house is now worth 200,000, the result is essentially as if the bank had given a $100,000 "gift" to the borrower. One is better off and the other is worse off, but the net national wealth is unchanged. These are just redistributions with no (or little) system wide effect.
So what happened? Roll believes that the root of the crisis was a reduction in wealth, and specifically a drop in the value of human capital. Recall that human capital is the present value of all future labor income streams for all persons. It is very difficult to measure because it requires knowledge (or estimates) of the future; but it must be a very large number, perhaps the largest component of national wealth. Roll believes that the value of human capital is correlated with the value of real estate and, to a lesser extent to the value of the stock market. The correlation can be seen, for example, in the fact that people who expect to have a high income in the future live in expensive houses; the value of someone's house is to some extent an estimate of that person's future income.
According to Roll a sharp drop in the value of human capital took place in 2007-2008. This immediately, or perhaps with a short lag, caused a drop in the value of real estate and (to a lesser extent) a drop in stocks (because if the people's future income is expected to be lower, the revenues of corporations will also be lower). We cannot measure the drop in human capital directly, but the drop in real estate and stocks is a clue that (according to Roll) the value of human capital dropped.
The only remaining question is why the value of human capital fell. Roll's controversial explanation is that the market correctly anticipated that government intervention would greatly increase in the years ahead, and that his would cause a permanent lowering of the rate of growth of labor income. Economists have found that past a certain point, a decrease in the share of GDP generated in the private sector leads to lower growth; conversely "liberalization" or an increase in the private share typically leads to higher growth.
This explanation was contested by a member of the audience, who said he had worked in the mortgage securities field and who felt that enormous problems developed in the mortgage market which the Professor was leaving out and which were essential to understaning the crisis.
Another member of the audience pointed out that the professor's explanation is similar to the theory of Amity Shlaes as to why the Great Depression lasted a long time.
Another critique was made by derivatives textbook author John Hull, who felt that the human capital explanation was on the right track, but disagreed about the cause. He felt that the markets began to realize that the US was increasingly unable to compete with China and could not easily restructure itself because of weaknesses in education and skills of the US population. Roll replied that this explanation was too specific to the Us, and did not account for the fact that other countries, for ex. Great Britain, also experienced a severe financial crisis.
Steve Ellison writes:
One possible reason for a decline in human capital is the aging of the population. As the average age of the population increases, the value of future income decreases.
Rocky Humbert writes:
Roll says, "Default on debt simply involves a redistribution of wealth, not a destruction of wealth. And that wide-spread defaults have no system-wide effects."
His argument is like saying "Muggers and bank robbers simply involve a redistribution of wealth, not a destruction of wealth." He ignores the costs and consequences that wide-spread mugging and bank robbing would have on behavior and economic activity. He also ignores that bankruptcy and reorganization imposes significant costs on all of the stakeholders (and by extension, society as a whole.) That's one reason why the value of an enterprise declines as it enters bankruptcy protection. Defaults is not a zero sum game with the value moving from shareholders to creditors. It's a negative sum game.
Professor Roll's argument falls down when one considers that "human capital" is a balance sheet item, but "human income" is on the cashflow statement. A country, company and individual with a negative net worth (negative human capital) can function without any problems — but it's when the cash flow cannot support the expenses that the problem causes a crisis. Hence, human capital is like goodwill on a corporate balance sheet. It's an accounting fiction. It's the human cash flow that matters.
Gibbons Burke writes:
Abortion and contraception have taken a heavy toll on human capital. Since Roe v. Wade was decided, over 50 million potentially productive human beings have been murdered in the womb in the U.S. alone.
Kim Zussman adds:
You wrote "the drop in real estate and stocks is a clue that (according to Roll) the value of human capital dropped."
Then it must have been true that human capital (anomalously) increased, causing the housing bubble in the first place.
In the attached chart (Case-Shiller real house-price data, 1890-2010), the bubble peaking in 2006 DWARFS all other housing price peaks over 120 years.
Perhaps a surreptitious rally in human capital occurred, manifested by the unprecedented housing bubble?

Rudolf Hauser comments:
It is not quite fair to criticize Prof. Richard Roll without having heard his presentation, but based on Alex's summary thereof, I will do so nonetheless. I agree with some of what he has to say but differ in many respects. The main failure is to make any reference to the discount rate. Wealth may be the present value of future income but that is both a function of those future income streams and the rate by which they are discounted. I also find the focus on the value of human capital a strange form of analysis which ignores some market realities as to what actually happened.
Let me start by a very simplified explanation. Real wealth in the capital stock is created when someone labors to produce it. That includes amounts spend in developing human capital via education and training. That labor means that consumption will be less than the amount of production by the amount of that capital investment. But that tells us nothing about how existing wealth is valued. Assume A is moving from NY to LA and B is moving from LA to NY. Both purchased their homes for $100,000. They now decide that their homes are worth $500,000. They trade homes. All they have is capital transfer. It hardly matters what the actual value is in that it is an even exchange. Now in reality A will sell his home for that amount to someone, just a B will, and they will both buy their respective homes from others. The ignoring the intermediate transactions, that is in effect what you have. Now in the past people and lenders would base their decisions largely on their expected future incomes. But in the sort of bubble situation we had in housing, people were expecting home price appreciation to bail them out. In essence, expected future appreciation was part of their anticipated income stream. Now when it was finally realized that this assumption was a chimera that it was decided that the two homes were only worth $300,000. Now wealth has declined in value. The only question is who bears the loss. Given the mortgage amounts the lenders might well find that they must bear some of that loss. There is no reason to refer to "gifts" to the borrower. It is the decline in the value of the property, of wealth that causes the loss. It makes no sense to call that loss a gift.
Then we get to what brings about the additional losses of real wealth. That happens when capital, either physical or human, becomes useless in producing future income. That can happen when lenders refuse to renew loans and/or revenue declines cause bankruptcies. Long periods of unemployment destroy human capital. Physical capital decays from neglect. And that can happen because firms are driven into bankruptcy because of debt defaults and their ability to refinance themselves.
As to the argument that this was a drop in the value of human capital, it is first of all something that cannot be measured. The wealth we can measure has cyclical tendencies. While the recent recession was one that might logically influence future expectations, for the most part recessions are and should be expected as they have always happened from time to time. There is no reason why they should change long-term expectations other than emotions. What does happen is that there is a need in the time of crisis to have more liquidity. That increases the risk premium on longer-term and less liquid assets. Part of that increase in returns is an expectation of capital gains when the liquidity crisis/recession ends. That is why we often see an inverted yield curve leading into such declines. Logically, the yield curve should become more positive, not turn negative, because risk premiums should rise more on the longer term assets. But what matters is total return and that included anticipated capital gains. When those are not great enough the yield curve does not invert, as was the case in the 1930s. Well if the declines in wealth were due to changes in future expectations that is not what you would see. Rather it is because of what I would call risk liquidity premiums rising. If Roll's argument were valid with regard to government intervention, how does he explain the increase in stock values of the past two years-a period when by all logic the changes in government should be increasing fears of greater intervention?
What happened was that the markets finally realized that with all the complicated debt and derivate structures that depended on counterparties many transactions away to deliver was in doubt and that no one's balance sheets could be trusted anymore. With that lending dried up and all values where put into question. That cause a large increase in risk liquidity premiums that was only mitigated by the Fed belatedly pouring in large amounts of liquidity and the government offering guarantees for parts of the financial system.
Another point, although a bit more trivial. When Alex writes that Roll said that "The net amount of debt in the economy is zero." he ignores the fact that some of that debt is owed to foreigners. That is the statement is only true in an international sense.
What you had in this period was an increase in the foreign inflow of savings. Net fixed non-residential investment by business relative to GDP was significantly lower than it had been in the 1990s. In essence there was too much savings wanting to earn higher returns relative to the business investment opportunities leading investors to finance a housing boom instead.
Jun
6
For the “Gold Bugs”, from Alex Castaldo
June 6, 2010 | 1 Comment
On June 5 , 1933 the United States went off the gold standard. Would we be better off today if it had not happened? - A Reader.
The classical gold standard, which brought price stability and prosperity to the major countries of the world, ended with the outbreak of World War I in 1914. Price stability was thrown overboard as a goal; fighting the war was deemed more important by the leaders at that time. The gold standard was dead.
What happened next is quite instructive.
In 1924 England (the most important country in the world) decided to restore the gold standard using the same parity for the British pound as before the war. But the price level was a lot higher as a result of the inflation during World War I. Have you ever tried to put on an old pair of blue jeans after you have gained 10 pounds? It is quite painful, especially around the waist and crotch. And so it was: the newly restored gold standard began to put heavy downward pressure on prices and on economic activity. Ultimately this was a major contributor to the severity of the Great Depression.
The 1924 decision is one of the greatest economic policy blunders in history, probably second only to the decision by emperor Diocletian in 301 AD to put price controls on food. It was highly contractionary and backward looking, attempting to restore a status quo that was realistically no longer achievable. They had not carefully thought it through and were doing mostly for reasons of prestige and tradition. Starting in 1932 and 1933 the error had become obvious and countries began to get off the gold standard and they immediately began to experience economic improvement; the worst of the depression was over. Relief at last, the blunder had been corrected.
So June 5, 1933 is not really the end of the gold standard but the end of the ill-advised 1924-1933 attempt to re-establish the gold standard in a mistaken and poorly coordinated manner. And we should all be glad that episode is over.
Stefan Jovanovich opines:
Alex repeats several common misconceptions that are thoroughly embedded in the received wisdom of the current academic age. The post-Civil War advocates of the resumption of the classical gold standard - President Grant being the most notable - were quite clear about what they wanted - the resumption of the absolute right of holders of U.S. Treasury notes to convert their paper dollars to gold at the Constitutional standard. They did not promise or expect the classical gold standard to bring "price stability"; they did not even expect it to bring "prosperity". They expected it to bring a fundamental honesty to the Federal government's accounts by making it impossible for Congress to indulge in serial deficits. (It is no accident that Grant's political opponents challenged his proposals by accusing him of personal dishonesty; if you are going to attack a straightforward plan for keeping straight books, argue that the proponent has been stealing from petty cash.) What seems almost impossible for the well-trained mind of the present to understand (whether educated in New Haven or Cambridge East or West) is that it was the discontinuities of the classical gold standard that were its great strength. The earnest reformers who brought us the Federal Reserve Act and those who are now eager to bring us a world currency and unified central bank share the Marxist illusions that the marketplace fluctuations in prices can be tamed if only the government gained absolute control over money and credit. It is an appealing and enduring fantasy, even if it is also a folly. What the supporters of the classical gold standard understood is that free exchange between people can create wonderments of credit and commerce if there is open competition and the price terms for the ultimate clearing of transactions are not subject to government manipulation. They also understood that governments cannot avoid being monopolies where the question of legal tender is concerned; indeed, the U.S. Constitution itself required that Congress have monopoly power over the United States' money. The only solution was to limit the government authority by requiring its paper to be backed by specie. Hence, the classical gold standard.
One of the complications of dealing with the history classical gold standard is that, while the United States was on the classical gold standard from 1791 onwards, our government, unlike Britain's, never resolved in the 19th century the issue of whether a central bank to have the right to issue notes that were to be accepted by the Treasury (in Britain the Exchequer) as legal tender. The United States had the further complication of bimetallism - dealing with what Gresham had explained to be a logical impossibility, having two legal tenders whose exchange ratios would be fixed. What both Britain and the United States did have in common was the presumption that the fluctuations in relative prices between different countries would be adjusted through discounting of trade bills, not through adjustment of their respective conversion ratios of paper into gold. In that sense both Alan and Alex are right. Britain (along with France, Germany and Austria-Hungary) abandoned the classical gold standard at the onset of WW I; but the United States did remain on the classical gold standard until June 5, 1933. Until that date a person could tender $20 in paper U.S. currency to the Treasury or a national bank and receive an ounce of gold stamped by the U.S. Mint as legal tender.
Alex is also correct in stating that Britain's attempt to do what the United States had done after the Civil War - resume convertibility - was a failure. But the failure came not from the choice of the pre-war ratio but from the assumption that a gold exchange standard could replace private party discounting as a mechanism for adjusting relative prices between countries. The classical gold standard was not restored after World War I. During the war and after its end every country in Europe had exchange controls and limits on specie redemption; even exchanges of specie for paper currency between countries were limited by international agreement. What was "restored" was something that had not existed before the Great War - a gold exchange standard. The gold exchange standard presumed that the terms of international trade would be controlled by coordination between the central banks, not by the marketplace results of private credit transactions. The gold exchange standard allowed central banks to accept each other's paper based on the assurance that the inter-government swaps would be backed by gold, but that guarantee was a fiction. The U.S. had substantially all of the world's gold reserves, just as it did after WW II; Britain's ability to pay its war debts in gold was based on the assumption that Germany would pay its reparations in gold which it would borrow from the United States.
Britain's valuing the pound at the pre-war exchange standard would not have had any ill effects if private credit markets had revived because Britain's trade bills would have been freely discounted. The best way to understand the post-WW I world economy is to see it as comparable to the present situation in the U.S. real estate market; the massive expansion of government debt and guarantees had left the world with an enormous mound of crap paper that could not be written down to its actual value because the pricing mechanisms of the pre-war world had literally been destroyed. It was very much extend and pretend. The abandonment of the gold exchange standard did not, as Alan suggests, revive world economies; Europe's output of consumer goods rose only slightly from 1932 and did not recover to 1929 levels until the 1950s; and the United States' record was not much better. The only production that did increase substantially in the 1930s and 1940s was spending for war.
May
5
Goodbye to April 2010, from Alex Castaldo
May 5, 2010 | Leave a Comment
The DailySpeculations.Com calendar has been advanced to May 2010. A curious but possibly insignificant fact is that there were no red days in April 2010. A red day is a day when both S&P futures and Tbond futures are down. The other possible colors are: blue (S&P down, bonds up), orange (S&P up, bonds down) and green (both up).
You can look at past months' calendars here:
Mar
20
Backwardation, from Jim Sogi
March 20, 2010 | Leave a Comment
Can readers help me understand the meaning of backwardation vs contango in the past in the ES? Why is it negative now? Does it mean people think it's going to go down, or are the rates that low? I've studied, but don't really understood the formulas for computing the values of the future contracts or why there is a negative spread now when is was +4 points or higher spread in 2007 as the market topped on the rolls.
Nick White lends a hand:
Garden variety futures valuation is just a simple cost of carry model: the price of the underlying today adjusted for the cashflows you expect to pay/receive until expiry. The whole bundle is then appropriately adjusted via interest rates for time — effectively, the exact same as any other asset.
Intuitively, this is easy to understand if you think of how NPV — or a DCF model — works and then team it up with the laws of arbitrage. What is your asset worth today given what you will spend and receive for it over a given period, adjusted for interest rates? If your asset can be exactly replicated, is the price of that replication worth more or less than the original? If so — ceteris parabus — you can arb it.
The proviso to the above is that not everybody has the same interest rate in their model… your cost of funding may be very different to mine, which will be very different to GS's. I would argue that — care factor on Index Arb notwithstanding — one's ability and inclination to practice any form of index arb depends vitally on this cost of funding rather than some point spread in the rolls… and that in turn "depends" on whether the arb is long stock / short future or vice versa. Risk free rates are just a proxy.
So, if you cannot perform index arb… what is this info useful for? Knowing the fair value spread might give you a few ticks edge when placing an order because the future may already be a bit over/under extended vs the cash market. So, to provide an example, if you're buying, you may be better to place your order — per the Chair's admonition — a couple of ticks behind the BBO if the fut is over-extended vs the cash. Otherwise, you might want to lift the fut if the cash has moved and the future is lagging.
Very simplistic — but backwardation and contango are just natural progressions of these pricing models, adjusted for the vagaries of short-term supply and demand.
Steve Ellison comments:
 Philip L. Carret, in his 1931 book The Art of Speculation, considered it very bullish when stock dividend yields exceeded the margin interest rate. In such circumstances, he said, stocks "carried themselves", i.e., one could buy stocks on margin and pay the interest on the loan using dividends. Backwardation indicates that S&P 500 futures now carry themselves.
The S&P 500 futures began trading in 1982 and almost never traded in backwardation for the next 20 years. They went into backwardation in mid-2002 and stayed in backwardation for most of the next two years, advancing 53% during this time. They have been in backwardation continuously since October 17, 2008, advancing 25% during this time.
Russ Sears interjects:
 I have seen some option quotes on Enron, that had calls, same strike, different maturities (I believe it was Oct and Dec maturities) that apparently had some time arbitrage. Not sure they were actionable though. In 2000 I bought some deep deep out of the money long term custom interest rate options, that later became in the money, for my old company. The selling counterparty called in 2003 and begged us to sell them back, because they were very difficult to hedge. He told me they were so far out of the money that they sold them thinking they would never have to actually hedge them. I suspect in both cases the option seller, simply booked the premiums as 100% profit, so the theory really went out the door.
Quant Chicken writes in:
The personal impression I formed when I reviewed the empirical academic literature 4-5 years ago was that the forward is not an unbiased predictor (contrary to the theories of FX I had learned in school). The "forward premium puzzle" has been confirmed using so many different statistical tests (some quite esoteric) that I came to believe there is something to it.
I was getting interested in investing real money in this anomaly when I was dissuaded by wiser colleagues, who pointed out that this "carry trade" idea (borrow in low yielding currencies, invest in high yielding ones) was getting crowded, everyone was getting into it, DB started an ETF to allow public to participate (this was in 2006), etc. And statistically the evidence was not very strong. In retrospect I am glad my friends advised me to stay out of it.
Mar
6
Goodbye to February 2010, from Alex Castaldo
March 6, 2010 | Leave a Comment
With one week of March now over, the Dailyspeculations.Com calendar has been updated to no longer show the month of February. Those wanting more context can look at the old February page.
Feb
6
Goodbye to January 2010, from Alex Castaldo
February 6, 2010 | Leave a Comment
Now that the first week of February has elapsed, we will tear off the January page from the calendar and show only February. We have saved a copy of January for future reference.
Feb
1
Sports and Stock Stats, from Paul Marino
February 1, 2010 | 4 Comments
Just as Daily Spec is starting to present financial data in sports-statistic-like terms, Bloomberg has announced that it will use its analysis tools on sports.
Robert Smythe asks:
Can someone explain briefly the chart at the top of the page? What do these numbers mean? USB?
Alex Castaldo says:
These are the price moves in S&P futures and in Bond futures on the given day. (Sorry about the ugly abbreviation USB, the full word US Bonds did not quite fit the allotted space). In each case the nearby futures contract (currently March) is the one we use.
The price change for bonds is quoted in points and thirty-seconds of a point, as is traditional in Bonds. So for example on January 12 bonds rose by 1 point and 20/32, and this is shown as +1.20.
As Paul Marino notes, the whole thing is inspired by sport scorecards that show the recent wins/losses for a team.
The four colors are based on who wins and loses on any given day. A Red ink day is when both Equity and Bond investors lose, while Green is when bond and equity prices both go up. The mixed cases are: a warm orange color when the environment was favorable to those who take equity risk but unfavorable to those who avoid equity risk (i.e. bond investors), a cool blue when stock prices went down and bond prices went up (sometimes called a flight to safety or flight from risk day).
We hope you find our calendar interesting.
Nov
13
The Elusive Market Portfolio, from Alex Castaldo
November 13, 2009 | Leave a Comment
I have two investments A and B. If I regress B's return on A the intercept (alpha) will show whether B is preferable to A. But whether I regress A against B, or B against A, I get a positive intercept. It's as if A has alpha over B, and also B has alpha over A, which makes no sense. — A Reader
In Markowitz's theory, given two different investments A and B it is not in general possible to say "it has to be the case that either A outperforms B or B outperforms A, tell me which it is." There is no way to compare two investments and rank them in this way in general (as mathematicians would say there is not a "total order"). So it is not entirely surprising that the method of regressing A on B and B on A does not give a consistent answer as to which of A or B is better. No method will give such an answer in general. We have to live with that.
What Markowitz does say is that if you have $1, you can allocate it across A and B in various proportions (which could include shorting one of the assets to buy more of the other) and thus generate a "portfolio frontier" of points with various risk/return. Whether, in the particular case the letter writer brings up, this exercise would yield worthwhile insights I do not know. For example, if the writer revealed to us the variance-covariance matrix of returns (i.e. three numbers c11, c12 and c22) we could compute the Global Minimum Variance Portfolio weights [which are w1= (c22-c12)/(c11-2*c12+c22) and w2=(c11-c12)/(c11-2*c12+c22)], and if we knew the returns as well we could trace out the frontier. We could plot it and look at it. Useful? I don't know.
The theoreticians who came after Markowitz (Sharpe, Jensen, et. al.) believed that there is a very special portfolio in the universe called the Market Portfolio and that everyone would want to hold that plus perhaps small amounts of "other stuff." Under some fairly restrictive assumptions the desirability of the "other stuff" could be gauged by regressing its return on the Market Portfolio, always assuming that you could identify what this Market Portfolio is. Only by convention, or approximation, is this portfolio identified with the Standard & Poor 500. In any case the situation is not symmetric and the Market Portfolio plays a very special role in the theory.
What I am trying to point out is that we are so used to regressing things against the S&P 500 or other indexes every day that we sometimes lose track of the fact that this procedure does not in general allow us to rank two arbitrary investments. To compute an alpha you have to do the regression against "the market factor(s)" — not just any investment.
Nov
12
Statisticians Reject Global Cooling, from An Admiral
November 12, 2009 | 2 Comments
In pure spirit of "contrarianism", I like this article about global cooling:
Statisticians Reject Global Cooling
In a blind test, the AP gave temperature data to four independent statisticians and asked them to look for trends, without telling them what the numbers represented.
….Global warming skeptics base their claims on an unusually hot year in 1998. Since then, they say, temperatures have dropped — thus, a cooling trend.
….if you analyze the trend during that 10 years, the trend is actually positive
….to find the cooling trend, the 30 years of satellite temperatures must be used.
….It's what happens within the past 10 years or so, not the overall average, that counts
….the 10-year average for the past 10 years is higher than the previous 10 years
….You're going to get a different line depending on which year you choose
….The trend disappears if the analysis starts in 1997. And it trends upward if you begin in 1999
….it's important to look at moving averages of about 10 years
….looking back 31 years, temperatures have gone up
Oceans, which take longer to heat up and longer to cool, greatly influence short-term weather…..the current El Nino is forecast to get stronger, probably pushing global temperatures even higher next year
The quote I liked when I studied statistics at the University (although it could be perceived as politically incorrect nowadays) looks appropriate to me in this case:
Statistics are like bikinis. What they reveal is suggestive, but what they conceal is vital. Aaron Levenstein
These discussions recall those about the stock market. Is it better a 50-days moving average or 13-days? Is the secular up drift over because of the recent downturn or what we are living is just another historical buy opportunity?
It looks like a discussion at a sports bar in Italy about the winner of the next soccer season.
In the meantime, let's take a look at El Niño and its effects on commodities and stock markets. In fact, the pattern of winds and ocean temperatures during an El Niño changes the jet streams steering storms over North and South America. It affects also monsoons carrying away moist air that would produce monsoon rains.
Provided that the forecast is statistically significant.
Paolo Pezzutti writes:
From Bloomberg Beijing's Heaviest Snow in 54 Years Strands Thousands
….the heaviest snowfall in the Chinese capital in at least 54 years blanketed the city for the third day this month. ….The government induced snowfall in the capital on Nov. 10 by seeding clouds with silver iodide, the China Daily newspaper reported yesterday, citing an unidentified official at the Beijing Weather Modification Office. Zhang Qiang, head of the office, said the agency induced snow on Nov. 1 by seeding clouds with 186 doses of silver iodide, according to a separate Xinhua report. The seeding brought an additional 16 million tons of snow, according to the report. Beijing takes every opportunity to induce precipitation as the city is suffering from drought, Xinhua cited Zhang as saying.
Maybe a global cooling could be induced artificially.
Anton Johnson comments:
Though theoretically possible, is induced global cooling really what we want? Looking at the Chinese snow example, what is happening? When seeding clouds, atmospheric super-cooled water completes nucleation and freezes, and then precipitates as snow. At liquid-solid phase change, latent heat is released. The converse occurs at the solid-liquid phase change, thus environmental heat energy nets out. That is, assuming the snow melts.
However, the higher albedo of snow compared to most of the earth’s surfaces causes increased solar energy to be reflected into space. So what happens when this cycle is taken to the extreme, that is, if we get the temperature balance wrong? A net increase in global snow cover will cause a net decrease in total solar energy absorbed globally, causing more precipitation to fall as snow, etc, etc; thus plunging the earth into an ice-age. Good-bye New York, Chicago and London. That is until the oceans cool sufficiently, reducing evaporation and precipitation to an inflection point that reverses the cycle – maybe after 10K-20K years.
May
17
 Friedrich Hayek always said that he was a "Burkean Whig". Since England was always the place where he felt most at home, it is not surprising that he would have looked to late 18th century English politics for his model of liberty. But, he might have had greater success in finding successful advocates for his ideas about money and commerce if he had looked across the pond.
When the Constitutional Convention took up the question of legal tender, the initial draft carried over the language from the Articles of Confederation: "the legislature of the United States shall have the power to borrow money and emit bills of credit." Hayek's intellectual forefathers would have none of it. They gave the Congress the Power to "borrow Money on the Credit of the United States" and "To coin Money, regulate the Value thereof, and of foreign Coin" and "To Provide for the Punishment of counterfeiting the Securities and current coin of the United States".
This was a political argument that Hamilton had no trouble winning. The delegates took it as self-evident that "to emit an unfunded paper as the sign of value ought not to continue a formal part of the Constitution, nor ever hereafter to be employed; being, in its nature, repugnant with abuses and liable to be made the engine of imposition and fraud." (Alexander Hamilton)
Washington, as always, had the final word on the subject: "We may become a great commercial and flourishing nation. But, if in the pursuit of the means we should unfortunately stumble again on unfunded paper money or any similar species of fraud, we shall assuredly give a fatal stab to our national credit in its infancy.
Easan Katir writes:
This past month I studied "Capital & Finance in the Age of the Renaissance" [translated] in 1928, to understand how the end game might work when governments spend beyond their means. In the 1500s kings and princes overspent to fight wars, and borrowed from the wealthy to pay the soldiers, who otherwise survived through loot and pillage. In the 2000s the governments overspent to fight wars (including war on terror, war on drugs, war on poverty) and borrowed from wealthy nations. During the Renaissance, the wiser creditors insisted on collateral for their loans governments, and thus eventually foreclosed on pledged Spanish copper and Tyrolean silver mines. Even with collateral, they had trouble collecting, and would frequently advance new loans in return for receiving partial payment on previous notes.Executive Summary: back then, in the short-term, the creditors did well (for about 50 years ), in the long term (200 yrs), it ended badly for the creditors when they slipped up and lent money to governments without collateral, which of course, defaulted.
Alex Castaldo comments:
Ehrenberg's book Capital and Finance in the Age of the Renaissance: A Study of the Fuggers and their Connections was a favorite reading assignment from the late economic historian Ch. Kindleberger. He even provided a capsule summary:
"This classic study of the Fugger bank in Augsburg in the 16th century focuses on war and money. Money is needed to buy soldiers, but with soldiers one can acquire money. The Fuggers were involved with Venice, Austria, the Holy Roman Empire, the financial markets of Lyons, Bruges and Antwerp, and through them, with the Spanish crown, which proved their undoing. The financial center of Europe was moving northward from Lucca, Florence and Venice (Genoa, a rival of the Fuggers for the Spanish treasure that was overdue in payment for loans when it reached Seville, hung on longer). The period was one of struggling capital markets. The mistake that brought down the Fuggers, and many a bank before and since, was lending too much to kings on inadequate security".
Stephen Jovanovich adds:
As much as I appreciate the patron saint of those of us in the finance bleachers for having the wit to say he studied economic history because he could not "hack the math" of plain economics, Professor Kindleberger did have his blind spots. He was, inevitably, a devoted member of the "where have all the flowers gone" Pete Seeger school of military history. The Fuggers were "involved in Venice" because they, like everyone else in Germany, went there to learn the new Italian science of double-entry bookkeeping. The soldiery that needed money - and ultimately bankrupted Philip II - were not the ones who discovered, collected and shipped the treasure of the Indies and the Americas to Spain; they paid for themselves a hundred times over. The military extravagances that doomed Philip II were the ones made not for profit but for faith - against the Dutch for their stubborn Protestantism and against the bastard Queen Elizabeth for her persistence in the Anglican heresy. The bit about "inadequate security" is actually funny; as Hayek kept reminding the members of the German history school and their Keynesian and Marxist successors, the state NEVER keeps its promises. It is the monopoly that is above all law and, as Philip II devoutly reminded all his petitioners, the sovereign's pledges can only be made good by God.
Dec
12
Keys to Today’s Action, from Victor Niederhoffer
December 12, 2008 | 25 Comments
 A key to today's action was Senator Reid's comment, "I hate to think of what's going to happen to Wall Street tomorrow" (Friday) overnight at S&P 830.
Jim Sogi comments:
Yen and Bonds shot to new highs, concurrent with the drop in equities, temporarily in the night market when everyone's defenses were down. Yen this morning, with no jiggles or pauses, mechanically marched down from 1.11 to 1.10, the proscribed PC number. It had the signs of a heavy hand. All seemed geared in lockstep in the various directions, like a clock. The equities are barely spare change compared to these markets. Imagine the economic effects of the marginal trades on a currency or on the the bond holdings. It made the equity moves almost seem… sedate? As for the comment, what a hubristic and ultimately wrong thing for a politician to say, almost like the mayor of a windy town. And now these are the people controlling the markets?
Thomas Miller writes:
He has a bright future on Wall Street after the political thing is over.
Alex Castaldo goes over the facts and figures:
S&P March futures closed at 885.40 on December 12, up 10.90 on day.
From Bloomberg December 11:
“I dread looking at Wall Street tomorrow,” Majority Leader Harry Reid said before the vote in Washington. “It’s not going to be a pleasant sight.”
Asian stocks and U.S. index futures immediately began falling after Reid’s comments. The MSCI Asia Pacific Index slumped 2.2 percent to 86.13 as of 12:33 p.m. Tokyo time, while March futures on the Standard & Poor’s 500 Index slipped 3.4 percent [i.e 844.75 at 22:33 EST, although they fell further to 830.0 in the next 10 minutes].
Dec
2
An Interesting Table Redone with Apologies to an Avuncular Relative, from Alex Castaldo
December 2, 2008 | 1 Comment
On November 21 we published a table from the Avunc in a way that made it difficult to adduce the point being made. After comment from aforesaid I have redone the table in a way that should be more self explanatory. Sorry and I hope to still be invited to the party.
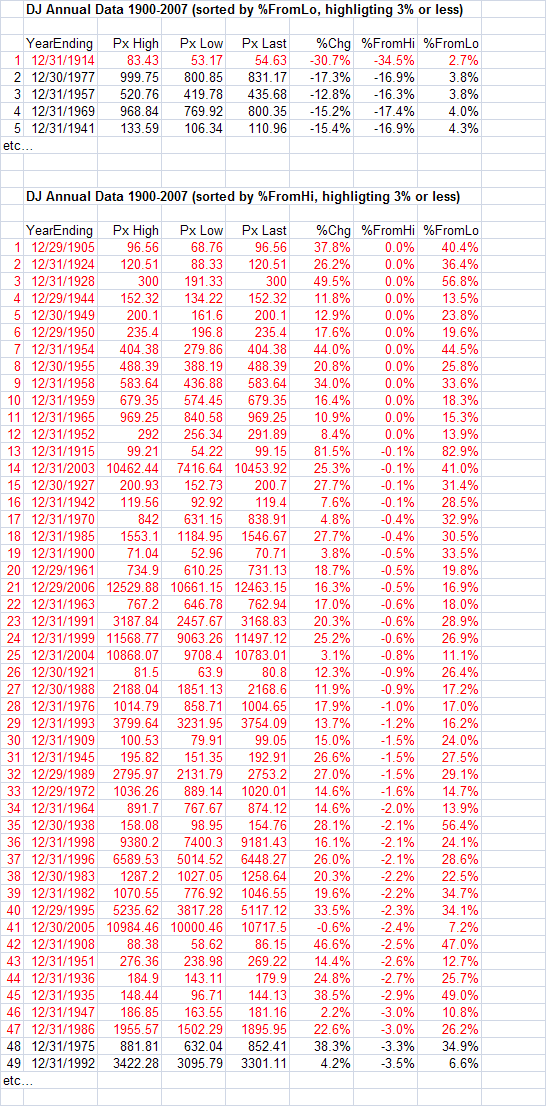
Oct
9
Current Update of Fed Model, from Alex Castaldo
October 9, 2008 | 13 Comments
SPX = 1000
Estimated Earnings = 97.74
=> earn yield 9.77%
10-yr Treasury Yield = 3.65%
=> spread 6.12%
=> SPX fair value = 2676 = earnings/10-yr
=> undervaluation -62.64%
=> expected return = 33.74% = 0.082 + 4.172 * spread
The model is forecasting a one year return of approximately 34%.
Sep
20
The Long Spoon, from Victor Niederhoffer
September 20, 2008 | 7 Comments
 I wonder naively, with the news of the bailout: will there not be clamors with the $1 trillion of assets that are being bought by the government at above market values, to extract some bits of flesh from those who are bailed out? Peter Public is being robbed to pay Paul Financial Firm, so to speak. But will Peter not complain and get his ounces of flesh? And will that not tarnish the luster of the gains in financial institutions in due course?
This is a speculation about which I have no expertise and no recommendation over and above saying, as I have for 30 years, that when you get out of the market because it's a "bear market," you have to get back in some time to reap the drift, and I don't know anyone astute enough to overcome that drift while he's out.
Alex Forshaw adds:
It reminds me of the October 15, 2007 announcement, except that this time the "Super Siv" (or MLEC) is $1 trillion-plus in size (instead of $75-100bn), the regulations are all the more drastic, the government has thrown $1 trillion away to save Wall Street's richest socialists, and… yeah, that's pretty much it.
If one had actually stuck to one's capitalist convictions throughout all this, one might actually not even be very surprised at the enormity of Bernanke's and Paulson's failure.
Alan Millhone worries:
I wonder if that 'long spoon' cradles castor oil? You hear the term hard to swallow. To me this applies to the bailout as the Bureau of the Treasury is running the presses 24/7 with someone holding the oiling can to keep down the sparks from the printing presses and all that paper may over time become nothing more than shin plasters!
Nigel Davies writes:
 On the long term drift: Can someone please show me the data for all these centuries in which stocks went up 1 million percent, or are we talking about just one, the 20th? The last 24 hours have admittedly seen some of the most desperate short covering from a heavily leaning market, but I don't think one should extrapolate too much from this.
About the bailout: Maybe these measures will "save the system," but there's a huge cost involved for Mr Taxpayer. And as Mr Taxpayer is also Mr Voter I wouldn't want to bet against his supporting some heavy handed regulation by those seeking office. Not to mention the fact that he's being hit real hard in the wallet region by this mess.
James Sogi comments:
 The problem with the rescue plan and the upcoming regulation is that the creators of the plan are filled with hubris. Why should these few men with limited experience and knowledge compared to the smartest people of the entire financial world be able to solve the problems that the entire financial world was unable to? Like central planners around the world, they will just create new problems and backlogs and inefficiencies that were so prevalent in the authoritarian and socialist countries.
The country is sliding into socialism, which is the extension of the moral hazard. Where there is no more risk, there will be little reward. On the television, the prevailing meme seems to be the bailout is for the benefit of the greedy Wall street moguls and is paid for by Joe Sixpack. In any case, it will create new opportunities as cycles change yet again. Today's S&P high from yesterday's low was the greatest up move. This is a signal of new cycles, just as much as February 28, 2007 was a signal to move into a high vol cycle. The definition of cycles resists quantitative testing, so the qualitative will have to suffice.
Alex Castaldo takes a turn to the left:
Why should these few men with limited experience and knowledge compared to the smartest people of the entire financial world be able to solve the problems that the entire financial world was unable to? — James Sogi.
Yes, but don't we also need to revise downward our estimate of how smart the so-called smartest people were? When the Warren Spector's, the Dick Fuld's, etc. etc. issue so much mortgage debt to people who now can't pay, that the entire financial system is put at risk, can we really continue to call them the smartest people?
Irrespective of that (…maybe I would have made the same error…), doesn't it make sense at this point to have the "smartest people" take a time out while the second-rate people in government (and I fully agree that they are second rate) try to patch up the problem so the game can resume again? Or do we just let the system blow up because the mistakes were made in good faith by the smartest people available at the time?
Don't tell me that markets are better than Soviet style central planning, Mr. Sogi, I already know that. Tell me what is to be done under these circumstances.
Someone told me today that the nationalisation of AIG is just like what happens in France and Argentina. I am sorry but again I have to disagree. The French government ran Air France for 40 years. The AIG measure is temporary; rather than a nationalisation in the Argentinian sense I would call it a controlled liquidation of AIG. Rather than be liquidated immediately (as was about to happen) they will do so gradually over two years; rather than receive subsidies from the Argentinian government they will have to pay LIBOR plus 8%, a punitive rate, etc. The differences are major. Let's not put all government interventions on the same plane.
Back to the "smartest people" issue. The analogy I see is the following: you have been operated on by the best available surgeon; unfortunately he made a mistake and left a clamp in your abdomen before sewing you up. It is midnight on a Saturday and the only available surgeon is a semi-retired practitioner of average skills. Would you agree to have him operate on you to save your life? It may well be that you would have not agreed to be operated on by this guy in the first place. But what do you do now?
[Disclosure: Alex is a depositor of Washington Mutual and owns Morgan Stanley stock].
James Sogi replies:
It is the spoiled child syndrome. Each time the spoiled child is saved from his mistakes, errors, rudeness, tantrums – he is inadvertently being trained to make these mistakes again. Better to mete out a measured negative punishment, time out, a reprimand, or suffering the consequences of bad behavior. Soon the child learns. There are behavioral cycles, adaptive mechanisms inherent in nature and free markets. By tampering with these, we end up with worse and worse swings as the adjusters over-adjust. Better to let Dick Fuld, and the overborrowers, take the hit. The entire financial system will not fail. It will start up again the next day no matter what happens. It may look different. There may be different players, but it will be there.
Remember the bitter pills Volcker dealt out in the 1980s with 24% mortgage rates, 14- 17% bonds. I saw many people take the hit. But inflation was crushed, and we enjoyed 20 years of moderation and prosperity. That was worth the price. Those who make bad choices should not be bailed out. It will encourage wild swings. It's the Greenspan Put all over again. If people know there's no second chance, they won't take the risks. If they do, they should be entitled to their profit or the pain of failure. When you do it your way, there is no cleansing cycles, and the toxin remains. Like Japan. It's just hiding the problems and they'll resurface somewhere else. Better to kill it now.
Let the big banks, big brokerages go down. New ones will take their place, smaller, faster moving. The market will find a way.
Sep
13
Ron King Retains Freestyle Checkers Title, from Alex Castaldo
September 13, 2008 | Leave a Comment
 Ron "Suki" King of Barbados retained his title as World Champion in GAYP (Go-As-You-Please) checkers today. He defeated the challenger Lubabalo Kondlo of South Africa on the 24th and last game in the series, held in Medina, OH. All previous games had ended in draws. The referee was Alan Millhone. Our congratulations to the winner.
[In Go-As-You-Please Checkers, the players begin in the starting position shown, and can make any opening move. In Restricted Opening Checkers, the first three moves are drawn at random to generate the starting position, and the players continue from there].
— keep looking »Archives
- July 2026
- June 2026
- May 2026
- April 2026
- March 2026
- February 2026
- January 2026
- December 2025
- November 2025
- October 2025
- September 2025
- August 2025
- July 2025
- June 2025
- May 2025
- April 2025
- March 2025
- February 2025
- January 2025
- December 2024
- November 2024
- October 2024
- September 2024
- August 2024
- July 2024
- June 2024
- May 2024
- April 2024
- March 2024
- February 2024
- January 2024
- December 2023
- November 2023
- October 2023
- September 2023
- August 2023
- July 2023
- June 2023
- May 2023
- April 2023
- March 2023
- February 2023
- January 2023
- December 2022
- November 2022
- October 2022
- September 2022
- August 2022
- July 2022
- June 2022
- May 2022
- April 2022
- March 2022
- February 2022
- January 2022
- December 2021
- November 2021
- October 2021
- September 2021
- August 2021
- July 2021
- June 2021
- May 2021
- April 2021
- March 2021
- February 2021
- January 2021
- December 2020
- November 2020
- October 2020
- September 2020
- August 2020
- July 2020
- June 2020
- May 2020
- April 2020
- March 2020
- February 2020
- January 2020
- December 2019
- November 2019
- October 2019
- September 2019
- August 2019
- July 2019
- June 2019
- May 2019
- April 2019
- March 2019
- February 2019
- January 2019
- December 2018
- November 2018
- October 2018
- September 2018
- August 2018
- July 2018
- June 2018
- May 2018
- April 2018
- March 2018
- February 2018
- January 2018
- December 2017
- November 2017
- October 2017
- September 2017
- August 2017
- July 2017
- June 2017
- May 2017
- April 2017
- March 2017
- February 2017
- January 2017
- December 2016
- November 2016
- October 2016
- September 2016
- August 2016
- July 2016
- June 2016
- May 2016
- April 2016
- March 2016
- February 2016
- January 2016
- December 2015
- November 2015
- October 2015
- September 2015
- August 2015
- July 2015
- June 2015
- May 2015
- April 2015
- March 2015
- February 2015
- January 2015
- December 2014
- November 2014
- October 2014
- September 2014
- August 2014
- July 2014
- June 2014
- May 2014
- April 2014
- March 2014
- February 2014
- January 2014
- December 2013
- November 2013
- October 2013
- September 2013
- August 2013
- July 2013
- June 2013
- May 2013
- April 2013
- March 2013
- February 2013
- January 2013
- December 2012
- November 2012
- October 2012
- September 2012
- August 2012
- July 2012
- June 2012
- May 2012
- April 2012
- March 2012
- February 2012
- January 2012
- December 2011
- November 2011
- October 2011
- September 2011
- August 2011
- July 2011
- June 2011
- May 2011
- April 2011
- March 2011
- February 2011
- January 2011
- December 2010
- November 2010
- October 2010
- September 2010
- August 2010
- July 2010
- June 2010
- May 2010
- April 2010
- March 2010
- February 2010
- January 2010
- December 2009
- November 2009
- October 2009
- September 2009
- August 2009
- July 2009
- June 2009
- May 2009
- April 2009
- March 2009
- February 2009
- January 2009
- December 2008
- November 2008
- October 2008
- September 2008
- August 2008
- July 2008
- June 2008
- May 2008
- April 2008
- March 2008
- February 2008
- January 2008
- December 2007
- November 2007
- October 2007
- September 2007
- August 2007
- July 2007
- June 2007
- May 2007
- April 2007
- March 2007
- February 2007
- January 2007
- December 2006
- November 2006
- October 2006
- September 2006
- August 2006
- Older Archives
Resources & Links
- The Letters Prize
- Pre-2007 Victor Niederhoffer Posts
- Vic’s NYC Junto
- Reading List
- Programming in 60 Seconds
- The Objectivist Center
- Foundation for Economic Education
- Tigerchess
- Dick Sears' G.T. Index
- Pre-2007 Daily Speculations
- Laurel & Vics' Worldly Investor Articles