Sep
30
Spare the Rod and Spoil the Child, from Kim Zussman
September 30, 2008 | 1 Comment
 Have you seen the kid who throws a tantrum to manipulate his parents? When he gets what he wants, he quiets down and seems vaguely satisfied. When he doesn't win the game, he throws an even bigger tantrum.
It's not that he particularly wants his object of desire; rather, he is in a power struggle with the authorities and probes their limits. If his parents keep giving in, eventually he will conclude (unless he is religious) there are no higher authorities. He himself holds the power, and is frighteningly in charge of his own destiny in a world without order or structure.
Alex Castaldo queries:
Are you talking about the child or the market?
Vince Fulco adds:
On a related note, when some of the senators were stumping for the 'bailout/rescue/whatever' speech, I was reminded of the prior generation's remarks prior to meting out a spanking. "This is going to hurt me much more than it is going to hurt you." Many of us with 1st and 2nd generation immigrant parents know how that one really turned out!
Sep
28
September 2008 vs September 1873, from Stefan Jovanovich
September 28, 2008 | 1 Comment
 Will the Treasury's plan be successful? The future "price" of MBS will be higher than any current estimate, but real estate lending will not resume until prices and the incomes of the borrowers become reasonable, even if the Treasury spends trillions. The single family home prices are coming close to the point of reasonable equilibrium now here in California, but I doubt they are anywhere close to that in the parts of the country where things were OK until this spring (NYC, for example).
What is fascinating to me as an outsider is that the question that Ulysses Grant successfully resolved by resumption of the unitary gold standard (1875) — the financial safety and assured purchasing power of savings — is not seen as of the key problem to be resolved. Everyone is worrying about the borrowers; but it is the savers who need to be reassured first. Some of my friends have wisely pointed out that the actual value of cash savings has been viciously eroded over the past few years by the rise in the price of everything from gasoline to boiled ham. If the Secretary of the Treasury were to announce a consumer TIPs plan, one that would guarantee consumer savings and demand deposits against institutional default and erosion of purchasing power, there would be a flood of deposits to banks that would be more than enough to save the banks.
What Grant understood was that the assurance that their money was as good as gold would allow individuals to "save and do better" and get on with their ordinary (sic) lives without having to pretend to be speculators. He was not a snob, but he knew, from a lifetime of family commercial experience, that most people were better at working than they were at trading and that the promise of liberty for American citizens had to include their right to have money that was permanently sound. What he also understood was that speculation involved the risk of catastrophic loss, and there must not be any government protections against that possibility. This is why he was able to accept the collapse of his fortune from the fraud of a partner with such equanimity; it was a risk he had already accepted when he made the bet. He would have been saddened but not surprised to see very rich people demand that bad credits be made good in the name of "the financial system"; that was what they had done throughout his tenure as President in demanding that the currency be expanded perpetually so that there was never a scarcity of credit.
If you are curious about the panic of 1873, you might look into the career of Bethel Henry Strousberg — a now-forgotten figure whose frauds were the ignition point for bringing down the credit house of cards, which was built, like the present one, on a fantasy of real asset prices' (in that case, railroads rather than houses) rising to the sky.
Kim Zussman sees a different analogy:
Recently here there have been discussions of what happened to Russians who bought property as the Tsarist empire collapsed c.a. 1917, and no doubt Putin's thugocracy is hoping the same for US.
Stefan Jovanovich replies:
 The biggest losers in that case were the French investors who had bought Russian railway bonds and government bonds during the pre-War boom. It had seemed to them a reasonable investment since Russia was the fastest-growing economy in the world in the decade leading up to 1914.
A side note: The philosopher Ludwig Wittgenstein's father Karl was considered an oddball for buying American rail bonds after the Panic of 1907 when "everyone knew" that America's best days were behind it. At that time his peers in Austria were buying German paper instead. Twenty plus years later his children were able to escape the Nazis by buying their way out of Austria using the proceeds from those same bonds which they had dutifully held to maturity. The German paper that so many of their friends had owned evaporated during the post-war currency hyperinflation.
Steve Leslie muses:
My experience as a financial advisor and broker for over 25 years tell me this about people and their reactionary practices. The next shoe to fall will be in October when retail investors get their monthly brokerage account reports and mutual funds statements and see how much money they have lost. Impulse will take over and they will issue across the board liquidations of mutual funds, annuities & etc. I just see so much pressure on the system in the short term technically that we are far from a resolution of this going forward.
Sep
26
Number of Observations = 1, from Kim Zussman
September 26, 2008 | 1 Comment
Historically, how many nationwide-housing bubbles have burst, with consumer debt/savings this high, within an extensively global interconnected economy (and markets), five weeks from election, from a problem blamed on Wall Street greed but designed to increase minority home-ownership, while at war in the Middle East, where credit markets are seizing up and the government wants to purchase the bad debt? And what if the markets don't stabilize long-term once a bail-out is approved?
Sep
23
Setting Main Street vs. Wall Street, from Jim Sogi
September 23, 2008 | 15 Comments
 The vilification of Wall Street is taking full force. It is the worst form of scapegoating, denial, and mistakes were made (but not by me). It is similar to the criticisms of the legal profession where the intransigence, unreasonableness, and greed of the litigants is blamed on the representatives who are doing the job set out for them in the system. The current crisis originated in the greed and failure to save by homeowners, their use of real estate borrowing for consumptive lifestyles. Their failure to save, their spendthrift ways are all being loaded on to the investment community who were doing their function within the system. Now emails are floating around fighting the bailout of billionaires on Wall Street. You are an easy scapegoat. No matter that the speculator helped provide the liquidity to create trillions in new wealth. No matter that the long held family home is valued at many multiples of it's purchase price. It is the most culpable real estate speculator and overextended consumer that now point the finger in the attempt to avoid their own errors, lack of judgment. With an election coming up, the politicians, the worst of all, are jumping on the BANDWAGON. The cycle is ending. The funny thing is that equities are barely down a 1/5 and they are throwing out the baby along with the bathwater. But it's good. We really don't need the big firms anymore with universal access and electronic execution. Truth is we really don't need big government either, but its turn comes next.
For the speculator, many new niches and many opportunity will arise. The government will be the ultimate slow mover. As they try to enter the market, as we have seen this last week, there are big waves kicked up. The least qualified populate government functions. Small and fast moving adaptors can thrive in such an environment. Seems that many big hedge funds are going down or weakening. The white shoe brokers are weak. The change will be good. It's just like evolution and climatic change. New species will arise. Many will perish unless they adapt. Even the data itself is reinventing itself with data over a year old being almost irrelevant. As Lack says, regulation will be a joke. Every rule will create a dozen loopholes to exploit that the slow moving professors never thought about. THEY can't control the markets. The big illusion is that government can cure the problems when in fact, THEY are the problem.
Kim Zussman replies:
 "Greed and failure to save by homeowners" is also what caused the markets to recover from the tech-bubble / 9-11 bear market. The FOMC could have chosen not to increase liquidity / ease rates in that environment — in which case there might have been a deeper/longer "my father's" recession.
Remember the wealth effect: as people's homes increased in value, they felt richer, borrowed more, spent more, and drove earnings up. And felt a lot of pressure to do so. How do you say no to the Mrs. when she complains about the many vacations the neighbors take, or their new boat?
One of my favorite symbols of this period was the web-ads showing ethnic-minority couples dancing on rooftops when their loan was approved. Hey, it's a free country.
Bruno Ombreux sees a silver lining:
Am I the only one thinking that this mess is actually very good news for small speculators?
Fewer investment banks, fewer hedge funds, higher cost of capital and more regulations mean less efficient markets, that is more edges. And at the same time less competition for those edges.
The golden age of speculation is coming.
Janice Dorn adds:
 Some days ago, I sent a copy of my first book to Alan Millhone. The title of the book is: Personal Responsibility: The Power Of You.
We are living through an epidemic of failure/unwillingness to accept personal responsibility for our actions. The blame game is just that. No personal responsibility. Mistakes were made ( but not by me). When the locus of control shifts from inward to outward, there is nothing but whining, blaming, gnashing of teeth, bullying, etc.
The worst lies are the lies we tell ourselves.
Tim Melvin argues:
 Don't confuse speculators with the banks and Wall Street. There is an enormous gulf between the two. The fact is the banks did create loans and loan structures that encouraged excessive borrowing. Merrill used to encourage homeowners to take out home equity loans and put the money in stocks. Homeowners did not create option ARMs or understand them. Banks created then and sold them. The public did not slice, dice and engineer toxic securities from their mortgages. Wall Street did that.
Does the public have culpability for their stupidity and greed? Of course they do and they are paying for it. Look at foreclosures. That can't be a pleasant experience. However, the Street has to take its share of blame for creating the speculative fires and then pouring gas on them.
Most "speculators" had nothing to do with the creation of this mess. They do not lend money or create securities. They trade. And most of us do it with our own money.
Jim Sogi replies:
While you are entirely correct, the public doesn't know or care of the difference, and blames you as much as Gold Man. Anything to deny personal responsibility.
Sep
19
Limit Points of the Great Moderation, from Kim Zussman
September 19, 2008 | 3 Comments
This week's normalized range in SP500 was 6th highest of the 3000+ weeks since January 1950. Normalized range is defined as:
[(week high)-(week low)] / [(week high)+(week low)]/2
(the high minus the low over the midpoint between the high and low)
Here are the biggest ranges (in chronological order), and the respective dates:

[Ed.: this table was updated at 1pm September 20 to correct an error in the previous version. Many thanks to a reader for pointing out the error].
Sep
9
Traits of Survivors, from Kim Zussman
September 9, 2008 | 6 Comments
A CNN program, Deep Survival, comes to some conclusions about the people who survive serious accidents and disasters:
many of the disaster survivors he studied weren't the most skilled, the strongest or the most experienced in their group. Those who seemed best suited for survival — the strongest or most skilled — were often the first to die off in life-or-death struggles, he says. Experience and physical strength can lead to carelessness. The Rambo types, a Navy SEAL tells Gonzales, are often the first to go.
Steven Scoles adds:
I read Gonzales book "Deep Survival" a couple of years ago and found it full of intriguing stories like the one noted in the article. I would highly recomend it. I do fair bit of mountain hiking and river kayaking and it made me realize how my experience has made me complacent in those activites (e.g. more willing to go off on my own in unknown territory)… not unlike bull markets make people complacent about risk.
Gibbons Burke preaches:
Faith in a G_d who promises life everlasting to those who believe and follow Him gives the faithful believer a great deal of peace of mind in the face of dire circumstances.
Kim Zussman replies:
 What then is one to do when faced by (the all too frequent) dire circumstances in a world without objective evidence of supernatural benevolence? Do you become forced to take up formerly illogical beliefs, and with that admitting your weakness and defining your faith?
Many traders share the experience of putting on a well-reasoned position which turns around to crush you. During the decision to fold or not (or G_d forbid, Martingale), does your internal voice change from "T=3.2!" to "WTF do I really know?" and if it doesn't, how is this not faith which transcends scientific self-doubt?
Gibbons Burke persists:
 We're speculating with regards to the true meal of a lifetime and beyond — or eternal barbeque, depending on your freedom to choose outcome you will. Seems perfectly on topic, no?
With apologies to Blaise Pascal for mangling his famous wager… the gaming odds for the prudent eternal investor favor belief, without even considering the utility of belief:
= A believer, if wrong, will never realize his error: he will be dead and to dust. Poof! His upside is limited to the benefits of that belief - peace, joy, happiness, fortitude, patience, courage, etc. (so-called fruits of the Holy Spirit) and perhaps the blessings of a life well lived, depending on the breaks.
= For the same reason, a non-believer, if right, will never realize any returns from his correct bet, so the upside on this option is capped at his expiration date (death). He, too, may have lived a seemingly good life, relatively uninhibited by the constraints of the believer's conscience and avoidance of sin.
Advantage: subjectively neither at this point.
However…
+ A believer, if right, will enjoy the eternal and infinite upside alpha of his investment in belief: life everlasting in communion with God, who is Himself Truth, Beauty, Virtue and all good things - to behold him face to face, for eternity, as well as the benefits which accrue to a life lived on earth in faith - even perhaps suffering for that faith. What a small premium to pay, relative to the potential reward, no?
- The non-believer, if wrong, will bear the eternal and ultimate lock-limit drawdown, with no stop loss in place. A literal margin call from Hell. Separation from God the Father. He will know he was wrong - for ever, and ever, world without end.
So, to put this into option terms:
The risk profile for investing in the LEAP of faith — a 'call' option of belief in the Underlying Security — is unlimited upside if he's right; limited down side if he's wrong.
The 'naked put' option of the who doesn't believe in the value of the Underlying Security, is a limited upside if he's right; unlimited downside risk if he's wrong. He may end up with a debt he can never repay. (Paging Dr. Faustus…)
For all that is in the world, the lust of the flesh and the lust of the eyes and the pride of life, is not of the Father but is of the world. And the world passes away, and the lust of it, but he who does the will of God abides forever. [1 John 2:16-17]
Stefan Jovanovich generalizes:
One of my favorite pulp fiction moments is in Joss Whedon's Serenity. The preacher, who like many godly men has had a great deal of experience with his own capacity for evil, is dying. Mal, the atheist hero, calls for medical help and tries to reassure the preacher that he will live to preach many more sermons to Mal's skeptical ears. The preacher is having none of it; with his dying breath he replies, "Don't matter what you believe. Just believe in something." I am afraid I share the preacher's hopelessly ecumenical notions of gospel. Belief in the magic of markets, chess, checkers, one's friends, something is the necessary precondition for humility and humility (not passivity) is the necessary precondition for wisdom. The survivors I have known do not necessarily believe in God but they do believe in "something" greater than themselves. They did their best and kept at it - all the while accepting that what happened to them was never entirely under their own control. Or, as the philosopher said after banging his thumb with the hammer, "it happens."
Nigel Davies tries to get back on subject:
 This got me thinking about how one should survive in chess and markets. I'm not sure these should be treated in quite the same way as both stakes and sample size are very different. In Gonzales's examples there is a sample of one person in a one-off situation, so luck will be at a premium. As such it may be difficult to separate this out from genuine skills.
In markets too there is a lot of luck.
Turning to chess one can find excellent advise on 'defending difficult positons' from both Lasker ('Lasker's Manual of Chess') and Keres ('The Art of the Middlegame'). Very briefly, Lasker suggests having no weakest point in one's position whilst Keres advises that one should make the opponent's win as hard as possible rather than focusing on counterattack. I think these are both very useful, but there is another dimension which I think is important.
The ability to keep one's position afloat when things go wrong is a function of the earlier disposition of one's forces. So players who proceed in an aggressive and taut style find it very difficult to change this disposition when things start to go wrong. Firstly their forces may be committed to attack, and secondly they may have compromised other parts of their position in a belief that the attack will win.
It's noteworthy that many of the greatest master's of defence (for example Lasker, Capablanca, Korchnoi, Karpov, Kramnik) haven't usually played for the maximum in the opening, looking instead for a certain harmony and balance in their positions. Their games have an unpretentious feel, very few weaknesses and balanced forces.
Chess masters are not noted for their humility but years of experience can teach them how to create balance intuitively. Will reading about it help? I don't think so. And it may even be damaging by providing false confidence or theories which haven't been tested by pain.
Sep
7
Evidence of Regime Change, from Kim Zussman
September 7, 2008 | 2 Comments
Remember February 27, 2007? That day's return (SPY, close-to-close) was almost -4% (supposedly catalyzed by a panic in China's stock market).
It has been 385 trading days since that day. Here are the statistics for daily returns for the 385 days since 2/27/2007, and the 385 days prior (excluding 2/27/2007 itself):

A down market since then (losing 2 basis points a day versus making 5 bp), as well as notable changes in skew and kurtosis. And standard deviation is almost twice as big. The 2/27/2007 move of -0.039 was 6.2 stdev from the mean of the prior 385 days, whereas it was only 3.4 stdev from the mean of the 385 days following.
Sep
1
The Two Year Effect, from Hans Martin Aannestad
September 1, 2008 | 3 Comments
Any thoughts on the paper "The Two-Year Effect" by Graham Bornholt ?
This paper identifies a puzzling form of predictability in U.S. stock market portfolios. For the value weighted market index, those years that follow a low return two years earlier have an average return 11.6% higher than those years that follow a high return two years earlier. The difference in returns is economically and statistically significant.
Vic and Laurel reply:
Let us say it does not come as a complete surprise; the strong negative correlation between the current year return and the return two years back is mentioned in our book Practical Speculation on pages 210-211. See in particular Table 9.2 on Page 211,

We invite the submission of relevant analyses.
Kim Zussman follows up:
Using SP500 (w/o dividends) I checked Dec-Dec returns 1950-07 for years coming 2 years after down years (the year after the year after a down year). Comparing these with all yearly returns for the series showed them to be higher, but the difference is not statistically significant:

Phil McDonnell expresses skepticism:
One way to test for a two year negative correlation is to calculate a correlation coefficient with a lag of 24 months. For S&P adjusted [monthly] returns from 1950 to 2005 we get the following correlations at the various monthly lags from 18 months to 33 months:

Note that the correlation at 24 months is actually +1.55% which does not support the idea of a negative correlation at two years. However overall most of the monthly correlations are negative in the 18 month to 33 month range. Another indication of how weak any effect may be is that none of the correlations rise to the level of 5% significance. Given that there are 16 chances we might expect that at least one would be significant by chance alone.
Dr. McDonnell is the author of Optimal Portfolio Modeling, Wiley, 2008
Alex Castaldo replies:
I thought we were discussing yearly returns, not monthly. You lost me somewhere.
Aug
31
Speed and Longevity, from Victor Niederhoffer
August 31, 2008 | Leave a Comment
 I have come across several conflicting ideas about the relation of speed and longevity recently. In Eric Sloane, the idea is that the slowest animals live the longest, but several studies show that that the fastest runners live the longest. I wonder how this would be resolved in the real world of markets. Speed and distance, and lifespan would seem to be helpful concepts to untwine.
Dylan Distasio adds:
Typically, larger animals have longer natural lifespans. This is likely related to their lower base metabolic rates (a smaller mammal is going to have a faster metabolism to offset greater loss of body heat). The most obvious analogy would be market cap and the idea that larger companies are slower to shift course.
Another factor is how prodigious the species is at reproducing. High fecundity usually means a shorter lifespan. Is there an analogy to this in the markets? If we use our imaginations, perhaps. Maybe an area of the market with many competitive companies, and a low barrier for entry like the Internet space.
For those who are gluttons for punishment, there is scientific journal article on body size, metabolism and lifespan that may be worth untangling.
Scott Brooks recalls:
I saw a special on either Discovery Channel about heart rate. They did a comparison between many animals and the number of heart beats they had in a lifetime. The one that stick out in my mind was the difference between some kind of mouse and an elephant. The difference in life expectancy was quite substantial in terms of years, but the average number of total heart beats between birth and death was essentially equal.
This didn't hold up for all species, but there were some striking similarities between mammalian species and heart beats.
If this is true, then am I using up my "lifetime heartbeats" each time I work out?
I know that my family doesn't live particularly long, with most dying at or near average life expectancy. I also know that for my entire life, my resting heart rate has been in the upper 80s or low 90s. I've worked diligently to get it lower, but it doesn't come down. When I exercise, I get my heart rate up into the 160s or 170s — if I'm really working our hard, then I'll get it up into the 180s or 190s.
Am I using up my heartbeats?
Marion Dreyfus reassures:
When I worked for the giant ad agency J Walter Thompson, the physican onstaff, with whom I consulted about all of my copy, used to tell me: "I have grown old walking in the funeral corteges of those more fit than I."
Kim Zussman, on the other hand, enjoys frightening people:
Don't forget, the healthier your heart (and the longer you go without heart attack) — the more likely you are to die of cancer.
Low fat diet, exercise, contol of blood pressure/blood sugar, have much bigger effect in forestalling heart disease than cancer.
Aug
27
The Most Amazing Thing, from Victor Niederhoffer
August 27, 2008 | 7 Comments
The most amazing thing about markets to me is that no matter how many previous instances I have, I can never find days that are anywhere near the ones we are currently having. The S&P is moving from x day highs to y day lows with impunity and alacrity and then hanging on the balance scale at the end of day when Zeus decides who will win.
Peter Earle replies:
I remember reading a book several years ago about Roger Bannister and his breaking of the four minute mile in 1954. At the time there were any number of physicians who predicted that the record was physically impossible to break; one predicted that Bannister's heart would explode in accomplishing such a feat.
I was reminded of this in both watching (and hearing) that, once again, in a seemingly inexorable march of highs (and lows), world records were broken throughout the Olympics in Beijing.
It bears mentioning that the events themselves have changed greatly from year to year: not only in the rise of professional Olympians, undistracted from a training (indeed, a living) regimen by employment, formal education or social duties, but as well in the structure of the events themselves. Engineered swimsuits, deeper pools, vacated end lanes, and other such changes in swimming events alone have contributed to the aforementioned increase of extremes.
So too, in the markets: that the year-over-year outdoing of previous records in extremes have as much, if not more, to do with the character, fragmentation and specialization of market venues; the "democratization" of access to various markets, bringing millions of additional opinions and hundreds of billions more dollars in; the rise of electronic, in particular algorithmic trading; better/faster processing speeds in technology; and the like, ad infinitum — than of any intrinsic quality of markets.
Kim Zussman ponders:
Like global warming, it is hard to measure whether the market becomes progressively and durably more efficient, or just temporarily stations in an efficient regime. Presumably the proportion of outperforming trader/investors who persist over long periods must go down if markets get more efficient, but that number ought to be hard to get, in that widespread knowledge could discourage the hopeful machine.
Anatoly Veltman adds:
I'll give you another factoid: TY (10-y Treasury futures) lost 10% of Open Interest on the Fri, Aug 22 drop. We just found out that FV (5-y Treasury futures) gained almost 10% of Open Interest in Tue, Aug 26 slow trade. Any connection to the recent abandonment of 10-y as the benchmark?
Aug
25
What is Art?, from Scott Brooks
August 25, 2008 | 18 Comments
I have never gotten art. I can't determine what is and isn't a great work of art, or even define what constitutes a great work of art.
Kim Zussman replies:
Scott, in my experience art is very personal communication - between the artist and the viewer, and between the viewers.
Yes, there is much scholarship on the subject: what was innovative, what changed the world. But good pieces talk if you listen carefully. And great pieces will never leave you.
Even modern art.
For example, take this web site's favorite subject of barbecue: There have been many descriptions of delicious smoked ribs, dripping sausages, saucy pulled pork. When you savor this food, you taste something of the life and the love of the cooks - as well as friends who find it important enough to recommend. A common experience, which feels unique, and pre-dates you by thousands of years and will continue to live beyond.
Isn't it wonderful to share food loved by all? That's art - because it is talking to you - and many others. You are connected to past and future. It talks without words and within it you speak loud in silence. If you cannot hear then you are not listening or it is not talking.
Beautiful women are art. Yes, they are up to something, and indeed they are programmed functionaries. But if her flashing eyes unsettle you, or the fine hair on her arm or the particular curve of her breast, this is art (as well they know). That they don't realize the extent of their role is art.
Even not-beautiful women are art. Sometimes the best kind of art.
Art debilitates. And it's funny.
We cannot seek it - it will come for us. And raise us up, by the neck for just long enough to allow the taste of life and the understanding that others can taste it too.
Aug
18
WSJ Calls Inside Buyers Ignorant, from Steve Ellison
August 18, 2008 | 2 Comments
 Throughout Wall Street history, insiders have earned superior returns on purchases and sales of their companies' stocks. H. Neyjat Seyhun wrote a book in 1998, "Investment Intelligence from Insider Trading", detailing an exhaustive study of insider transactions. Seyhun found that stocks in which insiders were net buyers outperformed stocks in which insiders were net sellers by an average of 8% in the following 12 months.
The Wall Street Journal is well aware of this outperformance and regularly reports on insider transactions. I was quite surprised, therefore, by today's Heard on the Street column. David Reilly suggests that investors would be foolish to follow the lead of financial company executives, whose net purchases of their companies' shares in July were the highest in 10 years.
Excerpt : [subscription required for link to full article].
"Company executives clearly have better information than the average investor. But it doesn't always pay to follow their buying cues.
Like plenty of other investors, executives at financial firms haven't been good at calling bottoms during the credit crunch. In the third quarter of 2007, executives and directors of diversified financial companies — brokers, big banks and exchange operators, among others — bought more stock in their own companies than at any other time since the third quarter of 2002, according to data from Gradient Analytics.
The trade didn't work. The third quarter of 2007 was anything but the bottom for financial stocks …
Today, financial executives are back buying. Since the end of June, the value of purchases, when compared with share sales, has reached its highest level in a decade."
Kim Zussman replies:
It would seem difficult to believe in changing cycles (dissipation of knowable patterns), and not suspect that insider buying has been gamed - by insiders who are informed of the literature and seek (for not unselfish reasons) to align with shareholder objectives.
Whether Seyhun's alpha persists will be answered in time, but like others which are well-known, expect it to run through a period of great disfavor before flying again.
Victor Niederhoffer comments:
It's ridiculous to assume that because in one quarter insiders were wrong, this disproves studies based on hundreds of thousands of trades. Of course it doesn't work, some quarters — like the beaten favorite Federer: that's when he's going to win the doubles for sure.
[Dr. Niederhoffer is the author of "Predictive and Statistical Properties of Insider Trading", The Journal of Law and Economics XI (April 1968): 35-53.]
Aug
11
More Thoughts on Stops, from Jim Sogi
August 11, 2008 | 13 Comments
 The use of fixed mechanical resting stops seems to be an admission of inability to trade your way out of a paper bag. It is also an admission you are undercapitalized. It is one thing to realize you were wrong. It is another thing to give up on the bottom tick.
Isn't it better to trade your way out of a bad situation rather than give more of your money to the opposition in defeat? It is a harmful mechanical crutch. It is better to watch for a better opportunity to exit with some grace. It is better to know the market, and know yourself.
Larry Williams objects:
What if you cannot exit with grace — market goes limit down 10 days? No way to trade your way out of that…
Stops prevent failures and allow one to regulate the size of the loss.
I'm talking trading here; not investing… value investors buy and hold until value changes or overall market gives a sell, that seems to be best strategy.
Shui Kage adds:
The old Japanese market proverb: "Mikiri senryō".
"To ditch a small loss is worth a thousand ryō" (In today's language: is worth one million dollars).
Most amateurs are unable to take losses at small size and most amateurs are not very good traders.
Phil McDonnell dissents:
 If the market goes limit down (or up) against you then stops will not help either. The stops will not be executed. In that case only proper position sizing in the beginning or an option hedge will protect your position. There is no guarantee a stop will be executed at your price or anywhere near your price in the event of a gap open.
There is no theoretical basis that stops should work either. I have written about this here on numerous occasions. Thus the best advice is to back test, taking stops into account explicitly. When testing stops one should use great care to increae the assumptions regarding slippage. Invariably stops will be hit during fast markets when slippage is the greatest. Compare that to a back test without the stops. If the test using stops gives a superior overall risk reward profile then it is reasonable to use stops. One should never think of stops as the sole money management technique because of the slippage and gap issues discussed above. Rather stops are more of a trading tool to reshape your risk reward profile.
There is another reason to consider stops and that is psychological. Many of us are simply unable to pull the trigger when we get into a losing situation. Suppose you had a trading model that predicted that tomorrow would be up by the close. The obvious way to trade that would be to get in and get out by the close tomorrow. But if your system was wrong (and they all are sometimes) then you may find yourself holding the position simply unable to admit the loss and freezing on the trigger. It is easy to come up with all sorts of rationalizations for this behavior. "The drift will bail me out" might be one. Suddenly your plan has changed from a one day trade to hold it for ten years until the long term drift bails me out. So if you find yourself doing this too often then having a preset stop may be the psychological crutch you need to be successful. Better than that, of course, might be to simply write your plan down and execute it as planned.
Dr. McDonnell is the author of Optimal Portfolio Modeling, Wiley, 2008
Janice Dorn adds:
 I would add to this that placement of stops is both art and science. It is among the most difficult concepts for a trader to grasp, and there is more confusion surrounding stops than almost any other aspect of trading. How often do we hear: “They see my stops” or “There is clear stop-running going on” or something similar re: stops. That is why when I trade ( not invest), I use multiple contracts, keep taking profits and trailing stops ( on a good trade) and get out as quickly as possible when the trade is not going right for me. Also, I am prepared to lose on a certain percentage of all trades per my trading plan. I used to hate and could not accept getting “stopped out” but now accept it as part of the cost of doing business.
Also, it is very challenging for most traders to “stop out” and then get back in again. Part of the reason for this is inexperience, and the other part is the way that losses are seen by the brain. Losses are weighed about 2.5 times as heavily as gains. This means that if you are down 10% on one position and up 10% on another position, you are break even on paper, but are down 25% in your brain. There is a complex process that goes on inside the brain of the trader that is looking at losses. But that is another topic and I have already digressed from the “stops” thread.
Dr. Dorn is the author of Personal Responsibility: The Power of You, Gorman, 2008
Jeremy Smith tries for the final word:
Everyone uses stops.
Some put them in immediately.
Some keep them stored in gray matter for later deployment.
Some wait for the margin call.
Kim Zussman exclaims:
 "Say uncle!"
If you trade less than 100% of your investable capital, that is a stop.
If you trade predominantly the capital of others, that is a stop.
If you let the account blow up without borrowing against your home or retirement accounts, or hitting up friends/family, that is a stop.
If you decide to trade small enough to preserve your marriage, sanity, or life, that is a stop.
Even the Kamikaze had stops.
Nigel Davies suggests extending the discussion:
What about broadening this discussion still further to include the 'reverse-stop', ie a profit target? I don't see much difference between the two from a conceptual point of view, the issue here being psychological (one represents a loss, the other a win).
Can one be ideologically opposed to stops without also being unable to take a profit? I don't see how we can discuss one without the other and they all come under the category of 'planned exits'.
Jul
28
Do Secular Bull/Bear Markets Exist? from Kim Zussman
July 28, 2008 | Leave a Comment
 Using DJIA historical weekly closes since 1930, I checked for dates when weekly closes were a new 500 week high (i.e., approx. 10 years). Plotting these vs date shows two periods when 500W highs clustered (50-65 and 82-99), and two gaps in which 500W highs rarely (or never) occur (65-82, 99-06).
This is all retrospective but it is possibly supportive of the theory that bull and bear market durations are comparable to investment-lifespan (eg. memory of living investors).
Jul
10
Entry in Subprime Song Contest, from Kim Zussman
July 10, 2008 | 1 Comment
They used to tell me I was building a dream - and so I followed the mob,
When there was earth to grade, or nails to drive, I'd borrow for the job.
They used to tell me I was building a dream, with peace and glory we led,
Why should I now be standing in line, foreclosure just ahead?
Once I built a credit-line, made it run, buying time.
Once I built a credit-line; now it's done. Brother, can we spare sub-prime?
Once I built a McMansion, up to the sun, stucco, sticks..sublime;
Once I built a tower, now it's done. Brother, can we spare sub-prime?
Once in khaki shorts, gee we looked swell,
Full of that Yankee Doodly Dum,
Who'd a thought it dumb!
Say, don't you remember, they called me Mort; Mort I paid - all the time.
Why don't you remember, I'm your pal? Buddy, can we spare sub-prime?
"Brother, Can You Spare a Dime", lyrics by Yip Harburg, music by Jay Gorney (1931)
George Parkanyi adds:
I have another entry!
Sung to the tune of the Beatles’ Yellow Submarine …
In the town, where I was born,
Lived a man, who failed to see
The basic flaw, of going long
Asset-backed securities.
And so he bought, a mighty tranche
Of CDOs he thought secure
From triple A, it slowly dawns
That what he bought, but cow manure
all together now …
We all hold a ton of hollow sub-prime liens,
Hollow sub-prime liens
Hollow sub-prime liens
We all hold a ton of hollow sub-prime liens,
Hollow sub-prime liens
Hollow sub-prime liens
Now we watch, quite nervously
A fast imploding S&P
And we wonder, do we still have
A functioning economy
We all hold a ton of hollow sub-prime liens,
Hollow sub-prime liens
Hollow sub-prime liens
We all hold a ton of hollow sub-prime liens,
Hollow sub-prime liens
Hollow sub-prime liens
(repeat and fade)
Jul
8
Bear (as in Stearns) Markets, from Kim Zussman
July 8, 2008 | Leave a Comment
One way to think of sell-offs is as an attempt to locate and test fixed stops of different kinds. The BSC affair was one; when it was learned that a "too big to fail" failing financial (actually too big to let fail) was handled by the Fed and another financial. Similar tests occurred in January, in order to find out how much Ben cared about the stock market.
Both tests occurred around the level the SP500 is at now, and there could be attempts to bring it lower to find out what happens should other financials go under (eg, WM, WB, LEH ) - with or without government intervention. Or to bring in an "orthogonal" test of an asset related to other systemic problems, such as GM.
Jul
7
A real-estate agent shared some data on the local housing market over the past year, including listing price, sale price, days on market, and selling agent commission. He posed this question:
Commissions are paid by the seller to the listing agent and the selling agent (the agent that brings the buyer). Selling agent commissions range from 2.5% - 3%. The seller selects which commission rate he wishes to pay. Which yields the best result for the seller? My hunch is the higher commission (for many reasons), but I would like to see if the data supports my hunch.
To look at results for the seller, I was interested in DOM (Days on Market), and how much below the listing price the actual sale transacted - a variable I called "discount":
discount = [(listing price)-(sale price)] / (listing price)
In the data I noticed that there were other commissions besides 2.5 and 3.0%. When including these outliers, the analysis was messy - so since there weren't many I threw out all but exactly 2.5% and 3.0% selling agent commission data. Here is a test comparing the mean DOM for sales commission of 2.5 and 3.0%:
Two-Sample T-Test and CI: DOM_1, Commission 1_1
Two-sample T for DOM_1
Commission 1_1 N Mean StDev SE Mean
0.025 398 90.4 73.3 3.7 T=2.08
0.030 164 78.5 56.3 4.4
Those paying sales commission of 2.5% stayed on market an average of 90 days, whereas those who paid 3% stayed on 78, and the difference was statistically significant. Evidently the agent worked harder!
However the discount (drop in price from listing to selling) went the other way:
Two-Sample T-Test and CI: Disc_1, Commission 1_1
Two-sample T for Disc_1
Commission N Mean StDev SE Mean
0.025 398 0.0453 0.0467 0.0023 T=-1.34
0.030 164 0.0513 0.0488 0.0038
The sellers paying the higher commission also had to take about 0.5% more discount from listing to selling price (though not quite statistically significant). This, of course, is made worse for the seller because the commission was also higher by 0.5% - so you could say that the net was really 1% worse including the higher commission.
Taken together it looks like the higher commission for selling agent incentivizes him to close the sale faster, though at a slightly worse price for the seller.
Capitalism works!
Jun
28
Bear Market Sighted, from Kim Zussman
June 28, 2008 | 5 Comments
A nice, clear definition: "a bear market is a 20 percent drop from an all-time high." We'll know when we've had one. Nigel Davies.
Like we used to ask, what about numbers on the table?
Using DJIA 1950-2008 monthly data (skipping the Depression because it can't happen again), a bear was defined as this month's close < 20% below the high of any of the prior 24 months. Comparing the mean return of months following bear months with all months in the series shows they are actually higher - though not significantly:

Note that at least some of the insignificance is stemming from the higher volatility of 'after bear market' months:

The higher volatility is quite statistically significant.
—–
Speaking of numbers on the table, here's a reminder to budding real estate moguls just how pricey bubbles can get Homeowner offers her house and her 'love' for sale
Jun
22
Spectrum of S&P Closes, from Kim Zussman
June 22, 2008 | 1 Comment
When excited properly gases emit radiation at specific wavelengths, because electron transitions to lower energy levels is quantized. This is seen well as emission lines on spectra.
If stock prices were attracted to round numbers, in terms of frequency one might expect to see something like a spectral pattern. For example, the count of daily closing prices in SP500 should be higher around round numbers. A dot-plot (like a histogram with dots) was used to check for round-clustering using daily SPY closes multipled by 10 (to replicate the actual SP500 index number). This particular dot plot tallies up to 7 observations per dot, and each column represents a bin of 20 SP500 points (eg, "1000" is all daily closes from 990 to 1010)
A dot plot of 10X SPY does not appear to show clustering around the "hundreds" (900, 1000, etc) in S&P 500.
Jun
12
Alpha Optimism, from Kim Zussman
June 12, 2008 | 5 Comments
It's notable that many of the wealthiest investors are optimistic. But not all of them are, and certainly pessimism pays well from time to time.
Assuming there is a payoff to optimism, what if Penn's Dr Seligman (optimism can be learned) is wrong, and optimism/pessimism is - like many personality traits - genetically determined and rather immutable? Inherently optimistic investors get the rewards of their fortuitous place in time, when they are fortunate to be placed in times of fortune.
Dr Goulston's recent post about personality types suggests there must be studies on which personalities are suited to trading financial markets, and which not. There are lots of these tests - you can take one (such as this Myers-Briggs type test) and then ask whether your successes and failures were predetermined.
In any case, haircuts never go out of style, they just change in type (remember the old song by Crosby Stills Nash and Young).
Riz Din adds:
My optimism is partly a function of recent documentaries watched, but it looks to this layman that even if mankind is only equally as clever as they have been in recent years, then the gains to humanity will be breath-taking as the digital revolution becomes all encompassing.
Instead of observing incremental changes in technology lets remind ourselves of the state of the world a just few decades ago. Thinking back, I remember adding a 32k ram extension on to my ZX Spectrum. Today, you can pick up an 8GB portable thumbdrive for under GBP 10. I won't try and calculate the gains that have taken place, but I'm pretty sure that if progress simply continues as is, the world is going to be a very interesting place. As the digital world widens and reaches into other fields such as genetics, and perhaps even energy technologies, these fields will reap the benefits of rapidly increasing processing power and depreciation that ensures wide affordability. I can't wait to see what innovations emerge in coming years.
Esteemed former intern Jan-Petter Janssen (NEPS '06) writes in:
If you define optimism as the tendency to overestimate the probability of favorable outcomes, it is clearly irrational and should be avoided. However, it is a good antidote to another unwanted bias; the propensity to suffer mentally from losses more than you benefit from gains (a la Kahneman-Tversky.) [The latter may not be irrational, but is clearly not a good way to think for a successful-to-be speculator.]
A (too?) much used tool in finance is to compare the utility you gain from a certain outcome versus the expected utility if you choose to take risk. I will apply this to a social setting all guys have to (or had to for the lucky ones) deal with: Should you ask the most beautiful girl out for a date? A Kahneman-Tversky mindset would suggest no action too often because of the fear of rejection. Optimism has the opposite effect of course.
More generally I believe optimists choose action (i.e. risk) over inaction (i.e. status quo) more often than pessimists. And from my own experiences; it's the losses, humiliations and embarrassments that in retrospect have made me fight back and grow … while much success, although good, sometimes lead to hubris and a personal bubble to burst. The bottom line is that action is usually better than inaction. So triumph of the optimists!
Vic observes:
There has been a most unusual clustering of big minima in the S&P recently. Naturally this clustering has been followed and coterminous with all sorts of negative news. Those who are short have not been reluctant to discuss their positions before the close in interviews. The word "ideal" comes to mind.
Jun
5
Valuing Yourself as a Business, from Kim Zussman
June 5, 2008 | Leave a Comment
 Stefan's recent post on his business reminded me of some recent ones about yields on investment and how to value a business.
If someone sold you a business for $1 million which over time averaged income of $70,000 per year, with some years much higher, some lower, and many losing quite a bit, you might wonder if you overpaid. That's the stock market, which is probably better considered an investment - not a business. A business is a system where the proprietor can have some large direct effect on outcome (income), and ostensibly be compensated for personal abilities and effort.
To a great extent, each person is a business; with various assets, liabilities, capacities, and reserve capital, as well as capitalization of barriers to access. Perhaps successful traders are rare because they compete in a system with few barriers to access (no degrees or licenses needed), and irregularly dispersed severe reward/punishment which restricts long term success to supernatural intellects and/or stomach for pain. By definition no obvious profitability is persistent, and by correlation few can adjust to an unstable reward/punishment schema.
Yet there are the undeniable attractions of heroic market figures, who bravely took huge risks to finance their opinions of the world, and got it right. Walter Mitty, had there been an Internet, might have hoped to make a fortune trading markets (while keeping his desk job).
If trading, what becomes of those attributes beyond using an iron gut to second guess a random system? A trader with people skills, charm, or good looks squanders these normally valuable assets yoked to the torture machine all day. There are lots of folks who make very good stable incomes, if for no other reason than that humans are social animals who will pay to feel better.
There seems no shortage of causes behind the data showing that a very small fraction of traders out-perform the market long term.
May
23
Or red.
Earlier this year, traders were compensated for enduring declines with further losses. Then after a volatile March, buying or holding declines was rewarded with gains, and even the risk of holding gains was well compensated.
What is the intermediate trend? Now going down again, one question is when we will see a return to decline-momentum, and is there still compensation for betting against it.
A better question is whether the opportunity cost of fighting the beast is ever adequately compensated in the long term.
May
14
Speaking of Quitting, from Kim Zussman
May 14, 2008 | 1 Comment
(Warning: plot spoilage below……. skip if you plan to see the movie).
We rented this year's big Oscar winner "No Country for Old Men", and there was some fairly intense discussion afterwards. Pretty gritty stuff if you can cut through the Texas twang.
One theory of good art is that it locates and awakens something personal in the viewer, even if repugnant. Some of the symbols included the post-modern theme of bad defeating good (on all accounts, thoroughly), bad deeds going unpunished, good deeds not going unpunished, the role of chance in success and doom (duh), the attractive logic and invincibility of an intelligent psychopath, the religious quality of effective evil, and the crippling effect of introspection during battle.
A most interesting theme was the role of age in perception. The aging sheriff hesitated in his pursuit of a daunting foe, and commiserated with his peers about how bad things were compared to the old days. But a decrepit old friend (or relative) countered to the sheriff how his grand-uncle-lawman had been ruthlessly killed by Indians back in nineteen and zero-nine. Even though the bad guy put the sheriff into retirement, brutality in the past was as bad or worse.
The reason many think the shiny old days were better may have more to do with our own changes than those of the world. Which makes sense, since at our youngest we evolved within the protected/deterministic systems of our parents, friends, and schools (at least the fortunate ones), which continued sweetly into young adulthood because in hindsight now we know all the endings. There is no risk in the past, only the future.
Many of our days now will one day be precious in hindsight. It is difficult to keep this in mind even part of the time, but ostensibly worth the effort even if the required level of introspection forfeits many battles.
To paraphrase spec posts from 04-06, if you are on the winning side it pays never to give up.
Movie snippet here.
Stefan Jovanovich dissents:
I apologize to Kim and everyone else who loves the Coen brothers. Since my tastes are sufficiently bizarre that I rate Joss Whedon's Serenity a far better space oater than any of Lucas' Star Wars snorers, I hardly expect to win this argument; but those of us here in Chaos Manor simply don't get it. I lasted about 20 minutes with No Country; Nora, who is 23 and has far more stamina, was able to hang on to the bitter end. She said the best comparison she could offer was that it was like part in Annie Hall where Woody Allen goes to visit the crazy country folk and has his special talk up to Dwayne's bedroom - with lots of ketchup and walking down hallways added. The Coen's skillful but truly absurd splatter films are like modern war movies; the tech is magnificent, but the stories can only seem credible if you share the Coen's religious belief that violence offers some special insight into life. Clearly they are relying on the assumption that no one in the audience has any experience at all with firearms. Blowing out the chambers in a revolver to allow it to fire was an interesting bit of make believe, but by the time it got to the bit with an assassin carrying around a compressed air canister attached to a modified nail gun, I had to hold my sides to stop shaking with laughter. What was the guy going to do for reloads? Go to the Home Depot?
May
14
Housing drop
Subprime flop
Credit crunch
Belly ups
Bail outs
Fed puts
No recession
Jobs in session
GDP
Low inflation
High oil
Faked them out
Stocks up
May
13
A Trek Out West, from Kim Zussman
May 13, 2008 | Leave a Comment
A useful program for market operators includes long hikes alone in barren wilderness. On a recent 20 mile day hike in the beautiful Sespe North of Ojai, California, there were silent companions along the way.
The Sespe area has no cell-phone coverage, and one can hike for days among the black bears, deer, rattlesnakes, and coyotes without seeing other humans.
Here is the beginning of the trail early that morning, with the Piedra Blanca rock formations considered sacred by the Chumash people who used to live here.
The trail follows Sespe creek, which is a raging river during winter storms and has claimed many lives over the years, including a boy scout troop in the 1940's.
Part of the wilderness was burned in the huge Day fire a few years back, which has now regenerated and energized flora and fields of lupine, poppy, and other colors. Charred shrubs are twisted similar to to the fetal position taken by those burned alive (check your pathology book), and stand starkly against the sweet wildflower breeze:
After a very long trek, we reached the ruins of Willet campground, which was used as a way-station for equestrian pack trips.
Willet includes several shacks which are still used at night by hearty souls of many worlds.
As seen by their religious inscriptions made with flint knives late at night:
In one scorched canyon are the famous fossil remains of a trader, January Man.
Apr
26
No Uptick, from Kim Zussman
April 26, 2008 | 2 Comments
Knock knock!
Who's there?
Uptick.
Uptick who?
No Uptickrule 7/6/07
Some have suggested recent volatility may be linked to repeal of the uptick rule as of 7/6/07. Certainly volatility has been high since then, as shown by F-test comparing variance of post no-uptick with the prior period (at least in terms of SPY: stdev of cls-cls returns 93-7/5/07 vs 7/6/07-present):
Test for Equal Variances: post, pre1
95% Bonferroni confidence intervals for standard deviations
. N Lower StDev Upper
post 203 0.011560 0.012853 0.014457 (post-7/6/07)
pre1 3635 0.010327 0.010599 0.010885 (prior)
F-Test (normal distribution)
Test statistic = 1.47, p-value = 0.000
Levene's Test (any continuous distribution)
Test statistic = 18.53, p-value = 0.000
But in comparing the post-no-uptick period of 204 days to the 17 other non-overlapping 204 day periods since 2004, the recent period is not that unusual (see attachment: 1=post uptick, with 95CI for variances), and it would be hard to argue much beyond partial causation.
Apr
22
Smoothing the Range, from Kim Zussman
April 22, 2008 | Leave a Comment
To the extent which moving averages may convey information, there might be a better way to model the decay of investor (emotional) memory decay. Presumably t mattered more than t-1, which mattered more than t-3.
Many biological processes scale logarithmically, so here is an lnMA of daily range which weights each day less by ln(countback) (here for n days). r = range = SPY (H-L)/C:
nD lnMA = {r[0]/ln(2)+r[-1]/ln(3)+….r[-n]/ln(n)}/n
The most recent day's range (r[0]) is scaled by ln(2) to avoid the divide by zero problem.
Attached is simple 10d MA for SPY daily range, vs 10d ln MA, vs 1/10000 SPY close (I used 1/10000 to put it on same scale).
Apr
19
Epiphytes, from Victor Niederhoffer
April 19, 2008 | 3 Comments
 There were all sorts of records in stocks and bonds last week with stocks having their sixth best week in history, and bonds having their 10th worst week. Strangely, only once before have stocks moved up and bonds down this much, the week of March 21 2003, when bonds were down 4.5 points and stocks up 54. Because of the small number of observations the expectations next week for the events singly or in combination are not meaningful.
In retrospect, this was a natural result of the increased liquidity provided by the Central Banks. They were able to get the stock market up, but in the process they raised the specter of inflation again and commodities went through the roof and interest rates had a climactic increase. Thus, the bond vigilantes came to the fore again and forced the Fed to trot out their higher ups to say they are very concerned now about inflation, this coming of course after the 3% rally in stocks so as not to hurt the market too much.
The key event in the climactic moves had to be the big brokerage house bail out. It always seems that the destruction of a big institution is the key to renewed success in the market. It was that way with the big commodities firm, the big Nobel Prize fixed-income fund, and also the big banks and brokerages of the past including Barings in two events separated by 100 years.
The epyphytes like the orchids find it much easier to get to the light after the leaves of a tree have fallen, and they can grow quickly since they don't have to waste their energy in growing support structures of their own . Think of the countless businesses and opportunities for making money that will come now that all the weak assets have been, or are in the process of being, withdrawn from the asset pool.
The same thing happens when Walmart enters a town. A few slow-moving competitors like Kmart might find their business depressed, and the local hardware store might find that many of its customers prefer the lower prices Walmart offers. But these lower prices lead to increased spending and new businesses arise that quickly fill the vacuum.
Such can be expected in the next several years in the stock market, until the weight of the epiphytes is so large that the limb breaks.
Bill Craft adds:
Spanish Moss, a southern epiphyte enjoys a shaded environment whilst dangling from trees within the shaded canopy. Tillandsia usneoides are bromeliads, related to Pineapple.
Contemplating the dangling plumes of graybeard(s) on a recent trip, I could see the colony living off structure created by tall, towering trees intersecting the mists that provide life giving nutrients.
The support and sustenance offered here rhymes.
Steve Ellison expands:
A corollary might be that, when interest rates rise and credit is restricted, and a big institution has not yet failed, markets will behave in very unexpected ways in order to locate the vulnerable institutions and force them to liquidate at distress prices. As Damon Runyon said, "One of these days in your travels, a guy is going to come up to you and show you a nice brand-new deck of cards on which the seal is not yet broken, and this guy is going to offer to bet you that he can make the Jack of Spades jump out of the deck and squirt cider in your ear. But, son, do not bet this man, for as sure as you are standing there, you are going to end up with an earful of cider."
As an example, Goldman Sachs said that the results of pairs trades in August 2007 were 25 standard deviations away from historical averages. The market was doing its best to find someone vulnerable.
Stefan Jovanovich objects:
The line quoted is not from Damon Runyan's Idyll of Miss Sarah Brown but from the screenplay for the movie of Guys and Dolls. The credit should go to Jo Swerling and Abe Burrows who wrote the book for the musical and Joseph L. Mankiewicz and Ben Hecht who reworked the musical into a movie.
Kim Zussman drifts off subject:
Here are some fortune cookies appropriate to these difficult times:
You can't know what you were trying to find until seeing it in hindsight
The thing you are looking for won't occur until you are so discouraged that you stop looking
The obvious thing is only right if you decide it is too obvious to be right
The cynical interpretation is only true when you don't act on it
Wealth and philanderosophy are the secular cousins of immortality
Apr
19
Dow Theory, from Kim Zussman
April 19, 2008 | 5 Comments
 Now with a Dow Theory buy signal hit, big up week, breakout to many week high and >100d moving average, we get a real-time test of positive momentum in stocks.
We never hit the "bear market" cutoff of -20% from the October (all time) high. Presumably they will conclude this was a nascent recession doused out by Helicopter Ben; definitely not what NBER's Feldstein was calling for. Those hoping for a big drop to buy will have to wait for another financial bail-out, which won't happen until we are back to 1500 as everyone piles in afraid to miss the rebound.
Or not.
You can pick your poison or you can pick your antidote. But you can't know the antidote for your poison.
Apr
3
Bears Galore, from Phil McDonnell
April 3, 2008 | 17 Comments
 Hedgefund monitoring service Greenwich Alternative Investments reports 58% bears on the S&P, 58% bears on the dollar and 67% bears on the 10 yr T-Notes. Sentiment is overwhelmingly negative.
Nigel Davies replies:
Seems odd that these learned gentlemen would be so bearish on both the dollar and the S&P. I would have thought there'd come a point at which a weak dollar would start to get good for exports.
Jim Joyce writes:
Sentiment stats must be tested. One can't just glibly assume they are contrarian indicators.
Victor Niederhoffer remarks:
The key to this market was when Abbey Cohen refrained from making any more bullish forecasts and it was accepted that we were in bear market by Goldman itself.
Stefan Jovanovich explains:
Measures of the current cycle need to include adjustments for the change in the value of the dollar. If those changes are included, the S&P 500 at 1374.9 is still down roughly 25% from its 12-month high on May 29th of last year and down 7% from its 3-month high at year-end. One could argue that the "bear" market is still intact — given that the S&P 500 adjusted from the value of the dollar is down 60% from its high on August 30, 2000 and up only 17.3% from its low on March 3, 2003. Comparisons with 1938 seem appropriate when looked at with this particular historical lens.
Nigel Davies agrees:
It is helpful to consider the value of assets relative to other assets rather than just the dollar. The dollar is by no means a fixed entity, though when one talks about 'bottoms' or 'tops' in assets like stocks or gold, there's an implicit assumption that it is.
J.T. Holley replies:
The dark clouds cover only the Big Apple. The dark and dirty forecasts are associated with NYC. My assumption is cutbacks, losses, write-offs, and a slowing beat of the heart of the financial world. Outside NYC, in beautiful Brentwood, TN where the buds are blooming, daffodils sprinkle the green fields, and opportunity is much appreciated, I'm as bullish as ever. It seems that far and few are remembering the drift, that bear markets exist only by looking at the rearview mirror, while one is driving forward utilizing the windshield to block the bugs and grit.
Kim Zussman reports:
Yesterday was third highest first day of month in 14 years (SPY c-c). Those >3% gain were, on average, followed by gains the rest of that month:
Apr
2
Bird Brain Solves Market Puzzle, from Kim Zussman
April 2, 2008 | 2 Comments
 Durychka our yellow parakeet (Durychka is Russian for "stupid little girl") is remarkably insightful for a small beast. She uses a 3-note song I taught her as my name; when I come home and she hears my my keys, she calls me. This bird is very attached to me, and when the Mrs hugs me she jealousy hurls herself against the bars of the cage like a desperate woman in prison.
She must know I am too big for her, but that doesn't matter because her utility is to own my intentions. It is amazing how the entire female emotional phenotype lives in a brain the size of a lentil.
Recently Durychka learned about money and friendship. Months ago I noticed she calls back to birds she hears outside, so when the weather is nice I hang her cage in the apricot tree near the patio. One day the shrub across from her happened to be loaded with berries, so there were dozens of hungry robins jumping all over the yard. Many of the wild birds came to check out the yellow girl in a cage, and she was very enthusiastic about all the attention. But the next day the bush had been picked clean, and gone were all her fat fair weather friends. Now she sat lonely in the tree, wondering how she had offended them.
Durychka has lots of toys in her cage, many with mirrors. She spends hours looking at herself - frequently pecking and licking her image. Parakeets are social birds from Australia, where they live in trees by the hundreds in close quarters. When they are solo in captivity, they appear to be executing a futile program of socialization - recognizing another bird in the mirror. Even though the feedback from the reflection must fall short of the real thing, she can't fight the hard-wired attraction.
In many ways, gambling and markets, especially volatile ones, flush out our deepest dispositions and serve as reflections of ourselves. Perhaps a hard-wired need for self-reflection explains why, if we have a medium or long-term opinion, we invite irrational solace/punishment from short-term moves which are irrelevant to the big picture. And why we come back to the mirror, again and again, as if this time something will be different.
Apr
1
Market Up Big, from Kim Zussman
April 1, 2008 | 2 Comments
I love when they cite John Wooden comebacks, or Babe Ruth's many strike-outs, or Einstein's poor school performance, as examples of perseverance after setbacks. Having used these and other irrelevant excuses, here are some for tonight's dinner with the Mrs:
Market up big (because 4/5 last similar circumstances resulted in ruin)
Market up big (but at least I'm not short)
Market up big (I knew it would, but return/risk was unfavorable)
Market up big (which is common during down-drift)
Market up big (But I saved a fortune staying out recently)
Market up big (To fete my stupidity I got you these roses)
Market up big (For your feet I got you these Jimmy Chooz)
Mar
31
Flying Without Instruments, from Kim Zussman
March 31, 2008 | 1 Comment
Second consecutive down quarter in SP500. Here are the 18 prior same instances (of UP-DN-DN-next, 1950-), which tests like most everything else lately (except short and hold):
Mar
21
1 You can't stand the sight of the screen and it gives you intestinal spasms
2 You are afraid of the open, close, and overnight
3 Friends keep telling you to get out
4 You are mean to the children (they took stats and you are average)
5 The children are afraid of Maria and Cramer
6 You can't remember feeling anything good about the market
7 You no longer enjoy anything about markets nor look forward to doing anything ever
8 The market opens and your heart sinks
9 You don't want to go out with friends or family because your results are too embarrassing
10 The market keeps making patterns that don't work until you pause trading
11 You're no longer proud of yourself, and can't recall a time when you were
12 Your jokes, which were originally amusing, are now cruel, abstract, and bipolar
Mar
20
In Like a Lion, Out Like.. A Downer Cow? from Kim Zussman
March 20, 2008 | 2 Comments
Since 1950 there were only five years when SP500 index was down all of the first three months (we getting close to six). The following Aprils didn't exactly produce golden showers (Though the last time, in 1982, did mark the beginning of the great bull run — after 16 flat years):
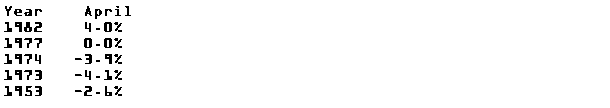
Mar
18
Now With the Recession Behind Us…, from Kim Zussman
March 18, 2008 | 2 Comments
Time for the trader psychology profile evaluation
1. Before, during, and after trades you are:
A. Anxious, miserable, regretful
B. Strapped, teetering, busted
C. Wined, rummed, beered
C. Aroused, orgasmic, disgusted
2. What do you think of when asked to define empathy?
A. "Everyone but me is wrong"
B. "I'm pithy"
C. Oskar Schindler's feeling towards cheap labor
D. Blue to the color-blind
3. Which of the following dreams do you recall?
A. You were the captain of the Titanic and you sank the iceberg with your six-shooter
B. You won the Scarlett Johannsen date on eBay and she fell in love with you.
C. Your self-doubt resulted in the permanent disappearance of your image in the mirror
D. Scientists discovered that Ptolemy was wrong because the big-bang vector run backward to the beginning of time has the locus of origin in your left frontal lobe
4. The role of the government in capital markets is:
A. To reduce standard deviation in evolution
B. To increase sexual deviation in government
C. To prod downer cows into the slaughterhouse
5. When you compare your results to others
A. Their successes are random accidents
B. Your successful accidents had clear purpose
C. Others are irrelevant because they all lie
D. You can't recall which account is the one you brag about
6. The boundary between causation and coincidence
A. Is impossible to determine
B. Is defined by your dura mater
C. Was defined at your alma mater, but you cut class
D. Your winners evidence causation, your losers are a coincidence
7. Rank the pain:
A. Short an up market
B. Long a down market
C. Missing a big movement
D. Having a big movement
Mar
17
Imminent Danger? from Steve Ellison
March 17, 2008 | 1 Comment
On January 22, 2008, after a plunge to the 1255 area while U.S. markets were closed for the Martin Luther King holiday, the (March) S&P 500 futures opened in the pit at 1262.0, which stood as the pit-traded low of the day. The close was 1309.0. Today's pit open of 1260.5 after an overnight plunge to 1255 is still the low, but appears in imminent danger of being taken out, despite a 26-point rally from the open.
Kim Zussman adds:
Soon we could have enough rallies off huge down opens to start wondering when the streak will end. Like playing chicken when you don't know that the opponent might be suicidal.
Mar
13
If We Are Up It Must Be Thursday, from James Sogi
March 13, 2008 | 2 Comments
With gold $1000, crude $111, wheat $12, EU 1.55, I wonder if Ben's free heli money is doing more harm than good. I'm all up for some free money, especially if part of it falls my way, but it seems like administering amphetamines to the sick. They perk up but their health is worse.
I really get a laugh out of the financial news. "Market down! Things looking bad!" A few hours later after a 3% up move, "Markets up!" They are sooo behind the curve it's funny.
Kim Zussman notices:
The last two Fridays were down, and in 2008 they have been bearish. Here's c-c in SPY:

Before the open is CPI, which despite $110 oil will miraculously print no inflation — and we get another Tuesday.
Mar
10
Monetary Policymaking and the Markets, from Kim Zussman
March 10, 2008 | 2 Comments
It seems the "Fed Put" is deployed strategically nowadays: see the FOMC unscheduled cut before the perilous open on 1/22, and the increased liquidity announcement on Friday before the payrolls number. One wonders whether the market is becoming conditioned to throw a tantrum to get what she wants from Daddy, and progressively spoiled and unappreciative as the gifts pile up.
Mar
6
Downward Action, from Kim Zussman
March 6, 2008 | 4 Comments
Many days recently when there was downward action, precipitated by derivative vehicles, there have been strong rallies to the close. Recalls youthful episodes of downward action, sounds of parental vehicles, followed by rallies to the clothes.
Anatoly Veltman adds:
If a month-long dollar decline has been all foreplay, can you imagine the multiple gasms in our assets about to come — not to mention households filled with crying nine months down the road.
Mar
5
The US Has a Big “Sale” Sign, from Paolo Pezzutti
March 5, 2008 | 4 Comments
 When I moved from Italy to the US last year I asked for advice about the opportunity to buy a house during my three-year tour in this beautiful country. Most of the responses were against buying and I am glad that I followed this advice. At the time, the exchange rate between Euro and US dollar was 1.28 vs the current 1.52 (almost a 19% difference). There was a house for sale in the neighborhood for 450K$. After one year, the house is still for sale, but this time at 380K$. Moreover, you have to subtract the 19% due to the more favorable exchange rate. For the equivalent of a small two-bedroom apartment in the suburbs of Rome, you can now buy a four-bedroom house here and still have 350K$ cash. This situation is not related only to the housing market, but the economy in general. The difference in price between goods and assets in the US and Europe during the past year has become impressive. Whenever I happen to fly to Europe I have some relative or friend asking me to buy and bring a new computer, telephone, videogame, golf club, article of clothing, etc. The same is true for the price of cars. But of course importing a car from the US is not so easy! The same applies to the stock market. For Europeans and for others the US has a big sale sign on the country! Sooner or later these imbalances will be resolved and markets will start working in this direction as investors will find opportunities in this new situation.
Jim Sogi adds:
Same in Hawaii, the Europeans are snapping up land like crazy. What a good deal, they say. I remember the Japanese doing the same 20 years ago. What a good deal, they said. Many of them bailed out in flames from their excesses.
Stefan Jovanovich remarks:
This is not the first time. One of the least appreciated of President Grant's many virtues was his insistence that the U.S. capital markets become completely open to foreign investment. That was his primary reason for reestablishing the gold standard for the dollar after the Civil War. During the same period J.P. Morgan & Son established its reputation as our country's preeminent investment bank by urging its European customers to exchange their francs and pounds for dollars after the Panic of 1873. When those investments proved to be stunning successes, Morgan's word became literally as good as gold as far as the bankers in Paris and London were concerned. What is truly sad is that, this time, it is the wise visitors like Paolo, not Americans themselves, who see the historic opportunity.
Bruno Ombreux adds:
Because of dollar depreciation, visitors have the purchasing power. Even if American see the buying opportunity, they don't have the purchasing power. Also it seems they are in debt, which makes it difficult to add more debt to take advantage of purchasing opportunities.
I see the purchasing opportunities also. I think I'll buy assets in the States in a couple years. It is cheap. And in the long-term, the USA will be better off than Europe.The US has a better demographic pyramid. It has a lower population density. It has the best universities in the world. Taxes are confiscatory but less than in most European countries.
It is cheaper than Europe and has a better and brighter future. This is a buy.And you are right, this is a historic opportunity. I am trying to micro-manage to time the purchase by waiting a couple years, but maybe I am too greedy.
Stefan Jovanovich replies:
American non-financial corporations certainly have the ability. They have become self-funding, even for capital expansions. They have less dependence on debt markets and banks than they have had in a generation. But their managements seem to be taking their inspiration from Sewell Avery instead of Sam Walton in terms of their confidence about the country's future prospects.
Bruno Ombreux explains:
The US and Europe have different perceptions of history. In the US, the traumatic experience was the Great Depression. In Europe, it was the Weimar hyperinflation which led to the rise of Hitler which led to the horror of WW2. The purpose of the EU is to avoid another WW2. That was the founding principle of its predecessor the EEC. The purpose of the ECB is to avoid another Weimar. European are ready to take it on the chin and suffer a lot to avoid any repeat of Weimar or WW2. In the 1990s the French experienced two recessions for the sake of Europe. First they absorbed part of the cost of German reunification through imported deflation. Then they cut spending to meet the Maastricht treaty obligations, while due to low growth they should have run an expansionary fiscal policy. They'll do it again. The German will do it too. Everybody will do it. The rest is posturing in the context of negotiations between goverments, as well as trying to influence the ECB. The ECB is not like the Fed. The ECB has only one mandate. It is price stability. It is very precise: CPI right below 2%. The Fed has two mandates, price stability and economic growth. I never understood why, because there is a macroenomic theorem that you need to have as many policy tools as economic targets. If you you want to control inflation for instance, you need only one tool, that is either monetary or fiscal policy. If you you want to control inflation and growth, you need two tools, that is monetary and fiscal policy. That is the case if the Fed and the government are coordinating actions as they seem to be doing. But then it means the Fed is not independent. You can't control inflation and growth and the currency. Something has to give. The job of the ECB is much easier.
Paolo Pezzutti extends:
The risk in investing in US assets is not related to the value of the assets in US dollars. For example, buying the depressed and daily hit by bad news financials in the long term is something that will work out to be profitable. The financial system is the engine of the US economy. It simply cannot fail and eventually will recover from its excesses. The question mark lies with the exchange rate between euro and US dollar, which could really impact overall performance as it has done in the past years. However, we are at a point of excessive difference in the purchasing power. For example, if you check on Amazon for book prices or on other sites for electronics, such as iPods or Nintendo, you will notice that they sell an item for 100 Euro on one of the Atlantic and for 100$ in the US, which is quite impressive.
Kim Zussman replies:
What happened to no-arbitrage theory? A 40 year old student converts his Euros to dollars, buys iPods in the US, and sells them for Euros back home. Same with real estate. Sells his Amsterdam flat, converts to dollars, and buys a beach house in Venice, California. True, ganja is only legal in CA by prescription — but a 50 Euro visit to Dr Pheelgut fixes that.
Mar
3
Trendfollowing, from Jim Sogi
March 3, 2008 | Leave a Comment
 Jurists look for precedent or similarities in factual situations. Traders might use the same type of analysis rather than purely statistical numbers by looking at the context of the situations in which similar facts took place. Yesterday was the fifth consecutive gap down, today the sixth, and the third or fourth straight down day. This combo only occurred before in the bear market of 2000-20002. A year back I noticed that the facts seemed to fit the 2000 high volatility period. With this acceleration down and other recent days, I'm seeing patterns that happened in the big bear market of 2002. Last few days saw breaks to the downside from consolidation areas. I don't recall seeing this action for last few years either. Granted last week we had breaks to the upside. The number of this type of occurrences are too few to be robust in any manner statistically, but for context it is interesting to consider. Is trendfollowing in the equities going to make a come back?
A few weeks back I read C*vel's trend following book and wrote an as-yet-unposted critical review, but have reconsidered. I was critical of C*vel's uncritical use of only two simplistic examples of trendfollowing systems. I was critical of trendfollowing in general and of C*vel's insinuation that beginner traders might use it to make money. Trendfollowing must have had its cycles before, like maybe 20 years ago. It hasn't worked so well in the last 10 years or so. But I wonder if these cycles are coming back. How long has it been since you took a break out/down entry? We haven't seen a 20 day high or low for a while now, but it will be interesting which way it will go. Failure or trend? I kind of doubt trendfollowing (in equities anyway) will return in a big way, but its good to pose the question.
Kim Zussman notes:
The S&P close today was near the point last Friday before the 23 point Ambac skyrocket. Shortly thereafter a question was raised about over-anticipation and symmetry between up and down over-reactions.
This week's answer looks to have taken five trading days, with several surges on bad news thrown in to test the gut. I noted one headline: Wall Street dives on Ambac rescue doubts.
Gut, gut, That magical organ
The more you trade
The more a sore one
Vincent Andres notes:
Jim wrote that "jurists look for precedent or similarities in factual situations." As an algorithm, this way of reasoning is sometimes called "case-based reasoning," and has multiple applications.
Feb
27
Aphorisms, from Alan Millhone
February 27, 2008 | 4 Comments
"Liars figure, but figures don't lie" was one of my late father's favorite expressions. Just saw that the median home price has fallen 4% in the past three years and new home sales are the slowest in nearly 13 years. I suspect OPEC will announce the same production levels and gasoline prices will go up another dime till it reaches $4.00 a gallon at the pumps. Also I notice a lot of carpetbaggers are crawling out of the woodwork offering to 'help' those who are losing their homes. With the influx of tourists pouring into the USA with empty suitcases, the Euro might become a secondary currency in America. Our Dollar is of little value in most of the world. My favorite saying? "In G-d We Trust, all others pay cash."
Kim Zussman extends:
All big declines start as small declines
Most small declines are reversed
Most small declines are reversed
Except the ones you buy
Most big advances test neutral
Except the ones you hold, which reverse
Stocks drift upward over long periods
Except those in which you have overplus to invest
Declining periods are shorter than advancing periods
But when you focus on your P&L time stands still
Free markets work best
But not without the Fed put
Human capital is the best investment
Outside of commodities
Stocks and real estate are the best investments
Until you notice how well they do
Bull markets start the moment you decide never to invest in stocks
Success in what matters scales inversely to IQ and directly with charm
If you aren't laughing at yourself then you don't get the joke
Unlike women, chicken is unappetizing when anatomically correct
Trading success is the vector sum of {thorough research}+{strict discipline} in positive luck-space
Bald people would give anything for hair
Hairy people will do anything to get rich
Rich people will pay anything for love
Love is the main cause of hair loss
Feb
19
Housing, from Kim Zussman
February 19, 2008 | 1 Comment
Robert Shiller's site contains historic data on house prices from 1890-2007. Notwithstanding any biases contained therein, I checked the rolling 10-year real house price appreciation and found that the 10 years ending 2006 and 2007 were the highest. Here are the top 10: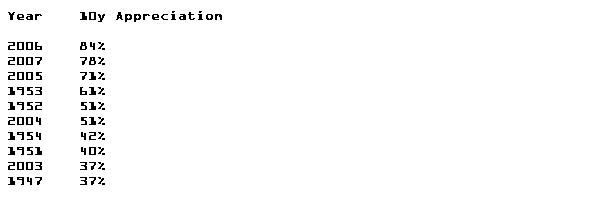
Feb
12
Buy & Hold, Long Term Returns and All That, from Kim Zussman
February 12, 2008 | 4 Comments
In checking historical US stock returns, the probability of loss declines as the holding period increases. Twenty years is commonly touted as safe, but there have only been 4 such (non-overlapping) periods since the Depression so it's hard to feel secure.
(There is also the problem of whether this came by "luck": e.g., look what happened to German and Japanese markets when they lost WWII)
There were four non-overlapping 238 month (2 short of 20 years) periods in DJIA monthly returns 1928-2008. The compounded return of these (w/o div) shows only one which was down (with ending dates):
Date 20Y cpfactor
2/1/2008 5.994
4/4/1988 2.264
6/3/1968 4.941
8/2/1948 0.721
(Dividends formerly a bigger part of total return, so exclusion under-estimates final compounded return)
Randomly re-ordering the same empirical monthly returns into 100 simulated 80 year series, I calculated compounded 238 month returns and checked for up and down periods. Of the 400 simulated 238 month periods, 47/400 were declines (12%). This is about half as often as actually occurred, suggesting that the negative market momentum around the Depression may not have occurred as result of random ordering of monthly returns.
Kevin Bryant counters:
In the grand span of economic history, 100 years of stock market data is barely a drop in the bucket. This is why I derive little comfort from this kind of analysis particularly during the current period which is quickly proving to be well outside normative experience.
Kim Zussman replies:
Just because long-term stock returns are positive, it doesn't mean they continue into the future, but begs the question whether there are better indicators than history. And a related but very different question is the feasibility of deploying insights/leverage to beat buy-and-hold without increased risk of ruin.
That 3 out of 4 twenty year periods in stocks since 1928 were up should make young people with 401K's feel better, but seems dangerously irrelevant for day traders using leverage.
Riz Din adds:
'In checking historical US stock returns, the probability of loss declines as the holding period increases.' - Kim
My favourite chart to illustrate this important point is Figure 76 in Chapter 7 of the Barclay's Equity-Gilt Study. Limited observations, international examples, and changing times provide good reason to be cautious, but it is all to easy to get lost in the month-to-month or year-to-year volatility and lose track of the extent to which downside risk (negative real returns) have rapidly disappeared over time. Indeed, when looking at the UK data (1899-2005) the study finds that 'For holding periods of five years or longer, the incidence of losses greater than 5% or 10% is the same for equities and gilts.'
Over the long haul, the real returns to UK assets have been 5.3% for equities, 1.1% for gilts and 1.0% for cash. For the US since 1925, the numbers are 7.1%, 2.3% and 0.7% respectively.
To quote Christopher Walken in Wedding Crashers: "We have no way of knowing what lays ahead for us in the future. All we can do is use the information at hand to make the best decision possible."
Phil McDonnell writes:
 There can be no guarantee that history will repeat.
Those words, in one form or another, are found in virtually every prospectus ever offered by the financial industry. The main reason is that they are true. There really is no guarantee. But to the speculator the real question is how should one bet?
The converse of the history repeats proposition is that it does not repeat. Should one bet on something that has never happened before? Clearly betting on something which has happened frequently in the past is the better choice than something which has not happened. The best of all worlds is to combine a frequentist approach based on counting, tempered with a modicum of judgment and reason based on any changes in the contemporaneous financial landscape.
J.T. Holley comments:
I couldn't agree more, the art w/ the science. I've often thought in reference to Monsieur Le Cygne Noir why one would bet with such conviction on Sisyphus not to roll the rock up the hill, but furthermore that the rock wouldn't come right back down for ole' Sis to push it back up again? It wouldn't take me too long watchin' that rock n roll to place a bet, I'd be there taken the scrapes from those that thought otherwise as well, but not denying them their fair attempt.
Jim Sogi concludes:
The proper questions to ask are: How are things changing, and how does the trading strategy need to evolve to adapt. A dogmatic approach will not lead to good analysis and will lead to mistakes. Things are changing from the 2003-06 regime.
1. Volatility is up.
2. Global influences are greater
3. Governmental influences are increasing.
4. The industry is consolidating and shifting to electronic.
Time series sample selection in data becomes more important since last year. The idea of regimes being helpful in cycle analysis.
Feb
3
Le Rogue Trader, from Kim Zussman
February 3, 2008 | 4 Comments
Could our French colleagues comment on these aspects of the Affaire Kerviel:
1. Unappreciated low level trader from humble background
2. Big bank known for sophisticated derivative Quant trading by golden boys from elite technical/math universities
3. Gamed the system by hacking compliance and creating false offsetting trades and deceptive emails
4. Industrious - actually skipping holidays in a country which is a holiday
5. Courageously trading OPM through huge swings, at times extremely profitable, in mere hopes of a bigger bonus
6. Bank chose its best trader to unwind into a multi-week market bottom: Waiting 2 weeks could have again been highly profitable
7. He will be lionized in France, where they appreciate when the rich are victimized. (Come to think of it, there will be a place for him on Hillary's cabinet)
Bruno Ombreux replies:
Regarding Point 2. Actually, they are not sophisticated. The secret to equity derivatives is having a good marketing department and a good sales force. Some of the stuff Jerome Kerviel was hedging, the things called turbos or clicquet options , are mass-marketed equity derivatives designed to part innocent retail investors from their money. With good salesmen, one parts "sophisticated" pension and hedge funds from their money just as easily, except the sale is not done in the mass media but by building relationships with invitations to industry functions and over glasses of champagne.
Serendipitously, I am reading "The complete arbitrage deskbook" from Stephane Reverre, who happened to be head of index arbitrage and quantitative trading in the Tokyo and NY offices of Socgen. Obviously, he is describing activities he learned at Socgen. They are very basic. Nothing sophisticated. They just require a lot of money and good execution. Good salesmen are really helpful here again, for instance in the equity loan market.
Jan
31
Hero Trading, from Kim Zussman
January 31, 2008 | Leave a Comment
He hoped to be a hero
One day atop the hill
Surviving all the bullets
Expert at the kill
.
But then one day he noticed
How they all try and die
The sacrifice was futile
Objective was a lie
.
The experts at the killing
Drop them one and all
Friend, foe, and family
One by one they fall
.
Until the hill is barren
Adobe red with blood
The hero stands alone there
Above the boiling mud
.
The lady sits in waiting
A dark and empty home
Her face the mirror changing
Her hair pulled in the comb
.
Her gallant lads are fighting
A war without an end
Will it be reversing
Or is this now a trend
.
All the men who loved her
soldiers through and through
Killed in the great battle
Wet skin all grey and blue
.
He couldn't be a killer
And didn't run too fast
They noticed he was thinking
So saved his shot for last
.
His final thoughts ran from him
Fanning into space
The last thing he would ever see
Was her lovely face
Jan
20
Risk Control in Trading, from Kim Zussman
January 20, 2008 | 5 Comments
In light of current market behaviour, what are some ideas on risk control? Someone is going to say Optimal F, or related, but here I was more thinking about what you do when flying by the seat of pants as always.
You can reduce risk by:
1. Staying out of market more (always?)
2. Setting stops (which get triggered right before huge rallies and increase probability of losses)
3. Trading small (too small to ever recoup losses)
4. Staying in only for prescribed short intervals (ensuring the miss of the rally a day later)
Ken Smith replies:
 I once concluded I should take the first option suggested by Dr. Zussman: stay out.
My idea was if I cannot predict then do not trade. But I often fool myself, thinking myself a magician, prognosticator of great moment. Under the sway of this illusion/delusion, I do not stay out and frequently prove myself wrong.
But the problem is I am frequently right. The balance between right and wrong has played out on the positive side for some time now.
You should know I do not have money to trade. I am advising without compensation, under a tacit marital contract. So when I am wrong I suffer emotionally more than if this coin of the market were out of my own pocket.
I suppose those knowledgeable about psychology, behaviorism, that sort of thing, will recognize this pattern as typical of some concept developed by the profession.
For me it means I have to risk going into the fog under steam and do so without radar, only a whistle blow to sound out what's ahead. Primitive tool.
George Parkanyi writes:
 According to Ken Fisher, the first 2/3 of bear markets are relatively mild. Typically the last 1/3 (about 6-8 months generally) is the brutal bit. If you think this is a bear market, we have approximately 12-18 months to go, with the worst yet to come. But is it a bear market? The nature of Dr. Zussman's question suggests uncertainty. If his anxiety has increased, then a good rule-of-thumb is reduce exposure (position sizes) until something more compelling, or some clarity, presents itself. He can always scale back up if the market suddenly starts going his way. No matter what the conditions, certain fundamentals and the tape should offer a few tradeable ideas in either direction. I think the risk-mitigation strategy should be whatever his methodology generally calls for. If his risk management approach is contingent on the type of market that he is in, by definition he's going to have to market-time successfully all the time or run the risk of a large hit. Best to have one consistent risk management approach for all seasons.
Jan
17
Naked City, from Kim Zussman
January 17, 2008 | 1 Comment
 As a boy on the south side of Chicago in the early 60s, mom would take me along on her shopping trips. We lived near 87th street, which had a nice Jewel market, banks, the dry cleaners, and White Castle. There was also Gordon's dress shop.
She only took me there a few times, but at 6 or 7 I recall interest in the smartly dressed mannequins. These maids smiled jauntily beneath their tipped caps in tight short skirts, and eventually the temptation was too much. It was a shameful moment when mom pulled me from beneath the plastic woman's skirt. "What are you doing!?" I didn't have the courage to answer that I just wanted a look. (Now I wonder how many times the sales girl thought about this).
A few years later there was a show on television, "Naked City." It came on pretty late, just before bedtime. I tried to stay up to watch, because I found the hope in the title irresistible. Unfortunately, it was about droll gangster stuff, and usually I fell asleep unrequited on the couch.
In 1966 we moved to California, near Van Nuys in the San Fernando Valley. Near our apartment was the grand Van Nuys Drive-In Theatre, with a mural of a cowgirl smiling down. It was great. Dad would hand the gateman a wad of bills for the carload, then we would park on a little incline next to a sound-speaker which he clipped securely to our open window. There was a snack shop at the center, which sold hot dogs, soda, and popcorn, and even at that age I noticed all the pimply teenagers out without parents. Why were they here?
Mom and dad would sit in the back seat, and my brothers and I were put in front to see better. But by then they were beginning to show nudity in films, and though we were at a family rated feature, the preview had a few glimpses of (gulp) bouncing bare breasted ladies! Mom shrieked, and reached up to cover my eyes. "Outrageous!" she cried, clawing me in the process. There was an argument with dad about her reaction, and I wasn't pleased either. The sense of it was I needed to be saved for greater things (parents can be egotists).
They are all gone many years now; mom, dad, and the drive-in. I Thought about them lately when, now and then, especially recently, I couldn't resist a look at the futures platform. The more I look, the stronger the irresistible draw to pull the trigger and… buy… sell… do something. Almost always, the wrong thing. "Outrageous!"
Sometimes I wish mom were still in the back seat.
Jan
5
Stock-Picking, from Kim Zussman
January 5, 2008 | Leave a Comment
 You can make the case that stock picking is actually market timing: There are entry and exit times for any stock which are profitable, were they knowable in advance. Another version of this is that even for a "bad stock" with lots of trading volume (eg, C, WM, CFC, SLM, AMD), there were investors who bought and sold (or — cough — sold then bought) at profitable times. It is hard to pick stocks (buy and sell points), with expectation of profits or beating some benchmark, because thousands of your betters have superior information, research, and reasoning. Timing based on cash flow? Valuation? Relative strength? Debt? Patent pipeline? They all work sometimes, but how many (including big fund managers with best resources, e.g. Bill Miller) beat the index year after year over time?
Furthermore, its hard to capture the "free lunch" of diversification (away of idiosyncratic risk) with fewer than dozens of stocks — and then how to follow them all sufficiently to time them? The meal seems to me to be use of leverage to time signatures of immutable human weakness; which winds up asking whether the fear/panic reaction is written deeper in the collective mind than it is in yours.
Tom DeBolske replies:
I saw on CNBC the other day that the best hedge fund managers on the planet are right only 58% of the time. I don't see that my "betters" with their "superior information, research, and reasoning" have that significant an advantage. We all make our stock picks using whatever method we are comfortable with. With any stock at any time it's a 50:50 proposition. The trick to stock picking is to keep your losses to a minimum while letting the winners run.
Vitaliy N. Katsenelson writes:
In my book book Active Value Investing: Making Money in Range-Bound Markets I argue the long-term (10 + years) secular trend of the market will be essentially flat. However, it will likely comprise a lot of small bull, bear and range-bound markets. I argue that timing the market (at least for fundamental investors) is a fruitless exercise. Instead, time (price or value) individual stocks. I provide a Quality, Valuation, Growth (QVG) framework. Quality and Growth dimensions of analysis help you to identify good companies, and cheap valuation will make this good company a good stock. Yes, time stocks. Identify a couple hundred good companies (Q and G dimensions), buy them when they turn into good stocks (all QVG dimensions line up), sell them when them they stop being good stocks (Q and/or G dimensions deteriorate or stock reaches fair-value point — V is not there any longer).
Jan
5
WW1: Experiences of an English Soldier
This blog is made up of transcripts of Harry Lamin's letters from the first World War. The letters will be posted exactly 90 years after they were written. To find out Harry's fate, follow the blog!
Jan
4
At 1444, from Kim Zussman
January 4, 2008 | Leave a Comment
At 1444
Recession the fore
A bull without class
A bull on his a–
At 1444
At 1444
Real estate a bore
They bought sub-prime
Now it's a crime
At 1444
At 1444
The Fed ran out of more
They dropped the rate
Too little too late
At 1444
At 1444
ISM fell to the floor
Factories no make
Again a fake
At 1444
At 1444
Labor evens score?
Not enough jobs
Tape bomb again lobs
To 1444
David Lamb adds:
The 4s remind me of a grave marker in Tombstone, AZ:

Dec
31
Parenting, a query from Nigel Davies
December 31, 2007 | 2 Comments
 Noticing that my son (age 5) was not particularly assertive (e.g. if another kid took a toy he was playing with, he just cried) I decided to embark on argument training. The problem is that in this attempt at rounding I seem to have been rather too successful, and now he argues about everything. And that includes some chess positions, even though he can't play. He's also started memorialising examples of his being assertive in "folk tales," which need to be repeated several times a day. For example there was the time a 2 year old tried to take his plane in Pizza Hut…
I'm starting to wonder if the best someone can really do is to try to improve himself whilst just spending time with his kids, with no particular goal in mind?
Jim Sogi suggests:
One, no matter what, always let the child know that you love him, even when he fails or is bad.
Second, especially ages 2-8, be consistent with rewards and punishments. Don't spoil the child, but guide him with firm rules. He will be happier for it in the long run. I see so many parents unwittingly training their children to be spoiled brats, and they both end up miserable. After that, its almost too late. Manners and etiquette should be a part of the program.
See Living with Children by Gerald Patterson for specifics.
Kim Zussman remarks:
How to raise happy, well rounded kids? That's easy: stay married.
Mom and dad need to transcend herd psycoidology insisting that happiness-entitlement derives from the continuous hunt for new itches to scratch. If this doesn't resonate, go to church. Then, when your kids grow up happier and well adjusted, mom and dad will be happy as well.
At a Bar Mitzvah yesterday, the rabbi and new man discussed at length the reluctant leadership of Moses on his way to Exodus, as well as themes of peace, forgiveness, avoiding war, etc. Ironically 80% of the audience had been divorced, and the audience included numerous young people with various parent/step-parent complexes. So much for Ashkenazi IQ.
Russ Humbert writes:
 Watching a dog raising pups, you will see that the adults are pacifist during the first weeks. The pups can cause all manner of pain and annoyance, and both the male and female dog will take it all without any aggression. Then, once they are old enough to understand, comes the discipline. They are taught to understand hierarchy of the pack. They are also taught to become top dog you must fight. This shows us several things about ourselves that many modern parents ignore.
In a society that is becoming less and less hierarchical in nature and more team oriented, less discipline is needed, but more proper peer pressure. And, governmental attempts to ban corporal punishment by parents is doomed to failure. Like prohibition, the war on drugs, and sexual abstinence. When you go against the brain's natural response, the police lose. Anyone who has been close to the foster care system in this nation, knows first hand how dismal this failure is likely to be all at the expense of the most innocent, the child.
I would suggest that in raising a child one must consider his innate strengths and weaknesses in deciding how much of team player/hierarchical structure he needs. But also one must consider that most parents simple follow the "team" approach because it is popular.
In other words, teach a child to stick up for himself, but draw the line when he disrespects you.
Scott Brooks follows up:
Unless there is something biologically wrong with a child, there is no reason for that child to become depressed and miserable if he is raised to be happy and find joy in life. Becoming "genius-like" I believe is far more about nurturing than biology. Sure, biology helps, but the right environment is far more important. A good environment can make a kid, whereas a bad environment can break him, even if has the grey matter necessary to become a genius. Training your children how to think is the key. Not just how to think about intellectual endeavours, but how to think about philosophical and emotional endeavours.
Being happy is a choice. Having a good attitude is a choice. Being smart is a choice. I was beaten down in school because they thought I wasn't very smart. They wanted to put me in special school, but my mom wouldn't let them. But I was always raised with a belief system that my life was my choice. When I went away to college, I decided to make a fresh start, since no one knew me. I played the role of the smart guy and — surprise — I was smart and got good grades. I credit all that to my upbringing: being taught to be happy, find joy, to look on the bright side and always believe that good things would happen. I "got smart" as a result of that.
Jeff Sasmor recounts:
I let my kids (girls, 14 & 16) mostly do what they want as long as they keep up good grades. When they don't I hire tutors. As a result one has an A average and the other B+ with no nagging from me. About the only exception is that I never let them fall behind in math. They have had unfettered and unmonitored Internet access since they were each about 5 or 6.
I let them explore what they want to do and I don't push them in any direction; rather, I think it's more appropriate to encourage them in what they appear to be interested in. One has become a really quite good writer. The other has self-taught herself to become a good artist and is starting a band with some friends.
They should explore while they are able; most adults do not have that luxury once they have to pay rent. They do have friends whose lives are scripted to strict schedules of sport and other activities. I don't understand this sort of parental behaviour, but then I don't understand many things that involve people's minds.
Dec
31
Futures Volatility on the Hour, from Kim Zussman
December 31, 2007 | Leave a Comment
Just as many traders could be attracted to trading at round numbers, so might they be inclined to open or close trades at or near the clock-hour mark. It seems possible that increased trading on the hour could effect volatility. As a check on this, looked at range in the 10 minutes centered on each clock hour (ES 1/07-12/07), and compared with the 10 minutes prior (which was not on the hour).
Range in this case defined as [max(high)] - [min(low)] within the period +/- 5 minutes of the hour for continuous futures prices. Used paired t-test to compare the peri-hour range to the range of 10 min prior (adjusting for local market volatility by comparing to adjacent range, tests whether difference is not zero). This test showed no difference between on the hour and pre-hour range:
 An additional test comparing variance of hour range and pre hour range showed no difference:
 OK, that was boring. However it was interesting to compare mean range (around the hour) for the different hours of the day-session. The mean range was significantly higher at 10:00 NY time, and lower at 12:00 and 13:00, than the global mean range.
Jim Sogi adds:
Financial Markets Tick by Tick, edited by Pierre Lequeux, has some studies of this nature on various markets which are in the same vein. Mornings and closes have the highest volumes and volatility, with midday being lower on both measures.
Dec
21
Testing a Market Prediction, from Kim Zussman
December 21, 2007 | 3 Comments
Vitaliy N. Katsenelson, CFA wrote: "Over last two hundred years every secular bull market was followed by a range-bound market.". Test this and discuss your results.
There are a number of ways to test this, but here is a first look:
SP500 1950-present (monthly) was used to calculate Dec-Dec returns (w/o dividends), as well as check for intra-month high and low. The intra-month high and low for Jan-Dec were used to find annual high and low, and the annual range was defined as [(max monthly high)/(min monthly low)]-1
Annual range for the series ranged from 0.10 (1993) to 0.66 (1974); 2007 is 0.16
First, what effect do last year's range and return have on this year's return?
Regression Analysis: nxt yr rt versus yr ret, yr range
The regression equation is nxt yr rt = 0.0537 - 0.069 yr ret + 0.151 yr range
Predictor Coef SE Coef T P VIF
Constant 0.0536 0.0551 0.97 0.335
yr ret -0.0691 0.1361 -0.51 0.614 1.0
yr range 0.1510 0.1782 0.85 0.400 1.0
S = 0.165498 R-Sq = 1.8% R-Sq(adj) = 0.0%
Durbin-Watson statistic = 1.92818
Both annual return and range have insignificant effect on the following calendar year's return (though there is positive correlation with range and negative with return).
Second. What is the effect of last year's return on this year's range? Here is regression of this year's range vs last year's return (ie, does last year's return predict whether this year has big or small range?):
Regression Analysis: this range versus last yr rt
The regression equation is this range = 0.303 - 0.292 last yr rt
Predictor Coef SE Coef T P
Constant 0.3030 0.0179 16.87 0.000
last yr rt -0.2921 0.0959 -3.04 0.004
S = 0.116678 R-Sq = 14.9% R-Sq(adj) = 13.3%
Sure seems to be predictive and in the hypothesized direction, but is the correlation due to prior years which are down or up? Ran another regression: Dependent var = this year's range, IV's are last year's return if up (otherwise zero), and last year's return if down (otherwise zero):
Regression Analysis: this range versus last up, last dn
The regression equation is this range = 0.241 + 0.023 last up - 0.982 last dn
Predictor Coef SE Coef T P VIF
Constant 0.2411 0.0281 8.57 0.000
last up 0.0229 0.1457 0.16 0.876 1.4
last dn -0.9822 0.2659 -3.69 0.001 1.4
S = 0.110013 R-Sq = 25.7% R-Sq(adj) = 22.9%
Durbin-Watson statistic = 1.88298
The effect stems from prior years which were down. So you can't say that this year will be range-bound if last year was up big, but you can say that if this year was down - the bigger the decline the larger next year's range will be. (Actually you can say whatever you want because Putin is not running here).
Conclusion. Since declines and high volatility tend to come together, and volatility clusters, it makes sense that big down years are followed by large range years. A more correct restatement of the original hypothesis would be: large secular bear markets are followed by wide ranging markets.
Vitaliy Katsenelson writes in:
Kim took the following phrase and tested it: Vitaliy N. Katsenelson, CFA wrote: "Over last 200 years every secular bull market was followed by a range-bound market."
I understand the desire to test things, but it is also important to test the RIGHT things. My book is written about secular markets, not minute, hourly, weekly, monthly, or even yearly (if you choose to look from a single time perspective) markets. Kim tested something that has no relevance to my book.
Dec
16
Single Dad Syndrome, from Kim Zussman
December 16, 2007 | 1 Comment
 In the checkout at Blockbuster a few days ago, a thirtysomething man with daughters in tow was ahead. There was no ring, and the kid scanned his key-chain barcode card and looked down while saying there was a $24 balance on the account. Dad shuffled around a bit and told the clerk he would come back later, then gathered his daughters and left without the evening's movie.
The girls looked a bit puzzled, but they were still young enough to revere him and didn't question as they skipped gayly ahead. Maybe he would read to them this night. Probably television.
Once you recognize the syndrome, you see them often at family restaurants and theatres on the weekends. They are a secret society — the living dead of the hormone wars. Shepherds of the gene-product ransom extracted from ageing stallions of all species.
Ken Smith remarks:
About single dads.. Last day or so Comcast News had piece about a school teacher in Florida, heavily in debt, behind in child support, harrassed by lawyers and court officials, with two children, and former wife living with a woman.
Stresses were too much for him. He could not think his way out of despair, out of debt, out of his relationships; could not get relief from court system, could not get sympathy from ex-wife, relief from her demands.
He was at a dead end as a single dad. Made adecision — shot two kids, shot wife, shot her roommate, shot himself — all dead.
His problems were resolved by violence. We spend billions in social programs in this country and yet things like this occur.
Stefan Jovanovich explains:
The billions "we" spend on social programs are not spent on the poor or the needy but on the nice, middle-class children who are credentialed helpers. It is leaf-raking in the park for the offspring of the "educated". No wonder most Americans trust the military far more than any other bureaucracy. Even with all the perfumed princes in the D-Ring, it is still the only place where you can get a government job without having spent a fortune on tuition first. The reason Americans are adamant about protecting Social Security and Medicare is that those are the only programs where they actually get to see the money. Everything else "we" spent somehow never quite gets to the supposed beneficiaries. Perhaps that is why the currency has said Trust in G-d. His were the only words that could be taken solely on faith.
Dec
14
Intraday Path Length, from Kim Zussman
December 14, 2007 | 1 Comment
 The usual way to quantify intraday range is some comparison of high to low. But this misses another dimension - the length of the path traveled by price, which is related to speed of the market (since o-c time is constant, for the entire session market speed = path length). For example there could be two days, between 930-415 ET (405 min), both with H-L = 20pt (ES). One goes steadily from low at open to high at close, a path length of 20 pt and rate 20pt/405m = 0.05pt/min. The other is a wild day, with a 20 pt gain followed by a 20 pt loss (net unchanged). The wild day path length is (simplifying) 40 pt, which is a rate of [20 + 20]/405 = 0.1pt/min.
Considering just the constant open-close daily period, market speed = path length (a potentially potent area of study is the reaction to market speed in short time intervals, but I will leave that for later). Exact path length would require summing tick data for each day, but for a reasonable estimate here I use 5 minute closing prices and estimate path length as sum { abs(5min moves) } for each day from 930-415. Here are the largest o-c path lengths since 1/07, along with the o-c return (ES points):
date sum_abs oc
08/16/07 233.25 24.75
08/10/07 212.50 5
11/08/07 185.25 -7.75
08/01/07 185.25 12.25
11/20/07 176.50 9.5
07/26/07 175.75 -20.75
08/09/07 173.25 -20.75
11/02/07 161.50 -2.5
07/27/07 154.50 -31.5
08/17/07 151.00 -7
10/24/07 150.25 2.75
11/09/07 148.75 -3.25
08/15/07 148.25 -15.25
12/12/07 146.00 -22
Notice the big move yesterday is only 14th longest path length YTD. Since that path length is a form of volatility, I compared o-c return with contemporaneous path length and found the usual negative correlation:
Regression Analysis: oc versus sum abs
The regression equation is
oc = 4.49 - 0.0648 sum abs
Predictor Coef SE Coef T P
Constant 4.490 1.636 2.74 0.007
sum abs -0.0648 0.019 -3.27 0.001
S = 11.7078 R-Sq = 4.3% R-Sq(adj) = 3.9%
Gibbons Burke asks:
Do you consider in this calculation the distance from the previous day's close to the current period's open? If not, then a gap day's net price path sum won't include the overnight move in the path.
Larry Williams adds:
It is not just the range and such but which side is moving the market on that path. It is clear to me the gap from last night's close to today's opening is public activity, the path from today's open to the close much more professional activity; that's the key to the numbers as I see it.
Jim Sogi remarks:
I agree with Larry, but for different reasons. Rather than just pro/public, the night session is related to the global situation and large gaps seem to be a whole new area recently developing. Yet another new different unseen cycle.
Paolo Pezzutti suggests:
There are at least two dimensions in play: one is speed, which is somehow associated with concepts such as range and volatility. Another is related to directionality. According to different combinations of these two dimensions you could build a matrix of market behavior. The areas would be:
1. volatile; directional
2. non-volatile; non-directional
3. volatile; non-directional
4. non volatile; directional
The problem is related to indicators to be used to efficiently define these areas. How you identify the borders/lines of contact between areas? This classification can be useful when trying to identify the proper tools and techniques to use in each area. What kind of indicator could one use to take into account speed? What can we use to identify directionality?
Steve Ellison responds:
In his book "Trading and Exchanges", Larry Harris identifies two types of volatility. Fundamental volatility results from changes in fundamentals. Transitory volatility results from excesses of uninformed traders who move prices away from fundamental values. Price moves caused by transitory volatility are likely to reverse as informed traders take advantage of bargain prices to buy or rich prices to sell. Price moves caused by fundamental volatility are much less likely to reverse.
A hazard for a contrarian trader is falsely assuming volatility is transitory when it is in fact fundamental. Dealers and market makers protect themselves from this risk by widening spreads when the order book is one-sided.
I propose a 2×2 matrix of the actual type of volatility and the market's perception of the type of volatility:
.                     How most market participants
.                     perceive volatility
.                     Fundamental          Transitory
Actual
type of
volatility:
.                     Price quickly        Price trends
Fundamental           establishes a        as disbelievers
.                     new equilibrium      change their
.                                          minds one by
.                                          one
.
.                     Market reverses      Price quickly
Transitory            dramatically         reverts to
.                                          previous levels
For years, the trading literature was very heavily slanted toward trend following as the road to riches, which biased many traders toward assuming any volatility was fundamental. However, with much money having been yanked from trend following funds this year, the upper right quadrant is occurring with more frequency.
Dec
13
Wide Ranges, from Victor Niederhoffer
December 13, 2007 | 1 Comment
There is much talk about how to interpret the bearish Open Market Committee announcement followed by the bullish joint injection of reserves which led to the greatest absolute value of moves ever from 2:30 to close and close to open, 85 S&P points in total.
Many will try to interpret the content, the whys and wherefores of what was done, and the timing thereof, but I am tempted to cut to the chase and say that it is the like the final blast of the fireworks, or the finale of a classical symphony, or the final minutes of a sporting event such as a bike race or basketball game or 100 yard dash, where everything hangs on the last ultimate effort.
Rather than searching for more analogies, I will go out on a limb and say it appears to be the final disruptive move, the boiling water that the frog is thrown into to get him to jump, the greatest observable difference of Fechnerian Psychology. Merely the final attempt to loosen the weak from their positions.
There's the rub. Which side is trying to loosen which? I don't know. There have been seven days in the last 12 years where, like the last two days, there has been a high to low range of more than 45 points. The range Dec 11 was 56 points, and Dec 12 was 46. The last time it happened was Jan 3, 2001, where a 46 point range was preceded by an 81. Of the seven occasions, three were followed the next day by a rise, and four by a decline.
In closing I must tip my hat to the highest up open in futures in history (on a non-holiday), 34 points yesterday, surpassed only by the 36.5 on June 2, 2000 which followed a Memorial Day holiday, and surpassing the 32 point up open on the day after the Fed first lowered the discount rate this year (August 17, 2007).
Anatoly Veltman writes:
Bernanke & Co. managed to screw up a perfectly good market — and market participants will not forgive them! Tuesday: Fed fell prey to a technical set-up in bonds, that even many an experienced chartist didn't anticipate. Wednesday: they made an elementary timing error, much easier to avoid. I can't remember the Greenspan Fed erring on intra-day timing, except maybe in the first half-year of his tenure — when he could hardly fill Paul Volker's shoes in May 1987. All Bernanke needed to do: wait with the intervention announcement until well into the trading session — not release the golden goose a half-hour before the open! The result: we just completed two high-volume stock market sessions, both opening high and dropping all day! To add to the bearish sound of it: it's also happening during futures rollover — which enabled Wednesday's close well off the low, and right below the middle of two-day range. So, what do we have piled in electronic trading books for the remainder of the week? Offers on every stock right above the market — from participants let down by the Fed, and just praying for an up-tick — so they can get out, and call it a year. Well, those who pray instead of reason usually get carried out. The market will tire of knocking into their offers — and turn down. Will there be bids right below? Bid on new front month S&P 10.00 dearer than the one in front yesterday? There could be slight mental block about that — or am I the only guy in America loving stock specials?
Kim Zussman comments:
I am not knowledgeable enough to draw a constructive analogy between markets and nature.
A (popular type of) supernova is when a star runs short on hydrogen for fusion, cools and collapses, and in a huge explosion higher order fusion occurs, creating the heavy elements essential for the formation of life (as we understand it). Typing is complicated, as is the astrophysics, but in all cases it is a catastrophic explosion which would sterilize a large local sphere. Long ago I read that if the bright star Sirius, eight light-years away, were to supernova the radiation would end life here. (Our sun is too small for this, and supposedly in four billion years will run out of hydrogen and swell up as a red giant, engulfing earth. I am not too confident there will be sapient beings around then to worry about it).
Presumably the analogy is about how destructive supernovae are seeds of new life. In markets there seem to be periodic events which destroy longs, and shorts, and then maybe new life starts. The problem is they occur with day-week-month-year timescale, and only maybe you and three other people can see these in real time — the rest of us in retrospect.
Just isolating on human affairs, I can't imagine a real-estate decline compares with war, famine, epidemics, etc.
Dec
11
Another for the 2007 History Book, from Kim Zussman
December 11, 2007 | 1 Comment
FOMC meeting day (SPY cls-cls) return for today (-2.74%) is the second-worst of all 94 FOMC days since Jan 1997. Here are the 10 worst:
FOMC Date
09/17/01 -5.2%
12/11/07 -2.7
03/20/01 -2.7
11/12/97 -2.1
12/19/00 -2.0
02/05/97 -1.9
08/13/02 -1.8
08/21/01 -1.7
09/24/02 -1.6
01/28/04 -1.1
Dec
7
Planetary Interactions, from Phil McDonnell
December 7, 2007 | Leave a Comment
 Victor and Laurel have suggested that a fruitful area for market research may lie in replicating the methods of Brahe and Kepler. Brahe scrupulously gathered very precise data though years of observations. It was left to Kepler, his student, to develop the first model. Kepler first identified planetary orbits as elliptical.
Suppose we have two planetary bodies with periods P1 and P2 respectively. A quick review of Kepler's Laws reminds us that his third law is as follows:
P1^2 / P2^2 = R1^3 / R2^3
where R1 and R2 are the semi major axes of the two bodies. It is interesting to note that there are no linear terms in the above relationship. It can be read as the ratio of the squares of the periods are equal to the ratio of the cubes of the axes.
In the markets we know that the Efficient Market Hypothesis tells us that the market price change today should have no linear correlation with the price change tomorrow. Empirically this seems to be true most of the time for most markets. However a strict interpretation of EMH says nothing about the existence of non-linear relationships.
In particular when we evaluate the squares of changes we find they are significantly correlated. The same holds for the cubes at similar lags. It is left as an exercise for the reader to calculate the magnitude and direction of such correlations. So at first blush there may be an application for Kepler's third law in the markets.
In order to see if there is any similar Keplerian relationship in daily price series the data from the table on page 121 of Education of a Speculator hardback was studied. Using the midpoints of the classes in the table the model used only the squares and cubes of change to predict the next days performance. It turns out that the fit is statistically significant. Notably there is no linear term in the model. Checking whether a linear term would help, the data showed that it would not be helpful. Although the regression model was statistically significant it was based on out of date data and would have to be redone with current data.
Michael Cook remarks:
Kepler was not a student of Brahe; he came to Brahe's observatory because Brahe had good data, continuous night by night observations of the planets. Kepler was desperate to prove that the orbits of the planets were circles, because the circle is the perfect shape, consistent with the beauty of the divine Mind. He decided to work on Mars because it seemed to be closest. After much work he realized the ellipse was a better fit. His comment: "I set out to show that the universe was based on the eternal harmony of the spheres. Instead I showed that it rests on a carthill of dung [the ellipse]."
The other beautiful law of Kepler's is that the planets sweep out equal areas in equal times.
It is also significant that all of his laws can be deduced mathematically from the inverse square law of gravitation.
Adam Robinson replies:
As I'm sure Dr. Cook realizes, the point was that the law of gravitation can be deduced from Kepler's laws, as indeed Robert Hooke (whose insights into force and inverse square relationships were at least contemporaneous with Newton's) was able to do. Newton's genius (in that regard, there were many instances of course) was in showing the equivalence of the acceleration of a falling object with the acceleration of an object in orbit.
Newton, in other words, gave the relationships a theoretic underpinning (until then Hooke's insights, along with Kepler's, were mere "curve fitting," in the literal sense of the phrase!), just as Einstein did, since numerous scientists at the time (Poincare for one) had come to similar conclusions (e.g., the Lorentz contraction), but lacked any overarching theory to explain why such phenomena had to occur.
Dr. Cook's quotation of Kepler also reveals the extent to which aesthetics can hinder the progress of theory as much as promote it.
Michael Cook responds:
Actually, I am not aware of any derivation of the inverse square law from Kepler's laws. I believe Hooke claimed to derive Kepler's laws from an inverse square law, which resulted in Newton's publishing his proof of the result. Hooke never published an actual proof — it's hard to do without calculus. Feynmann has a paper in which he does so, which I don't think he would have published it if it were already in the literature.
It is incorrect to say the law of gravitation can be deduced from Kepler's laws — Kepler's laws are descriptive, and don't by themselves imply any causal mechanism.
Adam Robinson replies:
I refer Dr. Cook to the letters between Hooke and Newton; there was much controversy between the two about who had which insights, when. Hooke's insight was more of a conjecture, not a formal "derivation" as such. Not surprisingly, of course, since Hooke's inverse square law with springs contains a surprising analogue with gravitation.
Kim Zussman writes:
 A recent Bloomberg article on Jim Simons of RenTech mentions sunspots and markets, so along with Kepler's dung [see Dr. Cook's remarks above] this must explain the beauty of markets.
Recall that sunspots (which have been observed and recorded since well before Galileo) are magnetic storms on the sun, which appear dark in contrast to the photosphere because (though they are hot) they are relatively cooler. And to the extent that there may be related effects on solar wind (solar ions flowing past the earth), radiation levels, and earth's ionosphere, and radio/satellite communications, here is a study.
Monthly average sunspot count (American, of course) 1944-2007 is available from the National Geophysical Data Center:
Regression of SP500 monthly index return vs. monthly avg sunspot count (1950-Oct 07) shows almost significant negative correlation (P=0.07):
Regression Analysis: SP CHG versus SPOT AV
The regression equation is
SP CHG = 0.0110 - 0.000052 SPOT AV
Predictor Coef SE Coef T P
Constant 0.010961 0.002534 4.33 0.000
SPOT AV -0.0000518 0.000029 -1.79 0.074
S = 0.0405916 R-Sq = 0.5% R-Sq(adj) = 0.3%
Analysis of Variance
Source DF SS MS F P
Regression 1 0.005288 0.005288 3.21 0.074
Residual Error 691 1.138548 0.001648
Total 692 1.143836
Here is a plot of monthly avg sunspots vs date, which clearly shows the 11 year solar cycle. Note that we now near a minimum (good for stocks), and regardless of Fed actions relative to the housing market, explains the recent 5 year bull market (OK the last sunspot maximum was Sept 2001, so the prediction was off by about 1.5 yr).
Eric Falkenstein remarks:
One of the keys of finance is the implication that arbitrage implies that pricing is linear in 'risk', or whatever is priced. Otherwise, you could generate arbitrage by buying bulk and selling little bits, or vice versa. It is intriguing to think that there are nonlinear relations in markets, but these necessarily imply profits, so, to the degree they exist, they must not be too obvious (please email me the exceptions!).
Dec
4
Symmetry, from Victor Niederhoffer
December 4, 2007 | 1 Comment

The symmetry of the S&P today, with the open and close at the bottom, two ascents from the mid-bottom to a round number of 1470 from 10am to 11am, and 2pm to 3:30pm, a rally from a midpoint to a high of 1472, and then closing in the last half hour, as happens so often, right at the bottom within a gnat's eyelash of the open, was quite remarkable, all within a very tame 10 point high to low range, same as yesterday, in contrast to the 30 point ranges of last week. Also remarkable was the previous run of four consecutive down Mondays followed by big up Tuesdays, in the best Frank Crossian tradition, with this Monday, the fifth big down in a row, followed by a miserable Tuesday.
Remarkable also was how the traditional pilot fish Israel and the new Israel-substitute pilot fish, Japan, had the move today in their sights.But how would you quantify all this, especially the symmetry. Is geology, architecture, chemistry, or biology the correct template? I'd be interested in readers' thoughts.
Anatoly Veltman remarks:
Symmetry: if you put up one month's hourly gold bar chart, you'll likely fall off your chair! I have been profitably trading every single wave for a month including today's, relying a lot on its symmetry. The thin (or gapping) areas tend to be repeated on the way back: those are low-volume price areas. The congestion areas also tend to repeat: those are price-volume areas. Alas, this exercise remains part of my discretionary trading — to try and quantify this, you'd probably need Jim Simons's resources!
Pitt Maner III adds:
From a geologist's perspective perhaps the best way to analyze the symmetry on display is to rotate the graph 90 degrees and pretend that it is a well (electric) log. The negative gray or dark space above the S&P line thus becomes transformed into layers of rocks. One might then interpret (if viewed as a caliper log) the market open as a "harder sandstone unit" which was followed by softer shales until another hard sandstone unit was drilled through at around 1130 AM. A bit of cyclicity on display.
In nature cyclical packages of deposited rock types that create these well log responses are sometimes related to world-wide sea level changes (e.g. coal cyclothems). It is the job of the stratigrapher to try and correlate different units on a local and global scale–somewhat analagous perhaps to trying to correlate responses in different world markets, although on entirely different timescales.
Of course knowing where you are in a geologic sequence, a depositional environment, etc. is critical to finding oil. Pattern recognition, mental visualization, imagination and interpretive experience would be useful attributes to have for finding "black gold-Texas tea".
It seems then that there would be very advanced signal processing techniques and data crunching software packages in use in the petroleum industry that might have applications useful to the financial community. The two most recognized companies in this field are Schlumberger and Halliburton. Images/examples from the Schlumberger website illustrate some of the advanced technologies in use.
Jim Sogi extends:
From the oceanographic point of view, in Hawaii this winter we hadn't had big waves for weeks, which is unusual for this time of year, but the last few days the waves have been over 15-20 feet. They start coming in waves of storm weather systems 3 or 4 days apart generated off ocean in Northern Japan. This is similar to market waves of volatility, and lulls between which seem to have a 3 or 4 day pattern to them. On a smaller scale, the waves themselves come in sets, with lulls in between. This pattern is a result of random groupings of waves overlapping from differing storms but that form a pattern of wave sets alternating big waves with lulls. December 4 was a lull in the market. November 28 was a big set wave. Last month was a big storm. The alternation in between seems to be quite sudden. Last night's Japan markets seemed to presage this morning's rise much as the storms there create our waves in Hawaii.
This post was started on December 4, and the open of December 5 shows a remarkable gap up in a rapid return to volatility after a lull.
The idea is that a regular but simple system, such as wave generation, cellular automata, and markets generate random patterns in systems, much in the same way as storms of Japan generate waves. The wave propagates at varying speeds and sizes due to normal variation then overlap and combine so as to form clusters of volatility and calmness as a regular result of the process in a pattern. This happens in markets just as in the ocean. Big Al mentioned that increased volatility creates higher correlation even in purely random sequences. The clustering phenomenon might be similar. There are a number of mathematical wave models and algorithms used by oceanographers.
Newton's studied astronomical phenomenon in Principia such as the length of time for various orbits and time to return in addition to distance. The cycle of times in waves clusters in markets is critical, as is the measure of distance.
Kim Zussman presents his findings:
Continuous SP futures 1/31/07-12/04/07 were partitioned into 15 min return segments for each "day" session (630-1315 PST). The first return was for 630-645, next 645-700…..1315. This produced 27 15 min return segments; 13 before 1000 and 13 after. Then the returns were sorted to align the equivalent first half-day segments with their mirror-images for the second half day (the first 15min aligned with the last 15 min, etc). The time segment alignments were:
645 1315
700 1300
715 1245
730 1230
745 1215
800 1200
815 1145
830 1130
845 1115
900 1100
915 1045
930 1030
945 1015
Then the two mirror-return series were checked for correlation. The idea is that symmetrical days would have high correlation between the first half day and the mirror image of the second half (picture a graph of the day creased vertically at mid-day, and folded back on itself). For 2007, the mirror-correlation ranged from -0.71 to +0.60 (mean -0.007).
It is possible that categorizing days as to mirror-correlation symmetry, and further specifying o-c up/dn, and concave up/dn could have predictive value. Here are the 10 most mirror-correlated days:
date Mirr corr
02/22/07 0.60
03/29/07 0.60
04/25/07 0.60
07/05/07 0.55
10/04/07 0.55
11/19/07 0.54
11/08/07 0.53
02/20/07 0.53
07/23/07 0.48
08/13/07 0.47
Nov
29
Half of Past Corrections Were Incorrect, from Kim Zussman
November 29, 2007 | Leave a Comment
A correction in SP 500 index (1950-07) was defined as:
As of Friday, this week's low was more than 10% below the high of any of the preceding 10 weeks, AND this was the first occurrence of such a 10% drop in 10 weeks.
There were 42 instances of such corrections since 1950, and the return for the following 5 and 10 weeks was flat:
One-Sample T: nxt5, nxt10
Test of mu = 0 vs not = 0
Variable N Mean StDev SE Mean 95% CI T P
nxt5 42 0.00079 0.06162 0.00950 (-0.01840, 0.02000) 0.08 0.934
nxt10 42 0.00395 0.08031 0.01239 (-0.02107, 0.02897) 0.32 0.751
21/42 times the next 5 weeks were positive
23/42 times the next 10 weeks were positive
Gibbons Burke adds:
Here is a graph of these results for all time frames up to t+50 (10 weeks). The peak of the bullishness occurs at the t+43 holding period relative to the event date on the 26th. The occurrence return lines are colored red or green relative to whether their return is positive or negative as of the (post-dictive) peak edge date. The thicker red and green lines are the most recent three occurrences and the most recent is the purple line, which is tracking the upper StdDev line almost exactly so far.
Kim Zussman replies:
Gibbons' interesting path diagram illustrates how traders with stops get penalized. I..e, if you stop out at -5% from initial position, you wipe out all the paths which cross -5 but go on to good profits later.
What about traders who decide to stop trading late in a good year (or greatly reduce size), to preserve year-based incentives? This is another kind of stop. Ostensibly they too are stopped out of potentially greater gains - with commensurately lower mean returns over time. And it would be interesting to speculate what effect on December is exerted by "up YTD" folks opting out and "down YTD" fellows trading furiously.
Nov
24
This Seasonal is a Turkey, from Kim Zussman
November 24, 2007 | 1 Comment
Using DJIA monthly back to 11/1928, I find that following Novembers that declined worse than -3%, subsequent Decembers are up but not statistically significant:
One-Sample T: nxt dec

Test of mu = 0 vs not = 0

Variable    N     Mean     StDev   SE Mean        95% CI            T      P

nxt dec  15  0.01799  0.06046  0.01561  (-0.0154, 0.0514)  1.15  0.268
Furthermore, regression of Dec return vs prior November IF November was down shows no correlation between the variables:
Regression Analysis: nxt dec versus DN nov

The regression equation is

nxt dec = 0.0259 + 0.144 DN nov

Predictor     Coef  SE Coef     T      P

Constant   0.0258  0.0142  1.81  0.081

DN nov      0.1440  0.2419  0.60  0.557

S = 0.0515600   R-Sq = 1.2%   R-Sq(adj) = 0.0%
When the lean on history fail
Reach for the chalice
Thy holy grail
Nov
19
Chartomatic, from Kim Zussman
November 19, 2007 | Leave a Comment
Instead of looking at charts, one way check for similarities between periods would be to regress returns of recent period against prior periods. For example, how do the 46 weekly returns of 2007 (SPY, 1/07-last week) compare against the equivalent (aligned) 1st 46 weekly returns of the prior 13 years? One would expect that years most like 2007, in terms of weekly stock returns, would be highly correlated. Here is regression of 1st 46 weeks of 2007 vs prior 13 years:
Regression Analysis: rt 07 versus rt 06, rt 05, …
The regression equation is rt 07 = 0.00101 - 0.141 rt 06 - 0.319 rt 05 - 0.200 rt 04 - 0.007 rt 03 - 0.302 rt 02 + 0.026 rt 01 + 0.042 rt 00 + 0.026 rt 99 + 0.088 rt 98 - 0.115 rt 97 +
0.015 rt 96 - 0.000 rt 95
+ 0.228 rt 94
Predictor Coef SE Coef T P VIF
Constant 0.0010 0.0039 0.26 0.796
rt 06 -0.1414 0.2369 -0.60 0.555 1.4
rt 05 -0.3189 0.2609 -1.22 0.231 1.5
rt 04 -0.1996 0.2005 -1.00 0.327 1.2
rt 03 -0.0075 0.1651 -0.05 0.964 1.4
rt 02 -0.3019 0.1229 -2.46 0.020 1.5
rt 01 0.0257 0.1169 0.22 0.828 1.6
rt 00 0.0421 0.1028 0.41 0.685 1.3
rt 99 0.0261 0.1211 0.22 0.831 1.3
rt 98 0.0884 0.1191 0.74 0.463 1.2
rt 97 -0.1148 0.1448 -0.79 0.434 1.2
rt 96 0.0146 0.1737 0.08 0.933 1.2
rt 95 -0.0001 0.3847 -0.00 1.000 1.7
rt 94 0.2276 0.2395 0.95 0.349 1.4
S = 0.0195096 R-Sq = 29.8% R-Sq(adj) = 1.3%
None of the prior 13 years is positively correlated, on a week-to-week basis. But 2002 appears to be an "anti-2007", in that equivalent weekly returns are significantly negatively correlated. Shown here plotting SPY weekly closes for 2002 and 2007 overlaid.
Nov
18
Black Friday Musings, from Vince Fulco
November 18, 2007 | 1 Comment
 One of the memes developing this year is that Black Friday is being de-emphasized at the margin. WalMart et. al. have started their promotional activities 1-3 weeks early, trying to capture the estimated reduced spend this season. Separately the Street usually gets their hands on very good customer count data from independent (industry specialist) research houses which triangulate physical counts, aggregate credit card data and check-cashing activity among other metrics. Hit up your friendly retailing analyst from one of the big shops for a better vantage point.
Jeff Sasmor adds:
The day after Thanksgiving is always interesting - there are sometimes spectacular pump/dumps in the stock market as the oodles of folks with their Ameritrade and E*TRADE accounts have nothing better to do that day than to lose money till 1 PM E.S.T.
There are also the sales, both in physical and virtual space. I don't go near any mall that day. You usually can't even get a parking space. How full will the parking lots be this year, with all the media talk of belt-tightening and consumer reticence to buy? With modern-day inventory systems, we will know the results over the weekend.
Kim Zussman presents his Thanksgiving analysis:
In recent years, the 30 days before Thanksgiving have been quite bullish (SPY 93-06):
One-Sample T: pr 30D
Test of mu = 0 vs not = 0
Variable N Mean StDev SE Mean 95% CI T P
pr 30D 14 0.04775 0.05824 0.01556 (0.01412, 0.08138) 3.07 0.009
However barring an explosive rally in the next 3 days, this year is not (assuming Weds closes about current levels); the pre-Thanksgiving 30D is about -6%. Which could make the pre-holiday period of 2007 the worst of of the prior 13 years:
Date pr 30D
11/24/2006 0.043
11/25/2005 0.081
11/26/2004 0.065
11/28/2003 0.013
11/29/2002 0.089
11/23/2001 0.053
11/24/2000 -0.032
11/26/1999 0.107
11/27/1998 0.179
11/28/1997 -0.013
11/29/1996 0.072
11/24/1995 0.036
11/25/1994 -0.031
11/26/1993 0.005
Nov
12
2x Levered Index ETFs, from Alston Mabry
November 12, 2007 | 2 Comments
 After recent discussions on the site about the levered index ETFs, I became curious as to how well these products are tracking their targets. So, using daily data for 9 Nov 2006 through 9 Nov 2007, each 1-day, 2-day, 3- , 4- , 5- , 10- , 15- and 20-day % change was calculated for both the relevant index (either S&P 500 or Nasdaq 100) and the positive and inverse ETFs.
Then the ratio of "ETF % move / index % move" was calculated. For the positive ETFs, the ratio should be ideally 2, and -2 for the inverse products. (The only tricky part is that if the index move is close to zero, the ratio can go to infinity. So, included were only x-day periods where the absolute value of the index move was at least 0.5%.)
Means and sd's were calculated for all the ratios in each x-day period. Below are the results for each of four ETFs:
length in days | mean ETF/index ratio | sd of ratios
Ticker SSO
1d 1.96 0.40
2d 1.96 0.38
3d 1.97 0.35
4d 1.99 0.28
5d 1.95 0.33
10d 1.94 0.31
15d 1.98 0.29
20d 1.97 0.30
Ticker SDS
1d -1.98 0.42
2d -1.95 0.45
3d -1.92 0.39
4d -1.97 0.35
5d -1.91 0.34
10d -1.87 0.43
15d -1.84 0.40
20d -1.81 0.42
Ticker QLD
1d 1.89 0.59
2d 1.91 0.45
3d 1.94 0.42
4d 1.98 0.36
5d 1.95 0.36
10d 1.96 0.38
15d 1.98 0.37
20d 1.99 0.53
Ticker QID
1d -1.90 0.55
2d -1.91 0.45
3d -1.89 0.47
4d -1.93 0.38
5d -1.89 0.40
10d -1.94 0.41
15d -1.95 0.32
20d -1.93 0.36
Adi Schnytzer suggests:
Looks fairly good, but a more revealing test might be to regress daily % change in the relevant index (Y) on change in the relevant ETF (X). So we have Y=a+bX and the test would be not only b=0.5 (which is what you have done) but also the joint F test, a=0 and b=1. Why? Because if a is not zero, then there is a bias in the tracking, i.e. either there is an over/under-reaction to large changes in the index or to small changes in the index depending upon the sign of a.
Kim Zussman writes:
While waiting for this week's bombs to start flying, here is regression of (daily return = [c2/c1]-1 )SSO vs SPY since inception of SSO June 2006 (including dividends):
Regression Analysis: SSO versus SPY
The regression equation is
SSO = - 0.000217 + 2.00 SPY
Predictor Coef SE Coef T P
Constant -0.00022 0.00013 -1.64 0.101
SPY 1.99573 0.01630 122.44 0.000
S = 0.00245947 R-Sq = 97.7% R-Sq(adj) = 97.7%
Analysis of Variance
Source DF SS MS F P
Regression 1 0.090682 0.090682 14991.23 0.000
Residual Error 348 0.002105 0.000006
Total 349 0.092787
Obviously a significant slope coefficient, with beta of 2. Notice however that the intercept is almost significantly negative (alpha), suggesting the ETF manufacturer is skimming something every day (probably in the prospectus). Recall that SPY is the SP500 ETF which levies its own (tiny) fee, so you are paying more for the leveraged ETF and might rather consider futures (unless you treasure your sanity).
Adi Schnytzer explains:
 What matters (in the way you have run it) is the joint F test a=0 and b=2, and I have no doubt you will be unable to reject it at any reasonable level of significance. Note also that 0.00022 is a teensy number. So it would seem that these are a good buy if one is bullish medium term and doesn't mind staying in the market. Mind you, there are those of us who got into the market just before the latest crash and so, mind or no mind, are in there till the recovery. That's the trouble with futures, unless you can pick your closing date far enough down the track.
Gordon Haave remarks:
Theoretically speaking, levered ETFs work in directional markets. That is, the constant leverage results in buying on up days and selling on down days. So, in certain market periods they work out just fine and are good short term trading vehicles.
Phil McDonnell summarizes:
There are three ways investors in leveraged ETFs incur costs. First, management fees, which are usually lower in non-leveraged ETFs, presumably because there is less juggling to do. Second, the leveraged half of the fund must pay interest at the going margin rate. Even if the fund uses futures or options the interest is implicitly built into the price of the derivative. Third, he constant leverage trap. The 2x funds are designed to give returns which are twice the daily return of the underlying. They rebalance daily, which means they sell low and buy high. In choppy markets and over multiple days this leads to slight under performance relative to the 2x benchmark. Mr. Mabry's study looked at multiple days and found this slight underperformance. In contrast, Dr. Zussman's study found a perfect 2.00 multiplier on a daily basis. That is exactly what they promise, 2x returns for the day. The negative alpha is due to the sum of all three costs above. Not to quibble with Prof. Schnytzer, but .00022 is about 5.5% per year in costs. Most of this is because of the leverage. It is either real or implied interest which must be paid.
Nov
10
Market Cycles, from Rick Foust
November 10, 2007 | Leave a Comment
 I have been refining a model of stock market emotional cycles for several years . The key phases of the model, from the long perspective:
Bottom, Relief, Distrust, Courage, Anxiety, Confidence, Hubris, Complacency, Top, Shock, Denial, Recognition, Anger, Depression, Prayer, Acceptance Bottom, Repeat.
I believe we are currently in the anxiety phase. Although fear plays a role, combined with other sentiments, in each of the phases, it is dominant in the anxiety phase. As a result, this phase is sometimes a breakpoint.
If market participants are willing and able to cross through the anxiety phase, confidence builds and the uptrend continues. If it cannot be crossed, the uptrend aborts, returning “safer levels,” shorting the cycle.
The anxiety phase is analogous to a child's losing sight of its mother, or a sailor's losing sight of land. Beyond here, there be dragons.
I refer to the series of phases prior to the anxiety phase as the recovery period, and the series of phases after the anxiety phase as the heroic period, Throughout the cycle, fear of being left out and fear of being wrong are powerful motivating factors.
The most consistent sentiment indicator is the early morning National Public Radio broadcast.
As an aside, mild fear is a more effective motivator than strong fear. If the feared outcome is too horrible, it cannot be accepted, and is either rationalized away or blocked out completely. This is sometimes discussed in advertising books.
Kim Zussman extends:
There is the same sequence in dating:
Recognition, Anxiety, Courage, Acceptance, Top, Bottom, Shock, Repeat Bottom, Relief, Confidence, Hubris, Complacency, Distrust, Denial, Anger, Depression, Prayer.
Oct
20
Weekends in October, from Kim Zussman
October 20, 2007 | 1 Comment
In honor of Friday's perilous drop, checked October Friday (Ths cls-Fri cls) and weekend (Fri cls-Mon cls) returns in SP500 index, both before and after Oct 1987. Its being 20 years since that fateful month, the post-sample is 1988-2007 and the pre-sample 1967-1986.
Here is regression of weekend vs Friday pre-1987:
The regression equation is
F-M pre = 0.00071 + 0.462 Fri pre
Predictor Coef SE Coef T P
Constant 0.0007 0.0011 0.65 0.520
Fri pre 0.4617 0.1313 3.52 0.001
S = 0.0103498 R-Sq = 12.4% R-Sq(adj) = 11.4%
Weekend strongly correlated with Fridays.
What about Octobers after 1987?
The regression equation is
F-M post = 0.00145 + 0.0333 Fri post
Predictor Coef SE Coef T P
Constant 0.0014 0.0012 1.13 0.261
Fri post 0.0333 0.0969 0.34 0.732
S = 0.0116829 R-Sq = 0.1% R-Sq(adj) = 0.0%
Poof! No more weekend effect.
As an extension on this extension, here is a check on symmetry of pre-87 weekend effect. Re-ran regression with 2 independent variables:
Fri preUP = Friday return if up, otherwise 0
Fri preDN = Friday return if down, otherwise 0
The regression equation is
F-M pre = - 0.00147 + 0.732 Fri preUP + 0.019 Fri preDN
Predictor Coef SE Coef T P
Constant -0.0015 0.0017 -0.87 0.387
Fri preUP 0.7324 0.2061 3.55 0.001
Fri preDN 0.0190 0.2922 0.06 0.948
S = 0.0102408 R-Sq = 15.3% R-Sq(adj) = 13.3%
Prior to 1987, positive weekend correlation with Friday returns arose from continuation of up Fridays (as opposed to continuation of downs).
Oct
17
Black Mondays? from Kim Zussman
October 17, 2007 | 3 Comments
Are they worried about black Mondays in October? If so, one might expect Friday returns (Thr close - Fri close) for Octobers to be lower than other months, as there would be selling to avoid down opens on Mondays.
Tested this using SPY 93-07:
Two-sample T for F cc vs oct Fri
N Mean StDev SE Mean
All Fri 742 0.0003 0.0107 0.00039 t=-2.3
Oct Fri 64 0.0039 0.0120 0.0015
No, they are not afraid to own Fridays in October. In fact October Fridays are significantly higher than all Fridays in the period.
Are October Mondays blacker than the rest (Fri cls - Mon cls)?
Two-sample T for F-M all vs oct F-m
N Mean StDev SE Mean
All F-M 672 0.0010 0.0108 0.00042 t= 0.8
Oct F-M 65 -0.0004 0.0124 0.0015
October Mondays are slightly lower than all Mondays, but not significantly.
Oct
3
Does Size Matter? from James Sogi
October 3, 2007 | 1 Comment
 Nelson Freeburg, editor of Formula Research, did some studies on asset allocation and sector models with S&P and Russell moving average crossovers that looked promising. He does some limited testing of the ideas, but unfortunately makes the error of curve-fitting to make the maximum return going forward. We know that doesn't work. He fails to test the results statistically. For these reasons I do not recommend the newsletter. He does consider maximum drawdowns and time to recovery. Too bad I didn't save my issues, as there are some thoughtful ideas to test, submitted by various money managers, including some of the more illustrious Daily Spec contributors.
Kim Zussman investigates:
The quarter ending 9/30/07 SP500 return was about +1.5% and RUT (Russel 2000 small cap) was about -3%. Usually they dance together, but this time Mrs. Small and Mr. Big pirouetted across the floor, away from each other.
Looking at index quarterly returns 3/88-9/07, what happens in the next quarter if SP500 up and RUT down?
One-Sample T: sp_1, rut_1
Test of mu = 0 vs not = 0
Variable N Mean StDev SE Mean 95% CI T P
sp_1 8 0.04919 0.08826 0.03120 (-0.02459, 0.12297) 1.58 0.159
rut_1 8 0.03954 0.11686 0.04131 (-0.05815, 0.13724) 0.96 0.370
Both up insignificantly, SP500>RUT
What about the opposite, RUT up and SP500 down? Next quarter ret:
One-Sample T: sp_2, rut_2
Test of mu = 0 vs not = 0
Variable N Mean StDev SE Mean 95% CI T P
sp_2 4 -0.04714 0.07524 0.03762 (-0.16687, 0.07258) -1.25 0.299
rut_2 4 -0.03733 0.08112 0.04056 (-0.16641, 0.09175) -0.92 0.425
Again insignificant, but this time both down, and again SP500 is the leader.
Kind of a bullish dance?
Sep
28
Trading Metaphysics, from Sushil Kedia
September 28, 2007 | 2 Comments
 What comes to be known as being unknowable may or may not be consistent with randomness, rather than, what is unknown. Let unknowns be distinct from the random lest the spirit of inquiry, scientific or even otherwise, be stifled.
Within the unknowables, there are many types of problems (for one example, those suffering data insufficiency) that are not worthy of achieving the classification of belonging to the random. By the way, why does the classification consistent with randomness carry that less worthy connotation?
It is the consistency with randomness that helps insurance companies buy risk, shop floor foremen decide that maintenance shutdown is yet not required, two surfaces are allowed to produce sufficient friction to make the value of work to be non-zero, etc. etc.
A generalized extension is that all cognitive systems including human traders and non traders are able to undertake risk and achieve when they recognize that their willingness to assume the ascertained level of risk is going to produce a draw down, a negative incursion, an unprofitable outcome etc., over a course of several such ventures consistent with randomness. Whenever there is a risk expectation inconsistent with randomness the system would stop and re-evaluate if that is rather an opportunity playing the negative system.
To be consistent with randomness is not useless but useful in specific decisions. It is more valuable than what we do not know or will not know or will not be able to know.
The negation of a negative expected outcome is the way to capture positive outcomes.
If a regression of the results of the trading activity of various participants on an information curve ranked by their seniority would produce an R square that would explain how much of that information seniority explains the trading outcome and thus help explain to those existing at the bottom of the curve that there was no randomness in the impact of information and trading.
Thus, consistent with random is a classification within the larger subset of the knowns rather than unknowns.
Therefore I would surmise that for trading as much as any other human endeavor the idea is to filter the potential impact of consistent with randomness fate and luck away, and focus on effort. Maybe this is what is implied by the saying "fortune favors the brave."
Adi Schnytzer responds:
I'm sorry, Sushil, but I don't buy it. Imagine that you knew every order that was going to be placed when the market opened today and also knew all the financial details of all the brokers and traders and market-makers. And that you knew all of the news of the world and inside info. And, further, that you had a serious computer at your disposal. I suspect that little in the way of randomality would remain. In other words, in a market, I would argue that the "error term" is basically missing variables, many of which won't ever be known to any single trader even if all are known to the aggregate of all analysts. Bottom line: get the info you can and learn really well how to analyze it.
Kim Zussman adds:
The big Wall Street firms, hedge funds, etc., have the most accurate and up-to-date research, and it's hard to imagine we can beat them at that game. But what makes it still a game is that the reaction can be quite hard to predict — even if you could know the future.
For example, Ben's 50bp cut — only now in hindsight do we get to weigh his put (about 50 S&P points). However it was also possible the market could have taken these cuts to mean the risk of unpreventable recession was higher than expected, and they sold. That the prior week was up also threw a false signal — that the market had already priced a big cut.
Perhaps panning for fear in its many disguises, even getting it right only 52% of the time, is the best place to prospect.
Sep
20
Neither Unusual or Unexpected, from Al Mabry
September 20, 2007 | Leave a Comment
I was reading an interview with Orrin Pilkey and Linda Jarvis-Pilkey, and found the following question both fascinating and relevant:
Q: You've written numerous books on coastal hazards and how we should respond to them. Why did you want to write this book about the abuse of mathematic models?
Orrin H. Pilkey and Linda Pilkey-Jarvis: For more than twenty-five years we have monitored beach nourishment projects around the United States. In order to secure federal funding and justify the enormous costs of these projects, anyone undertaking one must make a prediction of how long the sand will last on the replenished beach. The predictions are based on mathematical models that are said to be sophisticated and state of the art, and yet are consistently, dramatically wrong-always in an optimistic direction. In the rare instances when communities questioned the models after the predictions of a long healthy replenished beach clearly failed, the answer typically was that an unusual and unexpected storm caused the error. Well, the occurrence of storms at any beach is neither unusual nor unexpected. Eventually we became interested in how models were used in other fields. When you start looking into it, you find that a lot of global and local decisions are made based on modeling the environment. There are some fascinating (and discouraging) stories of model misuse and misplaced trust in models in the book.
Kim Zussman comments:
This relates to the question of "what to study?", and the fact that well-described numerical analysis can be used to convince in most arguments.
For example, say you are feeling quite bullish. At any moment, there are scores of patterns which could be described (what happened this hour, morning, day, overnight, week, month, in reference to prior periods, events, other markets, valuation metrics, etc). Since your job is convince yourself to buy, your objective/multiple-hypothesis approach combines with carpe trade'em urgency to screen up bullish-testing patterns.
Of course you may find, to your surprise, that most of the tests are bearish. In which case you can argue that the run of bearish historical results is ready to be broken.
Sep
3
Last Digit of Year, from Kim Zussman
September 3, 2007 | Leave a Comment
Using DJIA daily closes from 1930-2006, at the end of each calendar year, I found the low close of the last 125 trading days of that year, and the high close of the first 125 trading days of that year. The maximal decline was defined as:
[(min last 6mo)/(max 1st 6mo)]-1
These maximal declines could range in duration from a few days to the entire year, and were used to compare intra-year declines by last digit of calendar year. I performed a comparison using a variation of ANOVA, which compares individual means to the global mean.
Note that none of the year last digit maximal declines were significantly different from the global mean (the bar does not cross the red 0.05 alpha line). XXX7 years are lower than most, but XXX1 and XXX2 years are similar.

Aug
19
A Master, from David Lamb
August 19, 2007 | Leave a Comment
 I may be using the wrong term here but what really makes a person a "master" of something? And, what does it take to master something? I had this conversation on the golf course the other day with the other three and we came up with four different ideas. Mine was the least kind.
Does being a master mean that one is at the top of the class in a particular endeavor? Does being a master mean there is no room for improvement, that perfection has been achieved? Webster's states a master (in one of its definitions) is one being an expert at something. Can one fall from being a master, such as the Master's Championship in golf, where he is no longer the master?
Can a professional baseball player who hits .400 be called a master at his trade if he only accomplishes a 40% success ratio? Can a trader ever master the markets, at least for more than a brief moment? Perhaps a master is the person who is the best, or one of the best, at any given moment.
Kim Zussman writes:
It seems impossible to get more than a small percentage of mostly random market movements right. However even doing that does make a difference, and a critical question a trader should try to answer is whether they add any value over buy and hold. And the question should be asked under different market conditions: Bear, bull, and flat.
There are lots of ways to ask this question, but here is an example using mutual fund manager John Hussman's HSGFX. (I don't have any position, but he is interesting and runs a mutual fund with option hedges, was finance professor, and his research seems thorough, though he's been bearish for a while.) I did regressions of his weekly performance vs. SPY (both w/div) over three periods:
11/00-3/03 Bear
3/03-6/05 Bull
6/05-8/07 Recent
Actually he does pretty well. First during bear mkt 11/00-3/03:
Regression Analysis: HUSBEAR versus SPYBEAR
The regression equation is
HUSBEAR = 0.00340 - 0.0257 SPYBEAR
Predictor Coef SE Coef T P
Constant 0.003399 0.001135 3.00 0.003
SPYBEAR -0.02569 0.03942 -0.65 0.516
S = 0.0124754 R-Sq = 0.4% R-Sq(adj) = 0.0%
highly signif alpha with flat beta
Here is the same for bull period, 3/00-6/05:
Regression Analysis: HUS BUL versus SPY BUL
The regression equation is
HUS BUL = 0.00116 + 0.469 SPY BUL
Predictor Coef SE Coef T P
Constant 0.00116 0.00064 1.79 0.076
SPY BUL 0.46866 0.04235 11.07 0.000
S = 0.00674420 R-Sq = 52.2% R-Sq(adj) = 51.8%
Alpha is not quite significant, but he must have removed the hedges to get beta to 0.5 and extremely signficant correlation. Finally here he is recently, 6/05 to last week:
Regression Analysis: HUS REC versus SPY REC
The regression equation is
HUS REC = 0.00123 - 0.0652 SPY REC
Predictor Coef SE Coef T P
Constant 0.0012253 0.0004826 2.54 0.012
SPY REC -0.06516 0.03213 -2.03 0.045
S = 0.00510472 R-Sq = 3.5% R-Sq(adj) = 2.7%
Alpha again is highly significant, but now with negative beta.
This suggests he knows how to make money in up and down markets, partly as consistent alpha and partly when to turn up beta. You can see it also in one-sample t-test vs H(0) of return = 0:
One-Sample T: HUSBEAR, SPYBEAR, HUS BUL, SPY BUL, HUS REC, SPY REC
Test of mu = 0 vs. not = 0
Variable N Mean StDev SE Mean 95% CI T P
HUSBEAR 122 0.00347 0.01244 0.00112 ( 0.00124, 0.00570) 3.08 0.003
SPYBEAR 122 -0.00279 0.02876 0.00260 (-0.00795, 0.00235) -1.07 0.285
HUS BUL 114 0.00262 0.00971 0.00091 ( 0.00082, 0.00443) 2.89 0.005
SPY BUL 114 0.00313 0.01498 0.00140 ( 0.00035, 0.00591) 2.23 0.027
HUS REC 114 0.00109 0.00517 0.00048 ( 0.00013, 0.00205) 2.25 0.026
SPY REC 114 0.00204 0.01494 0.00140 (-0.00072, 0.00481) 1.46 0.147
There seem to be three ways to beat the market:
1. Significant alpha with insignificant beta
2. Insignificant alpha, but significant positive beta in up-markets (market timing)
3. Combination of 1+2
This kind of analysis doesn't factor in volatility of returns, which is also important. There is less value in matching the market with a weekly standard deviation of 50% than 5%, at least in terms of stomach upset.
Jeff Sasmore comments:
WADR, Hussman's technical stuff may look good in a table.
The NAV on HSGFX hasn't moved since mid 2004. He missed almost all of the rally since he's so bearish. Must be related to a prominent editorialist at Barrons. If you want that sort of stability buy a CD.
Rod Fitzsimmons Frey writes:
"Master" is a term widely used in the hobbyist craft market in order to tout videos, TV shows, etc. Person X is a master woodworker and so you should buy his four-hour DVD about sharpening plane irons.
In the 17th and 18th centuries a woodworker or joiner would serve a four to five year apprenticeship which was really more akin to slavery than employment. Then he could call himself a journeyman.
The next day if he had the money he could open a shop, employ an apprentice (slave), and call himself a master.
So in woodworking, the original sense of "master" was one who, largely due to protections built into the system, could employ slave labor. It has morphed into a marketing term used to hawk wares to people who often would like to substitute money for hard work and skill. I won't insult anybody by spelling out the investment-world parallels.
Aug
16
Moral Hazard Timing, from Kim Zussman
August 16, 2007 | Leave a Comment
 Ben Bernanke gets a big test only one and a half years into his tenure. The risk of an unscheduled rate cut is appearing to kowtow to Wall St, soon before a likely party change in the White House. But when Main St. gets hit (i.e., all the poor credit borrowers likely to decide the election) is that a real test of apolitical FED CFC B/R?
The 10,000+ absolute return operations must have mostly been leaning long in prior four years. Those in trouble who throw in the towel on 10% decline are less likely to be successful in future OPM endeavors than those who wait for big boys to fail alongside. Lehman? Bear? GS? The latter scenario seems the kind that could mark a bottom.
James Lackey writes:
I find it hard to believe that in 2000 if the Fed would have lowered rates after the NASDAQ broke in March, rather than raise them another 50bps, the markets would have gone back to NASDAQ 5,000. I find it hard to believe if rates are lowered to the current four percent 90-day rate, that subprime house flippers and Cape Coral FL home prices will rise anywhere near old highs much less a new high in the next many years.
The damage is done and that game is over, similar to the 2001 Laurel Kenner and Victor Niederhoffer report on the death of day trading. The rates went from over six percent to one and back to five percent before stocks acted anything like the prior period. It took more than five years even though the markets or index went from 775 back to 1500. It was in retrospect a slow grind up, which is funny as that is now looked at as bad because people were accustomed to low volatility.
Yet it’s the other side of a big cycle. Whenever the banks lose their ability to profit from lending — in 1999 tech didn’t need the regulated banks’ money; they went to the markets and IPOs. And in 2005 home owners didn’t need banks; they went to mortgage brokers backed by the markets.
It is my guess that it’s the Fed’s job to return the business back to their clients, their regulated banks.
« go back — keep looking »Archives
- July 2026
- June 2026
- May 2026
- April 2026
- March 2026
- February 2026
- January 2026
- December 2025
- November 2025
- October 2025
- September 2025
- August 2025
- July 2025
- June 2025
- May 2025
- April 2025
- March 2025
- February 2025
- January 2025
- December 2024
- November 2024
- October 2024
- September 2024
- August 2024
- July 2024
- June 2024
- May 2024
- April 2024
- March 2024
- February 2024
- January 2024
- December 2023
- November 2023
- October 2023
- September 2023
- August 2023
- July 2023
- June 2023
- May 2023
- April 2023
- March 2023
- February 2023
- January 2023
- December 2022
- November 2022
- October 2022
- September 2022
- August 2022
- July 2022
- June 2022
- May 2022
- April 2022
- March 2022
- February 2022
- January 2022
- December 2021
- November 2021
- October 2021
- September 2021
- August 2021
- July 2021
- June 2021
- May 2021
- April 2021
- March 2021
- February 2021
- January 2021
- December 2020
- November 2020
- October 2020
- September 2020
- August 2020
- July 2020
- June 2020
- May 2020
- April 2020
- March 2020
- February 2020
- January 2020
- December 2019
- November 2019
- October 2019
- September 2019
- August 2019
- July 2019
- June 2019
- May 2019
- April 2019
- March 2019
- February 2019
- January 2019
- December 2018
- November 2018
- October 2018
- September 2018
- August 2018
- July 2018
- June 2018
- May 2018
- April 2018
- March 2018
- February 2018
- January 2018
- December 2017
- November 2017
- October 2017
- September 2017
- August 2017
- July 2017
- June 2017
- May 2017
- April 2017
- March 2017
- February 2017
- January 2017
- December 2016
- November 2016
- October 2016
- September 2016
- August 2016
- July 2016
- June 2016
- May 2016
- April 2016
- March 2016
- February 2016
- January 2016
- December 2015
- November 2015
- October 2015
- September 2015
- August 2015
- July 2015
- June 2015
- May 2015
- April 2015
- March 2015
- February 2015
- January 2015
- December 2014
- November 2014
- October 2014
- September 2014
- August 2014
- July 2014
- June 2014
- May 2014
- April 2014
- March 2014
- February 2014
- January 2014
- December 2013
- November 2013
- October 2013
- September 2013
- August 2013
- July 2013
- June 2013
- May 2013
- April 2013
- March 2013
- February 2013
- January 2013
- December 2012
- November 2012
- October 2012
- September 2012
- August 2012
- July 2012
- June 2012
- May 2012
- April 2012
- March 2012
- February 2012
- January 2012
- December 2011
- November 2011
- October 2011
- September 2011
- August 2011
- July 2011
- June 2011
- May 2011
- April 2011
- March 2011
- February 2011
- January 2011
- December 2010
- November 2010
- October 2010
- September 2010
- August 2010
- July 2010
- June 2010
- May 2010
- April 2010
- March 2010
- February 2010
- January 2010
- December 2009
- November 2009
- October 2009
- September 2009
- August 2009
- July 2009
- June 2009
- May 2009
- April 2009
- March 2009
- February 2009
- January 2009
- December 2008
- November 2008
- October 2008
- September 2008
- August 2008
- July 2008
- June 2008
- May 2008
- April 2008
- March 2008
- February 2008
- January 2008
- December 2007
- November 2007
- October 2007
- September 2007
- August 2007
- July 2007
- June 2007
- May 2007
- April 2007
- March 2007
- February 2007
- January 2007
- December 2006
- November 2006
- October 2006
- September 2006
- August 2006
- Older Archives
Resources & Links
- The Letters Prize
- Pre-2007 Victor Niederhoffer Posts
- Vic’s NYC Junto
- Reading List
- Programming in 60 Seconds
- The Objectivist Center
- Foundation for Economic Education
- Tigerchess
- Dick Sears' G.T. Index
- Pre-2007 Daily Speculations
- Laurel & Vics' Worldly Investor Articles