Feb
17
View for Skeptics, by Kim Zussman
February 17, 2007 | Leave a Comment
Finally (yeah right), "how low can it go?"
Using same SP500 series of 20 day standard deviations, only 57/719 (8%) periods had st dev <0.004 (0.4%) like the period before last (1/19/07=0.0038). In the past 57 years, what happened in the 20 day following those with st dev<0.004? The next period st dev mean was 0.0044, slightly higher.
But interestingly 25/57 (44%) were actually lower the next period. So it seems looking back that volatility has frequently gone lower from periods comparable to today, even before we were protected by world-dominating military and Ben Putnanke.
This and the trumpets blowing for the breakout/new highs/Dow theory crowd doesn't look good for us skeptics.
Feb
8
Negative Feedback and Trend Following, by Victor Niederhoffer
February 8, 2007 | Leave a Comment
 There has been entirely too little thought given to the mechanism, pathways and reasons that negative feedback works in markets. Perhaps the main reason is that the feeding web is based on a reasonable stability in what and how much is being eaten and recycled.
The people who consume and redistribute must maintain a ready and stable supply of those who produce. They develop mechanisms to keep everything going. One of them is the specialization and great efficiency in their activities. If markets deviate too much from the areas and levels within which the specialization has developed, then much waste and new effort and mechanisms will be necessary.
Aside from the grind that trend following causes (i.e. the losses in execution), and the negative feedback system of movements in the supply and demand schedules that equilibrate, which Marshall pioneered and are now standard in economics, and the numerous other reasons I've set forth (e.g. the fixed nature of the system and the flexibility to profit from it), this appears to me to be the main reason that trend following doesn't work.
Here are a few interesting articles on the subject:
How Great Traders Make Millions in Up or Down Markets
Does Trend Following Work On Stocks?
Interviews At RealWorld Trading
Bill Rafter writes:
Dr. Bruno had posed the idea of beating an index by deleting the worst performers. This is an area in which we have done considerable work. Please note that we do not consider this trend-following. The assets are not charted, just ranked.
Let us imagine an investor who is savvy enough to identify what is strong about an economy and invest in sectors representative of those areas, while avoiding sectors representing the weaker areas of the economy. Note that we are not requiring our investor to be prescient. He does not need to see what will be strong tomorrow, just what is strong and weak now, measured by performance over a recent period.
What is a market sector? The S&P does that work for us, and breaks down the overall market (that is, the S&P 500) into 10 Sectors. They further break it down into 24 Industry Groups, and further still into 60-plus Industries and 140-plus Sub-Industries. The number of the various groups and their constituents changes from time to time as the economy evolves, but essentially the 500 stocks can be grouped in a variety of ways, depending on the degree of focus desired. Some of the groupings are so narrow that only one company represents that group.
Our investor starts out looking at the 10 Sectors and ranks them according to their performance (such as their quarterly rate of change). He then invests in those ranked first through fourth (25 percent in each), and maintains those holdings until the rankings change. How does he do? Not bad, it turns out.
www.mathinvestdecisions.com/Best_4_of_10.gif
From 1990 through 2006, which encompasses several types of market conditions, the overall market managed an 8 percent compound annual rate of return. Our savvy investor achieved 10.77%. A less savvy investor who had the bad fortune to pick the worst six groups would have earned 7.23%. Those results are below. (Note, for comparison purposes, all results excluded dividends.)
www.mathinvestdecisions.com/Worst_6_of_10.gif
How can our savvy investor do better? By simply sharpening one's focus, major improvements can be achieved. If instead of ranking the top 4 of10 Sectors, our savvy investor invests in a similar number (say the top 4, 5 or 6) of the 24 Industry Groups, he achieves a 13.12% compoundedannual rate of return over the same period. Note that the same stocks are represented in the 10 Sectors and the 24 Industry Groups. At no time did he have to be prescient.
www.mathinvestdecisions.com/Going_to_24_groups.gif
One thing you will notice from the graphs above is that the equity curves of our savvy and unlucky investors mimic the rises and declines of the market index itself. Being savvy makes money but it does not insulate one from overall bad markets because the Sectors and even the Industry Groups are not significantly diversified from the overall market.
Why not keep going further out and rank all stocks individually? That clearly results in superior returns, but the volume of trading is such that it can only be accomplished effectively in a fund structure - not by the individual. And even ranking thousands of stocks will not insulate an investor from an overall market decline, if he is only invested in equities. The answer of course is diversification.
It is possible to rank debt and alternative investment sectors alongside equities, in the hope of letting their performances dictate what the investor should own. However the debt and commodities markets have different volatilities than the equities markets. Anyone ranking them must make adjustments for their inherent differences. That is, when ranking really diverse assets, one must rank them on a risk-adjusted basis for it to be a true comparison. However if we make those adjustments and rank treasury bonds (debt) against our 24 Industry Groups (equity) we can avoid some of the overall equity declines. We refer to this as a Strategic Overlay:
www.mathinvestdecisions.com/Strategic_diversification.gif
Adding this Strategic Overlay increases the returns slightly, but more important, diversifies the investor away from some periods of total equity market decline. We are not talking of a policy of running for cover every time the equities markets stall. In the long run, the investor must be in equities.
Invariably in ranking diverse assets such as equities, debt and commodities, our investor will be faced with a decision that he should be completely out of equities. It is likely that will occur during a period of high volatility for equities, but one that has also experienced great returns. Thus, our investor would be abandoning equities when his recent experience would suggest otherwise. And since timing can never be perfect, it is further likely that the equities he abandons will continue to outperform for some period. On an absolute basis, equities may rank best, but on a risk-adjusted basis, they may not. It is not uncommon for investors to ignore risk in such a situation, to their subsequent regret.
Ranking is not without its problems. For example, if you are selecting the top 4 groups of whatever category, there is a fair chance that at some time the assets ranked 4 and 5 will change places back and forth on a daily basis. This "flutter" can be easily solved by providing those who make the cut with a subsequent incumbency advantage. For a newcomer to replace a list member, it then must outrank the current assets on the selected list by the incumbency advantage. This is very similar to the manner in which thermostats work. We have found adding an incumbency advantage to be a profitable improvement without considering transactions costs. When one also considers the reduced transaction costs, the benefits increase even more.
Another important consideration is the "lookback" period. Above we used the example of our savvy investor ranking assets on the basis of their quarterly growth. Not surprisingly, the choice of a lookback period can have an effect on profitability. Since markets tend to fall more abruptly than they rise, lookback periods that perform best during rising markets are markedly different from those that perform best during falling markets. Determining whether a market is rising or falling can be problematic, as it can only be done with certainty in retrospect. However, another key factor influencing the choice of a lookback period is volatility, which can be determined concurrently. Thus an optimal lookback period can be automatically determined based on volatility.
There is certainly no question that a diligent investor can outperform the market. By outperforming the market we mean that he will achieve a greater average rate of return than the market, while limiting the maximum drawdown (or percentage equity decline) to less than that experienced by the market. But the average investor is generally not up to the diligence or persistence required.
In the research work illustrated above, all transactions were executed on the close of the day following a decision being made. Thus the strategy illustrated is certainly executable. Nothing required a forecast; all that was required was for the investor to recognize concurrently which assets have performed well over a recent period. It is not difficult, but requires daily monitoring.
www.mathinvestdecisions.com/about.htm
Charles Pennington writes:
Referring to the MathInvestor's plot:
www.mathinvestdecisions.com/Worst_6_of_10.gif :
At first glance it appears that the "Best" have been beating the "Worst" consistently.
In fact, however, all of the outperformance was from 1990 through 1995. From 1996 to present, it was approximately a tie.
Reading from the plot, I see that the "Best" portfolio was at about 2.1 at the start of 1996. It grew to about 5.5 at the end of the chart for a gain of about 160%. Over the same period, the "Worst" grew from 1.3 to 3.2, a gain of about 150%, essentially the same.
So for the past 11 years, this system had negligible outperformance.
One should also consider that the "Best" portfolio benefits in the study from stale pricing, which one could not capture in real trading. Furthermore, dividends were not included in the study. My guess is that the "Worst" portfolio would have had a higher dividend yield.
In order to improve this kind of study, I would recommend:
1.) Use instruments that can actually be traded, rather than S&P sectors, in order to eliminate the stale pricing concern.
2.) Plot the results on a semilog graph. That would have made it clear that all the outperformance happened before 1996.
3.) Finally, include dividends. The reported difference in compound annual returns (10.8% vs 8.0%) would be completely negated if the "Worst" portfolio had a yield 2.8% higher than the "Best".
Bill Rafter replies:
Gentlemen, please! The previously sent illustration of asset ranking is not a proposed "system," but simply an illustration that tilting one's portfolio away from dogs and toward previous performers can have a beneficial effect on the portfolio. The comparison between the 10 Sectors and the 24 Industry Groups illustrates the benefits of focus. That is, (1) don't buy previous dogs, and (2) sharpen your investment focus. Ignore these points and you will be leaving money on the table.
We have done this work with many different assets such as ETFs and even Fidelity funds (which require a 30-day holding period), both of which can be realistically traded. They are successful, but not overwhelmingly so. Strangely, one of the best asset groups to trade in this manner would be proprietarily-traded small-cap funds.
Unfortunately if you try trading those, your broker will disown you. I mention that example only to suggest that some assets truly do have "legs," or "tails" if you prefer. I think their success is attributed to the fact that some prop traders are better than others, and ranking them works. An asset group with which we have had no success is high-yield debt funds. I have no idea why.
A comment from Jerry Parker:
 I wrote an initial comment to you via your website [can be found under the comments link by the title of this post], disputing your point of view, which a friend of mine read, and sent me the following:
I read your comment on Niederhoffer's Daily Spec in response to his arguments against trend following. Personally, I don't think it boils down to intelligence, but rather to ego. Giving up control to an ego-less computer is not an easy task for someone who believes so strongly in the ability of the human mind. I have great respect for his work and his passion for self study, but of course disagree with his thoughts on trend following. On each trade, he is only able to profit if it "trends" in a favorable direction, whether the holding period is 1 minute or 1 year. Call it what you will, but he trades trends all day.
He's right. I was wrong. Trend following is THE enemy of the 'genius'. You and your friends can't even see how stupid your website is. You are blinded by your superior intelligence and arrogance.
Victor Niederhoffer responds:
Thanks much for your contributions to the debate. I will try to improve my understanding of this subject and my performance in the future so as not to be such an easy target for your critiques.
Ronald Weber writes:
When you think about it, most players in the financial industry are nothing but trend followers (or momentum-players). This includes analysts, advisors, relationship managers, and most fund or money managers. If there is any doubt, check the EE I function on Bloomberg, or the money flow/price functions of mutual funds.
The main reason may have more to do with career risk and the clients themselves. If you're on the right side while everyone is wrong, you will be rewarded; if you're on the wrong side like most of your peers you will be ok; and if you're wrong while everyone is right then you're in trouble!
In addition, most normal human beings (daily specs not included!) don't like ideas that deviate too much from the consensus. You are considered a total heretic if you try to explain why, for example, there is no link between the weak USD and the twin deficits. This is true, too, if you would have told anyone in 2002 that the Japanese banks will experience a dramatic rebound like the Scandinavian banks in the early '90s, and so on, or if you currently express any doubt on any commodity.
So go with the flow, and give them what they want! It makes life easier for everyone! If you can deal with your conscience of course!
The worse is that you tend to get marginalized when you express doubt on contagious thoughts. You force most people to think. You're the boring party spoiler! It's probably one reason why the most successful money managers or most creative research houses happen to be small organizations.
Jeremy Smith offers:
![]() Not arguing one way or the other here, but for any market or any stock that is making all time highs (measured for sake of argument in years) do we properly say about such markets and stocks that there is no trend?
Not arguing one way or the other here, but for any market or any stock that is making all time highs (measured for sake of argument in years) do we properly say about such markets and stocks that there is no trend?
Vincent Andres contributes:
I would distinguish/disambiguate drift and trend.
"Drift": Plentifully discussed here. "Trend": See arcsine, law of series, etc.
In 2D, the French author Jean-Paul Delahaye speaks about "effet rateau" (rake effect), here and here .
Basically, our tendency is to believe that random equals equiprobability everywhere (2D) or random equals equiprobability everytime (1D), and thus that nonequiprobability everywhere/everytime equals non random
In 1D, non equiprobability everytime means that the sequence -1 +1 -1 +1 -1 +1 -1 +1 is in fact the rare and a very non random sequence, while the sequences -1 +1 +1 +1 +1 +1 -1 +1 with a "trend" are in fact the truly random ones. By the way, this arcsine effect does certainly not explain 100% of all the observed trends. There may also be true ones. Mistress would be too simple. True drift may certainly produce some true trends, but certainly far less than believed by many.
Dylan Distasio adds:
For those who don't believe trend following can be a successful strategy, how would you explain the long-term performance of the No Load Fund X newsletter? Their system consists of a fairly simple relative strength mutual fund (and increasingly ETF) model where funds are held until they weaken enough in relative strength to swap out with new ones.
The results have been audited by Hulbert and consistently outperform the S&P 500 over a relatively long time frame (1980 onwards). I think their results make a trend following approach worth investigating…
Jerry Parker comments again:
All you are saying is that you're not smart enough to develop a trend following system that works. What do you say about the billions of dollars traded by trend following CTAs and their long term track records?
Steve Leslie writes:
If the Chair is not smart enough to figure out trend following, what does that bode for the rest of us?
There is a very old yet wise statement: Do not confuse brains with a bull market.
Case in point: prior to 2000 the great tech market run was being fueled by the hysteria surrounding Y2K. Remember that term? It is not around today but it was the cause for the greatest bull market seen in stocks ever. Dot.com stocks and new issues were being bought with reckless abandon.
New issues were priced overnight and would open 40-50 points higher the next trading day. Money managers had standing orders to buy any new issues. There was no need for dog-and-pony or road shows. It was an absolute classic and chaotic case of extraordinary delusion and crowd madness.
Due diligence was put on hold, or perhaps abandoned. A colleague of mine once owned enough stock in a dot.com that had he sold it at a propitious time, he would have had enough money to purchase a small Hatteras yacht. Today, like many contemporary dot.coms, that stock is essentially worthless. It would not buy a Mad magazine.
Corporations once had a virtual open-ended budget to upgrade their hardware and software to prepare for the upcoming potential disaster. This liquidity allowed service companies to cash in by charging exorbitant fees. Quarter to quarter earnings comparisons were beyond belief and companies did not just meet the numbers, they blew by them like rocket ships. What made it so easy to make money was that when one sold a stock, all they had to do was purchase another similar stock that also was accelerating. The thought processes where so limited. Forget value investing; nobody on the planet wanted to talk to those guys. The value managers had to scrape by for years while they saw their redemptions flow into tech, momentum, and micro cap funds. It became a Ponzi scheme, a game of musical chairs. The problem was timing.
The music stopped in March of 2000 when CIO's need for new technology dried up coincident with the free money, and the stock market went into the greatest decline since the great depression. The NASDAQ peaked around 5000. Today it hovers around 2500, roughly half what it was 7 years ago.
It was not as if there were no warning signs. Beginning in late 1999, the tech market began to thin out and leadership became concentrated in a few issues. Chief among the group were Cisco, Oracle, Qwest, and a handful of others. Every tech, momentum, and growth fund had those stocks in their portfolio. This was coincident with the smart money selling into the sectors. The money managers were showing their hands if only one could read between the lines. Their remarks were "these stocks are being priced to perfection." They could not find compelling reasons not to own any of these stocks. And so on and on it went.
After 9/11 markets and industries began to collapse. The travel industry became almost nonexistent. Even Las Vegas went on life support. People absolutely refused to fly. Furthermore, business in and around New York City was in deep peril. This forced the Fed to begin dramatically reducing interest rates to reignite the economy. It worked, as corporations began to refinance their debt and restructure loans, etc.
The coincident effect began to show up in the housing industry. Homeowners refinanced their mortgages (yours truly included) and took equity out of their homes. Home-buyers were thirsty for real estate and bought homes as if they would disappear off the earth. For $2000 one could buy an option on a new construction home that would not be finished for a year. "Flipping" became the term du jour. Buy a home in a hot market such as Florida for nothing down and sell it six months later at a much higher price. Real estate was white hot. Closing on real estate was set back weeks and weeks. Sellers had multiple offers on their homes many times in the same day. This came to a screeching halt recently with the gradual rise in interest rates and the mass overbuilding of homes, and the housing industry has slowed dramatically.
Houses for sale now sit on the blocks for nine months or more. Builders such as Toll, KB, and Centex have commented that this is the worst real estate market they have seen in decades. Expansion plans have all but stopped and individuals are walking away from their deposits rather than be upside down in their new home.
Now we have an ebullient stock market that has gone nearly 1000 days without so much as a 2% correction in a day. The longest such stretch in history. What does this portend? Time will tell. Margin debt is now at near all-time highs and confidence indicators are skewed. Yet we hear about trend followers and momentum traders and their success. I find this more than curious. One thing that they ever fail to mention is that momentum trading and trend following does not work very well in a trendless market. I never heard much about trend followers from June 2000 to October 2002. I am certain that this game of musical chairs will end, or at least be temporarily interrupted.
As always, it is the diligent speculator who will be prepared for the inevitable and capitalize upon this event. Santayana once said, "Those who cannot remember the past are condemned to repeat it."
From "A Student:"
Capitalism is the most successful economic system in the history of the world. Too often we put technology up as the main driving force behind capitalism. Although it is true that it has much to offer, there is another overlooked hero of capitalism. The cornerstone of capitalism is good marketing.
The trend following (TF) group of fund managers is a perfect example of good marketing. As most know, the group as a whole has managed to amass billions of investor money. The fund operators have managed to become wealthy through high fees. The key to this success is good marketing not performance. It is a tribute to capitalism.
The sports loving fund manger is a perfect example. All of his funds were negative for 2006 and all but one was negative over the last 3 years! So whether one looks at it from a short-term one year stand point or a three year perspective his investors have not made money. Despite this the manager still made money by the truckload during this period. Chalk it up to good marketing, it certainly was not performance.
The secret to this marketing success is intriguing. Normally hedge funds and CTAs cannot solicit investors nor even publicly tout their wares on an Internet site. The TF funds have found a way around this. There may be a web site which openly markets the 'concept' of TF but ostensibly not the funds. On this site the names of the high priests of TF are repeatedly uttered with near religious reverence. Thus this concept site surreptitiously drives the investors to the TF funds.
One of the brilliant marketing tactics used on the site is the continuous repetition of the open question, "Why are they (TF managers) so rich?" The question is offered as a sophist's response to the real world question as to whether TF makes money. The marketing brilliance lies in the fact that there is never a need to provide factual support or performance records. Thus the inconvenient poor performance of the TF funds over the last few years is swept under the carpet.
Also swept under the rug are the performance figures for once-great trend followers who no longer are among the great, i.e., those who didn't survive. Ditto for the non-surviving funds in this or that market from the surviving trend followers.
Another smart technique is how the group drives investor traffic to its concept site. Every few years a hagiographic book is written which idolizes the TF high priests. It ostensibly offers to reveal the hidden secrets of TF.
Yet after reading the book the investor is left with no usable information, merely a constant repetition of the marketing slogan: How come these guys are so rich? Obviously the answer is good marketing but the the book is moot on the subject. Presumably, the books are meant to be helpful and the authors are true believers without a tie-in in mind. But the invisible hand of self-interest often works in mysterious ways.
In the latest incarnation of the TF book the author is presented as an independent researcher and observer. Yet a few days after publication he assumes the role of Director of Marketing for the concept site. Even the least savvy observer must admit that it is extraordinary marketing when one can persuade the prospect to pay $30 to buy a copy of the marketing literature.
Jason Ruspini adds:
![]() "I attribute much of the success of the selected bigs to being net long leveraged in fixed income and stocks during the relevant periods."
"I attribute much of the success of the selected bigs to being net long leveraged in fixed income and stocks during the relevant periods."
I humbly corroborate this point. If one eliminates long equity, long fixed income (and fx carry) positions, most trend-following returns evaporate.
Metals and energies have helped recently, after years of paying floor traders.
Victor replies:
I don't agree with all the points above. For example, the beauty of capitalism is not its puffery, but the efficiency of its marketing and distribution system as well as the information and incentives that the prices provide so as to fulfill the pitiless desires of the consumers. Also beautiful is in the mechanism that it provides for those with savings making low returns to invest in the projects of entrepreneurs with much higher returns in fields that are urgently desired by customers.
I have been the butt of abuse and scorn from the trend followers for many years. One such abusive letter apparently sparked the writer's note. Aside from my other limitations, the trend following followers apparently find my refusal to believe in the value of any fixed systems a negative. They also apparently don't like the serial correlation coefficients I periodically report that test the basic tenets of the trend following canon.
I believe that if there are trends, then the standard statistical methods for detecting same, i.e., correlograms, regressions, runs and turning point tests, arima estimates, variance ratio tests, and non-linear extensions of same will show them.
Such tests as I have run do not reveal any systematic departures from randomness. Nor if they did would I believe they were predictive, especially in the light of the principle of ever changing cycles about which I have written extensively.
Doubtless there is a drift in the overall level of stock prices. And certain fund managers who are biased in that direction should certainly be able to capture some of that drift to the extent that the times they are short or out of the market don't override it. However, this is not supportive of trend following in my book.
Similarly, there certainly has been over the last 30 years a strong upward movement in fixed income prices. To the extent that a person was long during this period, especially if on leverage, there is very good reason to believe that they would have made money, especially if they limited their shorts to a moiete.
Many of the criticisms of my views on trend following point to the great big boys who say they follow trends. To the extent that those big boys are not counterbalanced by others bigs who have lost, I attribute much of the success of the selected bigs to being net long leveraged in fixed income and stocks during the relevant periods.
I have no firm belief as to whether such things as trends in individual stocks exist. The statistical problem is too complex for me because of a paucity of independent data points, and the difficulties of maintaining an operational prospective file.
Neither do I have much conviction as to whether trends exist in commodities or foreign exchange. The overall negative returns to the public in such fields seem to be of so vast a magnitude that it would not be a fruitful line of inquiry.
If I found such trends through the normal statistical methods, I would suspect them as a lure of the invisible evil hand to bring in big money to follow trends after a little money has been made by following them, the same way human imposters work in other fields. I believe that such a tendency for trend followers to lose with relatively big money after making with smaller amounts is a feature of all fixed systems. And it's guaranteed to happen by the law of ever-changing cycles.
The main substantive objection to my views that I have found in the past, other than that trend followers know many people who make money following trends (a view which is self-reported and selective and non-systematic, and thus open to some of the objections of those of the letter-writer), is that they themselves follow trends and charts and make much money doing it. What is not seen by these in my views is what they would have made with their natural instincts if they did not use trend following as one of their planks. This is a difficult argument for them to understand or to confirm or deny.
My views on trend following are always open to new evidence, and new ways of looking at the subject. I solicit and will publish all views on this subject in the spirit of free inquiry and mutual education.
Jeff Sasmor writes:
![]() Would you really call what FUNDX does trend following? Well, whatever they do works.
Would you really call what FUNDX does trend following? Well, whatever they do works.
I used their system successfully in my retirement accounts and my kids' college UTMA's and am happy enough with it that I dumped about 25% of that money in their company's Mutual Funds which do the same process as the newsletter. The MFs are like an FOF approach. The added expense charges are worth it. IMO, anyway. Their fund universe is quite small compared to the totality of funds that exist, and they create classes of funds based on their measure of risk.
This is what they say is their process. When friends ask me what to buy I tell them to buy the FUNDX mutual fund if their time scale is long. No one has complained yet!
It ain't perfect (And what is? unless your aim is to prove that you're right) but it's better than me fumfering around trying to pick MFs from recommendations in Money Magazine, Forbes, or Morningstar.
I'm really not convinced that what they do is trend following though.
Dylan Distasio Adds:
For those who don't believe trend following can be a successful strategy, how would you explain the long-term performance of the No Load Fund X newsletter?
Michael Marchese writes:
In a recent post, Mr. Leslie finished his essay with, "I never heard much about trend followers from June 2000 to October 2002." This link shows the month-to-month performance of 13 trend followers during that period of time. It seems they did OK.
Hanny Saad writes:
Not only is trend following invalid statistically but, looking at the bigger picture, it has to be invalid logically without even running your unusual tests.
If wealth distribution is to remain in the range of 20 to 80, trend following cannot exist. In other words, if the majority followed the trend (hence the concept of trends), and if trend following is in fact profitable, the majority will become rich and the 20-80 distribution will collapse. This defeats logic and history. That said, there is the well-covered (by the Chair) general market upward drift that should also come as no surprise to the macro thinkers. The increase in the general population, wealth, and the entrepreneurial spirit over the long term will inevitably contribute to the upward drift of the general market indices as is very well demonstrated by the triumphal trio.
While all world markets did well over the last 100 yrs, you notice upon closer examination that the markets that outperformed were the US, Canada, Australia, and New Zealand. The one common denominator that these countries have is that they are all immigration countries. They attract people.
Contrary to what one hears about the negative effects of immigration, and how immigrants cause recessions, the people who leave their homelands looking for a better life generally have quite developed entrepreneurial spirits. As a result, they contribute to the steeper upward curve of the markets of these countries. When immigrants are allowed into these countries, with their life savings, home purchases, land development, saving and borrowing, immigration becomes a rudder against recession, or at least helps with soft landings. Immigration countries have that extra weapon called LAND.
So in brief, no - trends do not exists and can not exist either statistically or logically, with the exception of the forever upward drift of population and general markets with some curves steeper than others, those of the countries with the extra weapon called land and immigration.
A rereading of The Wealth And Poverty Of Nations, by Landes, and the triumph of the optimist may be in order.
Steve Ellison adds:
So Mr. Parker's real objective was simply to insult the Chair, not to provide any evidence of the merits of trend following that would enlighten us (anecdotes and tautologies that all traders can only profit from favorable trends prove nothing). I too lack the intelligence to develop a trend following system that works. When I test conditions that I naively believe to be indicative of trends, such as crossovers of moving averages, X-day highs and lows, and the direction of the most recent Y percent move, I usually find negative returns going forward.
Bacon summarized his entire book in a single sentence: "Always copper the public play!" My more detailed summary was, "When the public embraces a particular betting strategy, payoffs fall, and incentives (for favored horsemen) to win are diminished."
Trend Following — Cause, from James Sogi:
Generate a Brownian motion time series with drift in R
WN <-rnorm(1024);RW<-cumsum(WN);DELTAT<-1/252;
MU<-.15*DELTAT;SIG<-.2*sqrt(DELTAT);TIME<-(1:1024)/252 stock<-exp(SIG*RW+MU*TIME) ts.plot(stock)
Run it a few times. Shows lots of trends. Pick one. You might get lucky.
Trend Following v. Buy and Hold, from Yishen Kuik
The real price of pork bellies and wheat should fall over time as innovation drives down costs of production. Theoretically, however, the nominal price might still show drift if the inflation is high enough to overcome the falling real costs of production.
I've looked at the number of oranges, bacon, and tea a blue collar worker's weekly wages could have purchased in New York in 2000 versus London in the 1700s. All quantities showed a significant increase (i.e., become relatively cheaper), lending support to the idea that real costs of production for most basic foodstuffs fall over time.
Then again, according to Keynes, one should be able to earn a risk premium from speculating in commodity futures by normal backwardation, since one is providing an insurance service to commercial hedgers. So one doesn't necessarily need rising spot prices to earn this premium, according to Keynes.
Not All Deer are Five-Pointers, from Larry Williams
 What's frustrating to me about trading is having a view, as I sometimes do, that a market should be close to a short term sell, yet I have no entry. This betwixt and between is frustrating, wanting to sell but not seeing the precise entry point, and knowing I may miss the entry and then see the market decline.
So I wait. It's hard to learn not to pull the trigger at every deer you see. Not all are five-pointers… and some will be bagged by better hunters than I.
From Gregory van Kipnis:
 Back in the 70s a long-term study was done by the economic consulting firm of Townsend Greenspan (yes, Alan's firm) on a variety of raw material price indexes. It included the Journal of Commerce index, a government index of the geometric mean of raw materials and a few others. The study concluded that despite population growth and rapid industrialization since the Revolutionary War era, that supply, with a lag, kept up with demand, or substitutions (kerosene for whale blubber) would emerge, which net-net led to raw material prices being a zero sum game. Periods of specific commodity price rises were followed by periods of offsetting declining prices. That is, raw materials were not a systematic source of inflation independent of monetary phenomena.
It was important to the study to construct the indexes correctly and broadly, because there were always some commodities that had longer-term rising trends and would bias an index that gave them too much weight. Other commodities went into long-term decline and would get dropped by the commodity exchanges or the popular press. Just as in indexes of fund performance there can be survivor bias, so too with government measures of economic activity and inflation.
However, this is not to say there are no trends at the individual commodity level of detail. Trends are set up by changes in the supply/demand balance. If the supply/demand balance changes for a stock or a commodity, its price will break out. If it is a highly efficient market, the breakout will be swift and leave little opportunity for mechanical methods of exploitation. If it is not an efficient market (for example, you have a lock on information, the new reality is not fully understood, the spread of awareness is slow, or there is heavy disagreement, someone big has to protect a position against an adverse move) the adjustment may be slower to unfold and look like a classic trend. This more often is the case in commodities.
Conversely, if you find a breakout, look for supporting reasons in the supply/demand data before jumping in. But, you need to be fast. In today's more highly efficient markets the problem is best summarized by the paradox: "look before you leap; but he who hesitates is lost!"
Larry Williams adds:
I would posit there is no long-term drift to commodities and thus we have a huge difference in these vehicles.
The commodity index basket guys have a mantra that commodities will go higher - drift - but I can find no evidence that this is anything but a dream, piquant words of promotion that ring true but are not.
I anxiously stand to be corrected.
Marlowe Cassetti writes:
"Along a similar vein, why would anybody pay Powershares to do this kind of work when the tools to do it yourself are so readily available?"
The simple answer is if someone wishes to prescribe to P&F methodology investing, then an ETF is a convenient investment vehicle.
With that said, this would be an interesting experiment. Will the DWA ETF be another Value Line Mutual Fund that routinely fails to beat the market while their newsletter routinely scores high marks? There are other such examples, such as IBD's William O'Neal's aborted mutual fund that was suppose to beat the market with the fabulous CANSLIM system. We have talked about the great track record of No-Load Fund-X newsletter, and their mutual fund, FUNDX, has done quite well in both up and down markets (an exception to the above mentioned cases).
For full disclosure I have recently added three of their mutual funds to my portfolio FUNDX, HOTFX, and RELAX. Hey, I'm retired and have better things to do than do-it-yourself mutual fund building. With 35 acres, I have a lot of dead wood to convert into firewood. Did you know that on old, dead juniper tree turns into cast iron that dulls a chain saw in minutes? But it will splinter like glass when whacked with a sledgehammer.
Kim Zussman writes:
…about the great track record of No-Load Fund-X newsletter and their mutual fund FUNDX has done quite well in both up and down markets… (MC)
Curious about FUNDX, checked its daily returns against ETF SPY (essentially large stock benchmark).
Regression Analysis of FUNDX versus SPY since inception, 6/02 (the regression equation is FUNDX = 0.00039 + 0.158 SPY):
Predictor Coef SE Coef T P
Constant 0.00039 0.000264 1.48 0.14
SPY 0.15780 0.026720 5.91 0.00
S = 0.00901468 R-Sq = 2.9% R-Sq (adj) = 2.8%
The constant (alpha) is not quite significant, but it is positive, so FUNDX did out-perform SPY. Slope is significant and the coefficient is about 0.16, which means FUNDX was less volatile than SPY.
This is also shown by F-test for variance:
Test for Equal Variances: SPY, FUNDX
F-Test (normal distribution) Test statistic = 1.17, p-value = 0.009 (FUNDX<SPY)
But t-test for difference between daily returns shows no difference:
Two-sample T for SPY vs FUNDX
N Mean St Dev SE Mean
SPY 1169 0.00041 0.0099 0.00029
FUNDX 1169 0.00045 0.0091 0.00027 T=0.12
So it looks like FUNDX has been giving slight/insignificant out-performance with significantly less volatility; which makes sense since it is a fund of mutual funds and ETFs.
Even better is Dr Bruno's idea of beating the index by deleting the worst (or few worst) stocks (new additions?).
How about an equal-weighted SP500 (which out-performs when small stocks do), without the worst 50 and double-weighting the best 50.
Call it FUN-EX, in honor of the fun you had with your X that was all mooted in the end.
Alex Castaldo writes:
The results provided by Dr. Zussman are fascinating:
The fund has a Beta of only 0.157, incredibly low for a stock fund (unless they hold a lot of cash). Yet the standard deviation of 0.91468% per day is broadly consistent with stock investing (S&P has a standard deviation of 1%). How can we reconcile this? What would Scholes-Williams, Dimson, and Andy Lo think when they see such a low beta? Must be some kind of bias.
I regressed the FUNDX returns on current and lagged S&P returns a la Dimson (1979) with the following results:
Regression Statistics
Multiple R 0.6816
R Square 0.4646
Adjusted R Square 0.4627
Standard Error 0.0066
Observations 0.1166
ANOVA
df SS MS F Significance F
Regression 4 0.0444 0.0111 251.89 8.2E-156
Residual 1161 0.0511 4.4E-05
Total 1165 0.0955
Coefficients Standard Error t-Stat P-value
Intercept 8.17E-05 0.000194 0.4194 0.6749
SPX 0.18122 0.019696 9.2007 1.6E-19
SPX[-1] 0.60257 0.019719 30.5566 6E-151 SPX[-2] 0.08519 0.019692 4.3260 1.648E-05 SPX[-3] 0.04524 0.019656 2.3017 0.0215
Note the following:
(1) All four S&P coefficients are highly significant.
(2) The Dimson Beta is 0.914 (the sum of the 4 SPX coefficients). The mystery of the low beta has been solved.
(3) The evidence of price staleness, price smoothing, non-trading, whatever you want to call it is clear. Prof. Pennington touched on this the other day; an "efficiently priced" asset should not respond to past S&P price moves. Apparently though, FUNDX holds plenty of such assets (or else the prices of FUNDX itself, which I got from Yahoo, are stale).
S. Les writes:
Have to investigate the Fund X phenomenon. And look to see how it has done in last several years since it was post selected as good. Someone has to win a contest, but the beaten favorites are always my a priori choice except when so many others use that as a system the way they do in sports eye at the harness races, in which case waiting for two races or two days seems more apt a priori. VN
I went to the Fund X website to read up, and the information is quite sparse. It is a very attenuated website. I called the toll free number and chatted with the person on the other line. Information was OK, but, in my view, I had to ask the proper questions. One has several options here. One is to purchase the service and do the fund switching themselves based on the advice of their experts. The advisory service tracks funds that have the best relative strength performance and makes their recommendations from there, www.fundx.com.
Another is to purchase one of four funds available. They have varying levels of aggressiveness. Fund 3 appears to be the recommended one.
If one purchases the style 3 one will get a very broad based fund of funds. I went to yahoo to look up the holdings at www.finance.yahoo.com/q/hl?s=FUNDX.
Top ten holdings are 47.5% of the portfolio, apparently concentrated in emerging markets and international funds at this time.
In summary, if money were to be placed into the Fund X 3 portfolio, I believe it would be so broad based and diversified that returns would be very watered down. Along with risk you would certainly be getting a lot of funds. You won't set the world on fire with this concept, but you won't get blown up, either.
Larry Williams adds:
My 2002 book, Right Stock at the Right Time, explains such an approach in the Dow 30. The losers were the overvalued stocks in the Dow.It is a simple and elegant idea…forget looking for winners…just don't buy overvalued stocks and you beat the idex.
This notion was developed in 1997, when i began actually doing it, and written about in the book. This approach has continued to outperform the Dow, it is fully revealed.
Craig Cuyler writes:
Larry's comment on right stock right time is correct and can be used to shed a little bit of light on trend following. This argument is at the heart of fundamental indexation, which amongst other points argues that cap weighting systematically over-weights overvalued stocks and under-weights undervalued stocks in a portfolio.
Only 29% of the top 10 stocks outperformed the market average over a 10yr period (1964-2004) according to Research Affiliates (this is another subject). The concept of "right stock right time" might be expressed another way, as "right market right time." The point is that constant analysis needs to take place for insuring investment in the products that are most likely to give one a return.
The big error that the trend followers make, in my mind, is they apply a homogeneous methodology to a number of markets and these are usually the ones that are "hot" at the time that the funds are applied. The system is then left to its own devices and inevitably breaks down. Most funds will be invested at exactly the time when the commodity, currencies, etc., are at their most overvalued.
Some worthwhile questions are: How does one identify a trend? Why is it important that one identifies a trend? How is it that security trends allow me to make money? In what time frame must the trend take place and why? What exactly is a trend and how long must it last to be so labeled?
I think it is important to differentiate between speculation using leverage and investing in equities because, as Vic (and most specs on the list) point out, there is a drift factor in equities which, when using sound valuation principles, can make it easier to identify equities that have a high probability of trending. Trend followers don't wait for a security to be overvalued before taking profits. They wait for the trend to change before then trying to profit from the reversal.
Jeff Sasmor adds:
As a user of both the newsletter and the FUNDX mutual fund I'd like to comment that using the mutual fund removes the emotional component of me reading the newsletter and having to make the buys and sells. Perhaps not an issue for others, but I found myself not really able to follow the recommendations exactly - I tend to have an itchy trigger finger to sell things. This is not surprising since I do mostly short-term and day trades. That's my bias; I'm risk averse. So the mutual fund puts that all on autopilot. It more closely matches the performance of their model portfolio.
I don't know how to comment on the comparisons to Value Line Arithmetic Index (VAY). Does anyone follow that exactly as a portfolio?
My aim is to achieve reasonable returns and not perfection. I assume I don't know what's going to happen and that most likely any market opinion that I have is going to be wrong. Like Mentor of Arisia, I know that complete knowledge requires infinite time. That and beta blockers helps to remove the shame aspect of being wrong. But there's always an emotional component.
As someone who is not a financial professional, but who is asked what to buy by friends and acquaintances who know I trade daily (in my small and parasitical fashion), I have found that this whole subject of investing is opaque to most people. Sort of like how in the early days of computing almost no one knew anything about computers. Those who did were the gatekeepers, the high priests of the temple in a way. Most people nowadays still don't know what goes on inside the computer that they use every day. It's a black box - opaque. They rely on the Geek Squad and other professionals to help them out. It makes sense. Can't really expect most people to take the time to learn the subject or even want to. Should they care whether their SW runs on C++ or Python, or what the internal object-oriented class structure of Microsoft Excel is, or whether the website they are looking at is XHTML compliant? Heck no!
Similarly, most people don't know anything about markets; don't want to learn, don't want to take the time, don't have the interest. And maybe they shouldn't. But they are told they need to invest for retirement. As so-called retail investors they depend on financial consultants, fee-based planners, and such to tell them what to do. Often they get self-serving or become too loaded with fees (spec-listers who provide these services excepted).
So I think that the simple advice that I give, of buying broad-based index ETFs like SPY and IWM and something like FUNDX, while certainly less than perfect, and certainly less profitable than managing your own investments full-time, is really suitable for many people who don't really have the inclination, time, or ability to investigate the significant issues for themselves or sort out the multitudes of conflicting opinions put forth by the financial media.
You may not achieve the theoretical maximum returns (no one does), but you will benefit from the upward drift in prices and your blended costs will be reasonable. And it's better than the cash and CDs that a lot of people still have in their retirement accounts.
BTW: FOMA = Foma are harmless untruths, intended to comfort simple souls.
An example : "Prosperity is just around the corner."
I'm not out to defend FUNDX, I have nothing to do with them. I'm just happy with it.
Steve Ellison writes:
One might ask what the purpose of trends is in the market ecosystem. In the old days, trends occurred because information disseminated slowly from insiders to Wall Streeters to the general public, thus ensuring that the public lost more than it had a right to. Memes that capture the public imagination, such as Nasdaq in the 1990s, take years to work through the population, and introduce many opportunities for selling new investment products to the public.
Perhaps some amount of trending is needed from time to time in every market to keep the public interested and tossing chips into the market. I saw this statement at the FX Money Trends website on September 21, 2005: "[T]he head of institutional sales at one of the largest FX dealing rooms in the US … lamented that for the past 2 months trading volume had dried up for his firm dramatically because of the 'lack of trend' and that many 'system traders' had simply shut down to preserve capital."
I saw a similar dynamic recently at a craps table when shooters lost four or five consecutive points, triggering my stop loss so that I quit playing. About half the other players left the table at the same time. "The table's cold," said one.
To test whether a market might trend out of necessity to attract money, I used point and figure methodology with 1% boxes and one-box reversals on the S&P 500 futures. I found five instances in the past 18 months in which four consecutive reversals had occurred and tabulated the next four points after each of these instances (the last of which has only had three subsequent points so far). The results were highly non-predictive.
Starting Next 4 points
Date Continuations Reversals
01/03/06 3 1
05/23/06 1 3
06/29/06 2 2
08/15/06 2 2
01/12/07 1 2
—– —–
9 10
Anthony Tadlock writes:
I had intended to write a post or two on my recent two week trip to Cairo, Aswan, and Alexandria. There is nothing salient to trading but Egypt seems to have more Tourist Police and other guards armed with machine guns than tourists. It is a service economy with very few tourists or middle/upper classes to service. Virtually no westerners walk on the streets of Cairo or Alexandria. I did my best to ignore my investments and had closed all my highly speculative short-term trades before leaving for the trip.
While preparing for taxes I was looking over some of my trades for last year. Absolute worst trade was going long CVS and WAG too soon after WalMart announced $2 generic pricing. I had friends in town and wasn't able to spend my usual time watching and studying the market. I just watched them fall for two days and without looking at a chart, studying historical prices and determining how far they might fall, decided the market was being stupid and went long. Couldn't wait to tell my visitors how "smart" a trader I was and my expected profit. It was fun, until announcement after announcement by WalMart kept causing the stocks to keep falling. The result was panic selling near the bottom, even though I had told myself before the trade that I could happily buy and hold both. Basically, I followed all of Vic's rules on "How to Lose."
Trends: If only following a trend meant being able to draw a straight line or buy a system and buy green and sell red. The trend I wrote about several months ago about more babies being born of affluent parents still seems to be intact. I have recently seen pregnant moms pushing strollers again. Planes to Europe have been at capacity my last two trips and on both trips several crying toddlers made sleep difficult, in both directions. Are people with young children using their home as an ATM to fund a European trip? Are they racking up credit card debt that they can't afford? Depleting their savings? (Oh wait - Americans don't save anything.) If they are, then something fundamental has changed about how humans behave.
From James Sogi:
My daughter the PhD candidate at Berkeley in bio-chem is involved in some mind-boggling work. It's all very confidential, but she tried to explain to me some of her undergrad research in words less than 29 letters long. Molecules have shapes and fit together like keys. The right shape needs to fit in for a lock. Double helices of the DNA strand are a popular example, but it works with different shapes. There is competition to fit the missing piece. They talk to each other somehow. One of her favorite stories as a child was Shel Silverstein's Missing Piece. Maybe that's where her chemical background arose. Silverstein's imagery is how I picture it at my low level.
Looking at this past few months chart patterns it is impossible not to see the similarity in how the strands might try fit together missing pieces in Wykoffian functionality. The math and methods must be complicated, but might supply some ideas for how the ranges and strands in the market might fit together, and provide some predictive methods along the lines of biochemical probability theory. I'll need some assistance from the bio-chem section of the Spec-list to articulate this better.
From Kim Zussman:
Doing same as Alex Castaldo, using SPY daily change (cl-cl) as independent and FUNDX as dependent gave different resluts:
Regression Analysis: FUNDX versus SPY ret, SPY-1, SPY-2
The regression equation is FUNDX = 0.000383 + 0.188 SPY ret - 0.0502 SPY-1 - 0.0313 SPY-2
Predictor Coef SE Coef T P
Constant 0.000383 0.00029 1.35 0.179
SPY ret 0.187620 0.03120 6.01 0.000* SPY-1 -0.050180 0.03136 -1.60 0.110 SPY-2 -0.031250 0.03121 -1.00 0.317 *(contemporaneous)
S = 0.00970927 R-Sq = 3.2% R-Sq (adj) = 3.0%
Perhaps FUNDX vs a tradeable index is the explanation.
Feb
7
A New Regime, by Victor Niederhoffer
February 7, 2007 | 1 Comment
The stock market has emerged in last 5 days and it isn't captured, I dont think, by the normal things. Here are the high and low closes for recent days:
date open high low close
206 1454.0 1454.8 1447.8 1453.3
205 1451.5 1454.0 1448.1 1453.7
202 1452.2 1454.0 1448.1 1453.7
201 1446.3 1451.7 1444.0 1450.8
The average absolute change in highs, lows, and closed, from day to day, is 1. This has to be an all time non-holiday low. IBM also is trading at exactly 100 after swinging back and forth 4 times in last month above and below. What does it portend?
Not having any keys, although I do have the book by Ken Follett, I would like to consider some childlike questions about it. Others might think about this and the generalizations of same, I think, with value.
Sushil Kedia writes:
The lull before the storm. A single day's behaviour such as this would be dismissed as indecision.
Similarly, a second day would, at best, be termed market failed to get out of its indecision.
A third day again like this would make one tilt towards thinking the simplest of possible explanations, that a lull often is seen before the storm.
As distinct from any breakouts, which might not exist for a profit seeker, a simpler visualization appeals here. In ball games, from a football to a cricket ball, the point in the trajectory where a noticeable spin seems to be developing is a similar moment of quickly vanishing lull. Not a point of reversal, not a point of inflexion, just a point where the mistress will try to shuffle out the maximum number of players diving in either direction.
I clearly have no clue how I could translate this string of thought into a testable hypothesis.
Kim Zussman writes:
SPY, daily partitioned into 10d non-overlapping periods (from today's close) back to 2000; every 10d period checked standard deviation of daily closes, return for this 10 days, and return for next 10d.
Ten day return regressed against concurrent 10d standard deviation was negatively correlated (T=-1.9). Regression of next 10d return against prior 10d standard deviation and return showed positive correlation with prior standard deviation (t=1.8), and slight positive with prior 10d return (t=0.9).
Going to 5d non-overlapping, the current 5d standard deviation is 6th lowest of 352. The same regressions showed different results, with slight/NS correlation between 5d returns and concurrent standard deviation. The multiple regressions for next 5d return showed significant negative correlation with prior 5d return (t=-3), and slight positive/NS with prior 5d standard deviation (t=0.24).
So it looks like over short intervals, SPY returns related more to prior returns than volatility; but in longer intervals prior standard deviation is more important.
Vincent Andres writes:
"The average absolute change in highs, lows, and closed, from day to day, is 1. This has to be an all time non-holiday low. IBM also is trading at exactly 100 after swinging back and forth 4 times in last month above and below. What does it portend?
Not having any keys, although I do have the book by Ken Follett, I would like to consider some childlike questions about it. Others might think about this and the generalizations of same, I think, with value."
Some related thoughts:

1.) K. Lorenz often put emphasis on the pair: stimulus and duration (and duration is often considered on spec list). Not surprisingly, in general, the longer the duration, the smaller the needed stimulus to provoke an identical reaction. Maybe wrong, but I wouldn't be surprised if duration were often a good candidate to explain our stats, residues, and even more.
On more elaborated stimuli, K. Lorenz and Tinbergen speaks about "triggering schema" (schéma déclencheur). This concept may be an appropriate frame for some of our stimuli. Tinbergen got the Nobel Prize with Lorenz and Frisch. R. Dawkins was a student of Tinbergen.
2.) Remembering the previous "trend" thread, we may consider non-trending phases as quite rare events. So, if the stimulus part alone is rare, this seems a condition propitious for the whole pattern being non-random.
Apologies, no counts (… not yet).
PS: "I have found the missing link between the higher ape and civilized man: It is we." K. Lorenz.
Feb
5
Pain Frequency By Kim Zussman
February 5, 2007 | Leave a Comment
On 2/5/07, Andrea Ravano wrote:
Evidence from Capuchin Monkey Trading behavior: The study confirms for animals, what behavioral studies have shown for human beings; that to offset a loss of 1 you must have a profit 2.5 times as big. In other words the perception of your pain is greater than that of your pleasure.
That pain of loss is 2.5 greater than pleasure of gain, in absolute terms, has been bandied about in literature for a while. What is the nature of a trader's state of mind as a function of trading (or more specifically, position checking) frequency?
One check on this is to look at the effect of multiplying losses by 2, and comparing with gains scaled at 1. Using SPY returns since 1993, checked average returns for daily, weekly, and monthly intervals:
Daily Weekly Monthly
Ave: -0.003 -0.005 -0.002
Pos: 1855 411 411
Tot: 3529 730 169
%Pos: 52 56 65
When the "effect" of losses on your soul is double that of gains, you are suffering, on average, in all intervals. Therefore, it is no coincidence there are so many psychologists/psychiatrists involved in trading. Percentage of the positive, however, scales up with longer intervals, so you feel bad less often.
Philip McDonnell adds:
Consider what happens when you lose: How much is required to break even?
Loss Required Gain Ratio
-20% 25% 1.25
-25 33.3% 1.33
-50 100 2.00
-75 300 4.00
Average Ratio 2.15
The ratio of how much is required to break even rises rapidly as the losses increase. Although the above unscientific data points appear to be in the ball park of the putative 2.5 ratio, the underlying ratios are clearly non-linear and NOT well described by a simple number. In fact any simple ratio is far too simplistic to be a good measure.
I would argue that a log linear utility function is what an investor, and any rational individual, would want. In their famous paper on Prospect Theory, Kahnemann and Tversky identified what appeared to be irrational behavior on the part of university students and some faculty when presented with hypothetical bets. The Nobel Prize winning professors concluded that the students chose irrationally as compared to the Gold standard of statistical expectations based on an arithmetic utility of money.
But if money compounds, one would want a log utility of money. When the examples cited in the study were recalculated with a log utility based on the relative net worth of typical students the results showed that the student subjects were invariably quite consistent with a log utility function. This re-opens the question: Were the subjects or the professors the irrational ones?
If one expresses the gains and losses in the above table as the natural log of the price relative, then the negative logs of the losses exactly cancel the logs of the gains.
Charles Pennington adds:
These experiments that psychology professors run on students invariably involve the students' winning or losing maybe $100 or less. That's a small amount by any reasonable metric.
$100 is very small, for example, compared with their first year's salary out of school. So it's quite reasonable for the professors to assume that the amount is in the limit of a "small" amount, in the sense that it (1+x) is approximately x if x is "small."
Any reasonable person, offered the opportunity to bet with a 50% chance of winning $250 and a 50% chance of losing $100, should take the bet. That's true even if he only has $250 to his name, because he also has prospects for future earnings.
In this case, the professors are more rational than the monkeys.
J. T. Holley wrote:
"Could it be that all the bruised and battered hold-outs from '00 - '03 will finally join in, and we resume the incessant trek toward the summit of market-based capitalism?" kz
How about this simple fact: For the first time in recent years that I can remember, the Dow and S&P indexes (headline purposes) outperformed the price appreciation, across America, of houses or real estate. This is roughly a two to one ratio. Now for the sake of simplicity, how many of the '00 - '03 bruised and battered people are going to scratch their heads and say, "twice as much, huh?"
I think the "Confidence Index" mentioned by Carret has a ways to go fellas; but this must obviously be tested.
Philip McDonnell adds:
"Any reasonable person, offered the opportunity to bet with a 50% chance of winning $250 and a 50% chance of losing $100, should take the bet, and that's true even if he only has $250 to his name, because he also has prospects for FUTURE earnings."
I would agree that future earnings can be and perhaps should be factored in. But to a freshman with $100 (not $250) the 50% chance of no beer, pizza, and dating for four years might seem an unacceptable risk. Losing it all results in a utility of Ln (zero), the way I look at things. Ln asymptotically approaches negative infinity.
A few points:
1. KT did include some bets in the thousands of dollars.
2. Most of the KT bets were fairly close calls even viewed from an expected arithmetic value as opposed to a log utility.
3. KT never concluded that the indifference ratio was 2.5 or any other number in their ground-breaking paper.
Feb
5
Sunny Days, by Kim Zussman
February 5, 2007 | Leave a Comment
Currently we have strong earnings, tame inflation, a smug Fed showing signs of a Bernanke-put, high productivity without wage pressure, declining oil and commodity prices, new all-time high on Dow, new six year high on SP500, stock earnings yield higher than bonds, and near record low volatility. Tests of new highs, big advances, and consecutive up-months don't show any signs of trouble ahead.
Could it be that all the bruised and battered hold-outs from '00-'03 will finally join in and we resume the incessant trek toward the summit of market-based capitalism?
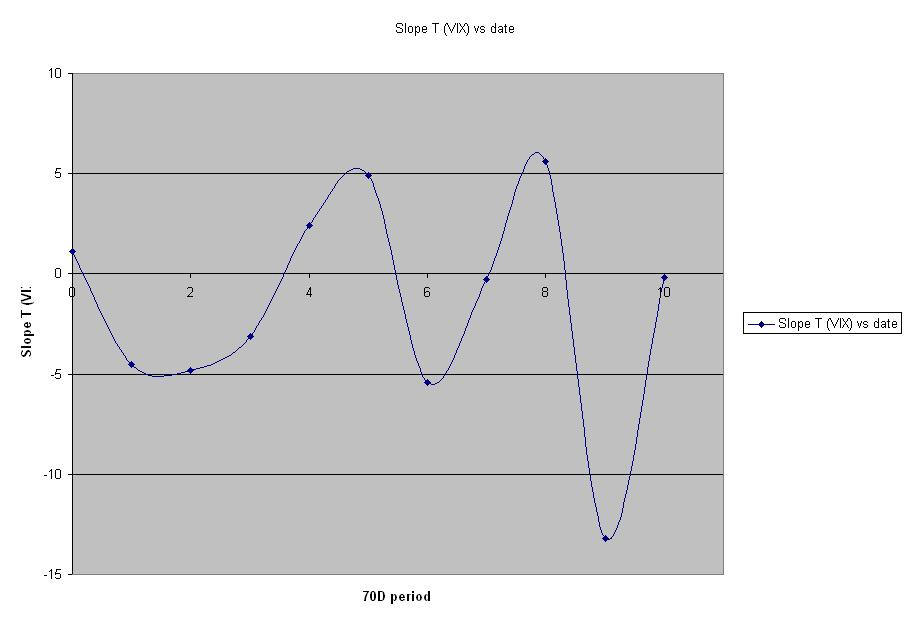
Looking further into VIX, partitioned daily VIX closes into ten non-overlapping 70 day periods, 1/04-present. For each period, the regressed VIX vs. date is shown, and it is noted whether the slope of the fitted line was significant (i.e. T<-2 means VIX declined significantly, T>2 means it went up). Here is the data for the ten periods, shown with corresponding slope T score:
Date VIX slopeT
10 -0.2 (period ending at present)
9 -13.2
8 5.6
7 -0.3
6 -5.4
5 4.9
4 2.4
3 -3.1
2 -4.8
1 -4.5
0 1.1 (starting 1/04)
These line segments follow rise and declines in volatility, as well as "flat" periods like the current one. Last summer's volatility spike shows in period eight, T = 5.6, followed famously by the decline of period nine (T = -13.2). Although there does appear to be some periodicity (see roller-coaster diagram), there are also consecutive runs of up and down slope.
Feb
2
How Often Do You Never Lose In 10 Years?, by Kim Zussman
February 2, 2007 | Leave a Comment
If you had bought the SP500 index at the end of each calendar week since 1950, in the ten years subsequent to each buy, how much of the time would you never go negative?
Using SP500 weekly closes up until 520 weeks ago (7/8/96), 277/2428 buys never saw red (11.4%). Another way to look at it is that for long-term investors, about 8/9 weekly stock purchases were underwater at some time during the next ten years.
This sounds rather unpleasant for holders of buying, however the return for the ten years (overlapping, for all weeks) averaged +40%, with 96% positive. The few negatives were the unlucky folks (like parents of someone close) who bought stocks in the mid 60's and held them to the mid-70's.
In memory of such long extinct anguish, here are the buy weeks which lost ten years later:
Date 10y ret
03/16/64 -0.21 (-21%)
05/18/64 -0.19
03/09/64 -0.18
05/25/64 -0.17
02/24/64 -0.16
06/08/64 -0.16
06/01/64 -0.15
05/04/64 -0.15
06/29/64 -0.14
05/11/64 -0.14
06/15/64 -0.13
07/06/64 -0.12
04/06/64 -0.12
06/22/64 -0.11
03/02/64 -0.10
04/27/64 -0.10
03/23/64 -0.10
03/30/64 -0.10
07/13/64 -0.08
04/13/64 -0.08
07/31/67 -0.08
02/17/64 -0.08
08/14/67 -0.08
09/11/67 -0.07
02/03/64 -0.07
09/18/67 -0.07
08/07/67 -0.07
02/10/64 -0.07
11/12/68 -0.06
04/20/64 -0.06
11/25/68 -0.06
07/20/64 -0.06
10/21/68 -0.05
09/05/67 -0.05
06/10/68 -0.05
12/02/68 -0.05
06/03/68 -0.05
02/23/65 -0.05
07/17/67 -0.05
07/24/67 -0.05
11/18/68 -0.05
07/10/67 -0.04
12/09/68 -0.04
04/29/68 -0.04
08/21/67 -0.04
10/14/68 -0.04
09/25/67 -0.04
08/28/67 -0.04
11/04/68 -0.04
02/01/65 -0.03
05/27/68 -0.03
09/14/64 -0.03
10/28/68 -0.03
10/02/67 -0.03
05/06/68 -0.03
12/16/68 -0.03
04/22/68 -0.03
09/30/68 -0.02
12/23/68 -0.02
05/17/65 -0.02
12/30/68 -0.02
07/27/64 -0.02
04/08/68 -0.02
07/03/67 -0.02
01/27/64 -0.02
08/12/68 -0.02
06/17/68 -0.02
01/25/65 -0.01
10/07/68 -0.01
03/08/65 -0.01
07/01/68 -0.01
04/07/69 -0.01
03/01/65 -0.01
06/26/67 -0.01
03/15/65 -0.01
07/15/68 -0.01
08/10/64 -0.01
01/18/65 -0.01
04/17/67 -0.01
02/15/65 -0.01
05/24/65 -0.01
05/13/68 -0.01
05/20/68 -0.01
Jan
30
Wait for a Big Date, by Kim Zussman
January 30, 2007 | Leave a Comment
Daily declines/advances bigger than 1% in SPY (close-close) were checked from 1/04 - present. Counting number of trading days between such moves, regressed wait time (days) vs. date:
Regression Analysis: wait versus Date
The regression equation is wait = - 252 + 0.00675 Date
Predictor Coef SE Coef T P
Constant -252.41 84.57 -2.98 0.004
Date 0.0067 0.0022 3.07 0.003
S = 7.11891 R-Sq = 8.1% R-Sq(adj) = 7.2
i.e., the wait time between big dates has increased in the period, which is consistent with (and correlates with, not shown) decline in standard deviation (volatility) in the period.
Here are the big dates:
Date big wait
01/25/07 -0.012 37
11/29/06 0.010 2
11/27/06 -0.014 14
11/06/06 0.011 23
10/04/06 0.012 35
08/15/06 0.012 16
07/24/06 0.018 3
07/19/06 0.014 4
07/13/06 -0.016 1
07/12/06 -0.011 8
06/29/06 0.020 10
06/15/06 0.021 2
06/13/06 -0.012 1
06/12/06 -0.011 5
06/05/06 -0.015 3
05/31/06 0.011 1
05/30/06 -0.018 2
05/25/06 0.012 6
05/17/06 -0.019 3
05/12/06 -0.013 1
05/11/06 -0.012 17
04/18/06 0.016 6
04/07/06 -0.010 18
03/14/06 0.010 19
02/14/06 0.011 8
02/02/06 -0.012 9
01/20/06 -0.018 12
01/03/06 0.018 4
12/27/05 -0.010 17
12/01/05 0.010 20
11/02/05 0.010 3
10/28/05 0.014 1
10/27/05 -0.011 3
10/24/05 0.015 2
10/20/05 -0.018 1
10/19/05 0.017 1
10/18/05 -0.011 2
10/14/05 0.011 7
10/05/05 -0.013 1
10/04/05 -0.011 20
09/06/05 0.012 3
08/31/05 0.013 11
08/16/05 -0.013 27
07/08/05 0.011 10
06/23/05 -0.014 25
05/18/05 0.010 4
05/12/05 -0.011 2
05/10/05 -0.010 7
04/29/05 0.014 1
04/28/05 -0.013 5
04/21/05 0.019 1
04/20/05 -0.014 3
04/15/05 -0.014 1
04/14/05 -0.013 1
04/13/05 -0.012 3
04/08/05 -0.010 7
03/30/05 0.014 5
03/22/05 -0.010 9
03/09/05 -0.011 3
03/04/05 0.012 8
02/22/05 -0.015 11
02/04/05 0.011 12
01/19/05 -0.010 1
01/18/05 0.010 9
01/04/05 -0.012 23
12/01/04 0.011 7
11/19/04 -0.011 11
11/04/04 0.014 1
11/03/04 0.013 5
10/27/04 0.012 1
10/26/04 0.015 2
10/22/04 -0.011 11
10/07/04 -0.011 4
10/01/04 0.017 7
09/22/04 -0.013 13
09/02/04 0.011 11
08/18/04 0.010 2
08/16/04 0.010 2
08/12/04 -0.011 2
08/10/04 0.013 2
08/06/04 -0.014 1
08/05/04 -0.016 11
07/21/04 -0.018 1
07/20/04 0.013 12
07/01/04 -0.014 17
06/07/04 0.015 8
05/25/04 0.014 11
05/10/04 -0.010 1
05/07/04 -0.016 4
05/03/04 0.011 3
04/28/04 -0.013 4
04/22/04 0.014 2
04/20/04 -0.017 5
04/13/04 -0.014 10
03/29/04 0.014 2
03/25/04 0.013 3
03/22/04 -0.013 1
03/19/04 -0.014 2
03/17/04 0.011 2
03/15/04 -0.012 1
03/12/04 0.013 1
03/11/04 -0.013 1
03/10/04 -0.017 2
03/08/04 -0.012 17
02/11/04 0.011 3
02/06/04 0.011 7
01/28/04 -0.011 1
01/27/04 -0.010 1
01/26/04 0.013 14
Jan
26
Tenacity of Assessments, by the President of the Old Speculator’s Club
January 26, 2007 | Leave a Comment
The president has been reluctant to say much as he finds himself (once again) taking a side of the trade that the Chair finds disadvantageous. Specifically, it's a portfolio (it has been alleged) way overweight in natural resources. I dislike recording how these positions have turned out or how I believe they will do in the near or distant future.
Not for nothing do I have a file labeled "Dumb Posts," which seeks to track rash assessments made by various members (myself included). I have had opportunities to dredge these up when developments have proved them most embarrassing, but have over-ridden my animal spirits as I see no profit in it.
But as I check my portfolio against that of my wife (for whom I invest), I find that Marty Whitman was correct when he postulated that "I make more money just sitting on my ass." Her account has done marvelously well, but with infrequent trades throughout the year. Positions I long ago exited remain in her account with triple digit gains. On the one hand, I'm embarrassed by my lack of discipline, but on the other hand, I still have my tenacity in believing in my original assessment.
So, many mallards for her with the 20 gauge single shot. Far fewer for myself with a 12 gauge pump.
– Jack Tierney
Scott Brooks comments:
I never think how easy it is to kill a deer, just like I never think of how easy it is to make money in the markets. It simply isn't.
Sure, if I sit in the deer stand long enough, I will kill a deer … all I've got to do is sit long enough through all kinds of weather … bad conditions, good conditions and everything in between. The long term positive drift of the deer will eventually bring enough deer within range and I'll get enough shots so that eventually, I'll get a deer.
The same is true of the markets. Jack wrote a wonderful piece today and referenced his wife who has more of a buy and hold strategy … letting the long term positive drift of the market bring her positive returns.
There are some that just need to be satisfied with simply achieving investment success by sitting in the long term positive drift of the market … heck most money managers don't beat the market … why … because it's hard … really, really, hard!
You have to set your goals, set your standards, and be realistic about what you are capable of achieving. Always strive to push yourself, but don't try to achieve more than your capable of. I was a good high jumper in college, but I was never going to jump higher than 6' 8". That was the best I could do … and it wasn't good enough at that level … so I gave up high jumping and concentrated on my studies.
Did I fail? No! As a matter of fact, I never felt that I failed at that endeavor, rather I believed that I had succeeded greatly … I jumped much higher than I ever thought I could.
Most hunters are satisfied that they have shot a deer. I revel in their success! I love it when they get their deer! I take pleasure in their pleasure. Even though I take pleasure in others financial success, I don't judge my success by their standards. I set my own standards and work to achieve them.
When I feel like I'm getting in a slump, I force myself to fight through it. I have several things that I do to get through these phases.
I force myself to assess what I've been doing. Invariably, I'll find that I've gotten lazy about the "little stuff." For instance, in deer hunting, I can do all the macro work in the world on my farm. I can plant all kinds of food plots. I can hang stands on heavily used travel corridors, and practice with the bow until I'm dead nuts on for any shot up to 50 yards. I can then think about how I'm gonna go out and kill that big buck.
But all of that won't matter if I haven't paid attention to the smallest details … for instance, I refer you to my recent post on camouflage and the importance of scent control … maybe I forgot to take the neck strap off my binoculars and wash them in scent free soap in the wash machine. I know that sounds pretty trivial, but if I'm gonna kill that big buck (beat the markets), I have to pay attention to this kind of little seemingly insignificant detail.
I've taken what I've learned on the Daily Spec and applied it to my investment philosophy. I've always been a technical analyst. I love charts. I still love to look at them. But now I test them empirically by counting.
But, to be honest with you, I don't like counting that much. Sure, I can do it … but I don't like it. So I hired a quant to do the calculations on the hypotheses that I developed to improve my trading systems. Most of my hypotheses turn out to be a load of hooey … but every once in a while, I come up with something that improves my view of the systems.
As I become a better counter (yes, even though I don't like it, I force myself to learn it, do it, and get better at it), my mind is opened up to new possibilities that I otherwise would have likely never seen.
I also have a belief system. No, I'm not talking about religion … I'm talking about believing in myself and what I'm capable of doing. A long time ago, I read Napoleon Hill's book, Think and Grow Rich, and took it to heart when he said,
The dominant thought you hold in your mind will manifest itself in your life in some form of outward reality!
I've never forgotten that.
I've experienced the power of that belief in my life recently. A few months ago, I took into consideration the stock in my life and where I was at in the world and then compared that to where I believed I should be based on my skills, drive, and intellect … and I found myself coming up short.
I didn't like that. Not at all. So I planted the seed in my mind to look for opportunity, to look for the world to deliver me the opportunities that I was looking for … ok, so the world doesn't really knock on my door and say, "Delivery for Mr. Brooks." But I am surrounded by opportunities … all around me … and I have to tune my mind properly to be able to see them. I have to be in the right state of mind, otherwise, I simply won't see the opportunities that abound around me.
Eventually, my mind sees the opportunities, filters them, and arranges them in a fashion that makes sense, and Viola, I clearly see what I'd been missing before.
So it starts with a belief in yourself … an unbending belief that you will succeed and get what you want. Then it comes down to a meticulous attention to detail, and notice that nowhere did I think it was going to be easy!
There are other steps, but I think that's a good start.
Kim Zussman adds:
'All wives are buy and hold cause if you wanna hold 'em, ya gotta … never mind.
Specs are familiar with friends and family who know next to nothing about markets, but due to a combination of luck and inaction, wind up beating your pants off (in certain periods). Jack mentioned stocks his wife held which he had regrettably sold below current prices.
Of course anyone looking at sells occurring in '01-'02 in most cases can kick themselves now. However one recalls a similar sport undertaken as a balm in 2002 when looking at sells from '00-'01 and noting how much lower they became since settling.
The knife cuts both ways (though upward trend makes one side sharper), and perhaps analysis of closed regrets contains some predictive value.
Sam Humbert comments:
friends and family who know next to nothing about markets, but due to combination of luck and inaction …
One of my 'thoughts in the shower' recently was: why is "inaction" so lionized in discussions of stockholdings? A standard financial press trope is "oldster who has a cache of stocks from 1950 now worth $x million," as if it's a tremendous triumph of skill/willpower/perspicacity to throw some stocks into the oubliette.
It clearly requires no skill/willpower to hold "stuff" in general. I have an old pair of skis in the basement — last used them 15 years ago, and with the warm Vermont winters nowadays I may never use them again. They'll be in my basement till whenever (if ever) I get around to eBaying them.
So what's the big deal about inaction? The cause for pride?
Jan
25
Looks Like Uncle Roy is Right, by Kim Zussman
January 25, 2007 | Leave a Comment
Here is the data for the cases when prior 20 week returns were greater than +10%:
Date stdev hi chg hi nxt
11/22/82 0.037 0.239 0.177
08/04/80 0.019 0.208 0.105
02/09/87 0.015 0.204 0.093
03/23/98 0.024 0.181 -0.030
04/11/83 0.016 0.177 0.039
04/29/91 0.021 0.165 0.019
12/28/98 0.032 0.157 0.082
01/27/97 0.016 0.155 0.143
08/11/03 0.016 0.147 0.119
05/30/89 0.015 0.147 0.066
06/16/97 0.023 0.143 0.032
07/17/95 0.011 0.140 0.115
07/10/00 0.039 0.132 -0.129
05/05/86 0.023 0.128 -0.024
12/29/03 0.015 0.119 -0.013
12/04/95 0.009 0.115 0.058
04/04/88 0.033 0.113 -0.036
12/22/80 0.026 0.105 -0.032
12/16/85 0.014 0.102 0.128
Note that currently we are at the end of a 20 week gain of 10.9%, which had a weekly standard deviation of 0.009 (tied for low in 1995).
Alex Castaldo comments:
Overlapping returns are correlated, and therefore the normal statistical procedures that we use with independent variables are not applicable, and will give misleading results. Either we switch to non-overlapping periods or we have to make adjustments for overlap (which is tricky).
The example that Prof. Andrew Lo likes to give is the computation of 20-year returns from monthly CRSP data.
Here is an example of a flawed study: First we calculate the stock market return from January-1926 to December-1945 (20 years). It is a very nice positive number, about 8% I believe. Then we calculate February-1926 to January-1946, and so forth until January-1987 to December-2006. A total of 62 twenty year (overlapping) periods are examined. If only two of these periods have negative returns (hypothetically), then we conclude: the probability of losing money when you invest for 20 years is 2/62.
This result is completely bogus due to overlap. We have not really tested 62 independent periods, so the use of 62 in the denominator is not valid. The periods used are highly overlapping; for example January-1926 to December-1945 and February-1926 to January-1946 are almost the same. They differ only by the dropping of January-1926 and the addition of January-1946. The returns differ by a few percentage points at most. In some sense, the second period is not telling us much that we don't already know from the first; the reason we like independent variables is that each brings us the same amount of new information.
A more correct approach is to note that the period from January-1926 to the present contains only about 4.05 nonoverlapping twenty year periods. We could then look at how many of these are positive or negative. (Of course the strength of any conclusions drawn from four observations will not be very high).
Scott Brooks adds:
This conversation reminds me of tracking deer when bowhunting. When I arrow a deer, it will usually expire in less than thirty seconds, almost always within five to ten seconds. However, in that ten seconds, it can run a long way and disappear into the brush.
Sometimes the blood trail is obvious, other times it's not.
When I'm on the trail of a non-obvious blood trail, I have to employ different methods of looking for the deer. To make a long story short, I slowly walk down what I think is the trail, taking one step and stopping. I then look around 360 degrees … searching very slowly, breaking my surroundings up into mental grids, and scanning those grids carefully.
Then, before I take another step, I squat down so that my line of sight is about three feet off the ground, and then I repeat the 360 degree scan, mental grids and all.
After that, I get down on my hands and knees and carefully scan the area as close the ground as I can, especially looking ahead in the area where I'm about to step (when I move forward on the trail) to make sure there isn't the slightest bit of sign that could lead me to the deer (that I would have otherwise destroyed with my boot if I took my next step forward).
I then step forward and repeat the process.
The point I'm trying to make is this: Isn't what Kim Zussman did just one way of looking at the "landscape" of the market? His calculations of non-overlapping time frames were the equivalent of looking at one grid of the "market landscape," and looking from an upright point of view.
The professor then suggested non-overlapping periods. In my mind's eye, I see that as squatting down and looking at the same market landscape, but from a different view … and from that view, we see the same landscape but in a whole different way.
Both methodologies would seem to have value. Just as in tracking a deer, I may see "what I'm missing" or the "key piece of data." For instance:
a slight hoof indention in the ground - extra volume,
a drop of blood - over selling on fear of some nebulous announcement or rumor (see George Zachar's post, Deception of Taxonomy Notation)
a bent branch - a large money manager is trying to build/unload a position in stealth mode … without alerting the market
a pool of blood where the deer laid down (meaning that you didn't get as good a shot as you thought and you pushed the deer out of it's bed by tracking it too soon … mark that spot, backtrack carefully out of the woods and don't come back for at least three hours) - A bad announcement caused a stock to be driven down. The bloodied stock found support, but then continued to move down (maybe it's time to wait for this buy … no bottom feeding today … come back tomorrow and take a look).
a bunch of crows and buzzards in the area - time to go in and see if you can at least salvage the antlers … and then let the scavengers pick the bones clean. Even though I didn't get the meat, the trophy antlers will look good on the wall - Too late for a profit, unless your a scavenger … however, maybe you can find some talent within that company (every company has some talent). Watch where they go and see if there is a VC or an IPO opportunity!
That's why looking at the market from different angles in a meticulous, orderly and objective manner is so important. What works for deer hunting also works for investing/trading/advising!
Jan
24
Bears Are Insignificant, by Kim Zussman
January 24, 2007 | Leave a Comment
Recalling that SPY weeks in bear market of '00-'03 did not reverse nor continue significantly (correlation insignificant), but bull '03-'07 did reverse (significant negative correlation), what made this happen? This question was analyzed by isolating responses following up and down weeks in both markets:
MKT UP CORR UP RSQ DN CORR DN RSQ
BEAR 0.39 0.148 -0.13 0.017
BULL -0.03 0.001 -0.05 0.003
The bull market showed slight reversal after both up and down weeks, the same direction of which combined to form a significant negative correlation.
Paradoxically, the bear market had a positive correlation after up weeks (up followed up), and moderate reversal of down weeks. The combination made the overall correlation insignificant.
So at least on a week-to-week basis, bear markets trend positively after up weeks and bull markets tend to reverse both up and down weeks (like eels swimming up a river).
Jan
22
Path Dependence, by J.T. Holley
January 22, 2007 | 3 Comments
Yes, there are two paths you can go by, but in the long run, there's still time to change the road you're on and it makes me wonder. –Led Zeppelin's Stairway to Heaven
I've since felt that those lyrics were trading lyrics. What a song that has such sweet convergences and divergences. Many references to the Mistress, and yes, what a capitalistic ending that she's actually "buying" the Stairway.
James Sogi comments:
From a dialogue this weekend:
A: It was nice we met 35 years ago. It was like fate.
Q: What if you had a little GPS unit that told you where in life you were?
A: Well it wouldn't matter because things would be fated and you would go where you would go no matter what.
Well, there is no fate, but there is causation and timing, so the question always arises, "When is the best time to jump in and the best time to jump out of a trade?" Or in navigation, "what is the best course to take and when?"
While reading "Cake Cutting Algorithms" this weekend by Robertson and Welsh, I discovered that there were a few main methods of dividing a cake or object of desire among two or more fairly, which is applicable to markets as well. There is the basic cut and choose. The other is the moving knife. Variations include multiple cuts and choices. The parties yell stop when they feel their fair share has come, but if they wait too long, someone else will yell stop before them, leaving the waiter with less. The net result is to evenly divide the pie based on each person's self interest, but the individual's goal is to get the most cake. There is the trimming variation where one party goes away happy with a piece and the remaining trims up the remains. As in life and in the markets, the question is, when is it not in the abstract, but in competition with others? The path dependency would be simple in isolation, i.e. deciding when to eat dinner by yourself is easy, but with a group of eight is very hard. Try to arrange a meeting with six people.
When is the best time to buy a falling market? If you wait too long, others jump in before you and get a better price. Jump in too soon and you get inspired to write a haiku. When is the best time to sell your holding? If you wait too long, you might lose your profits. If you make too many cuts, then you end up with crumbs not a slice (i.e. vig. eats you up). The approach of the Bayesians takes into account the subjective, which is pertinent. The question on paths still is the following: Is there a sweet spot in each cycle that will maximize the trade? We want to know where the the right spot and the right amount is, but it is always in competition with others. In terms of counting a minimum number of cuts to fairly divide a cake, it takes at least two cuts to divide a cake three ways, and six cuts to divide it five ways. No wonder there are so many trades in a market to determine a price at the end of the day. If you take the situation where unequal portions are to be divided, different considerations are at play since the pieces are not interchangeable. Also, consider taking the benefit of disagreements that sometimes allows for fair division. In the market, if there were no disagreements, there would be no trades! Only the disagreement in value allows a trade to be made. At the moment of the trade, each trader is happy with the transaction. Only subsequent paths will lead to happiness or a haiku or both.
Kim Zussman offers:
Isn't this directly related to regression to the mean?
A student gets 100 on the first exam, but the next three are 80's and 90's, i.e. the first result was "luck" (good day, coincidental study with questions, etc.), but over many trials he approaches his true position in rank. This is discussed often with kids in school to help with setbacks and to point out how long it takes to become truly accomplished.
Life is like that. There is little you can do about who your parents are, where you live, who you meet; there are so many paths. But if you are consistently honest, hard working, and you try to get along, on average and in the long run, you will wind up approximately at the correct level.
Victor Niederhoffer adds:
Occasionally, I think back and forth in my life and everything that happened since is related to that. For example, Gail Niederhoffer, was a very good impersonator and used to call up people when she was nine and pretend she was someone famous. She did this with a reporter four times, and told him that he should investigate those people at NCZ who forecast stock prices with an accountant. Graham loves reading the article. He had traded for the palindrome. After we were introduced, I started trading bonds and currencies and stocks for him, and one of my jobs was to vet quant things there. And one such quant through the palindrome came to my office to discuss his sure thing for options. Ha. The rest of the story … but if Zeck wasn't my tutor at Quincy House, I wouldn't have met Gail at his wedding, nor would I have met Susan nor would any of my subsequent seven been born. It's like that for everyone and for every trade. But for causation, it's a very tricky thing. What's unseen is what would have happened without those forks. If I hadn't ever sent Doc Bo to visit the brothels of the SE Asian country with the PHD from northwestern in key posts, I might be still playing tennis with the Palindrome, and having a home in the Hamptons. Path dependence in markets is a key factor to consider and deserves to be modeled and systematized.
Stefan Jovanovich adds:
Morgan, a devout Episcopalian, believed that character was fate and that one's character was shaped by the people one knew and worked with and their characters, and in turn, by the people they knew and worked with. In that regard, he seems to have been like the man who believed that the cosmos rested on the back of a giant turtle. When asked what the turtle stood on, his reply was "It's turtles all the way down." Morgan thought it was character all the way down. His religious belief, IMNSHO, was formed most by the faith of his first wife.
Jan
15
Review of an Upcoming Book, by Kim Zussman
January 15, 2007 | Leave a Comment
This could be interesting since it describes non-market influences on the economy as a result of the computing/web revolution. Read Wealth Without Markets?
Jan
14
Typed by the Heat of the Fire, by Kim Zussman
January 14, 2007 | Leave a Comment
The heater is worn out and broken, and it is cold for winter even in California. There is ice outside on the walk, but it is toasty inside.
Today the college daughter travels back east after the holiday to complete her freshman year; one of those bitter-sweet times when the cycle of life shows itself.
The girls were little when we got this old house, and one of the first projects was to replace the heating and air-conditioning system. It was an industrial strength unit which was billed as "The Only One You Will Ever Need." Winters are not often harsh but summer can be brutal; especially many years ago when the numerous trees were too small to make much shade. Over the years, both air conditioning and heating were used to much advantage tempering the little women.
A few summers ago, we set up a badminton net in the yard under a large pine tree which cast a good playing shade. Sometimes the tree caused interference, and with considerable effort and ladder-balancing, errant limbs were cut to clear a path for the shuttlecock (favorite risk-related thoughts while juggling the chainsaw involved the inner voice "What a Shame He Didn't Hire Someone"). Like other family sports, this little investment diffused many teen crises, and led to much togetherness and memories sweet like the air from the pines. Often while playing, we would discuss where to apply to college and about all the different schools. Looking back, it is strange how at the time, these plans seemed so fantastic and remote.
The big pine was rooted on a hill over the yard in direct view of the kitchen window. Each year we watched the tree grow vigorously. It is so impressive how these living things reach up and thrive on just a little water, air, and sun. A wooden birdhouse hung from one of its branches and was used as a bird feeder. Over time, the tilt of the house confirmed what was happening: the tree was leaning. By now, the pine was 30 feet tall, had an 18 inch trunk, and was listing precariously toward the roof of our home. The hill where it was rooted was rocky, and it was decided that we should not risk testing the tree through the next storm season, so I had it cut down.
They were a crew of Hispanic men with ropes, chainsaws, and a chipping truck. They grappled, climbed, and dismembered our old friend within an hour. As instructed, they made him into fire logs, and stacked them neatly along the deck. Some were so large that they served as benches by the hammock. Now after two years, the wood has dried sufficiently to fuel an excellent fire, which has given respite from the current cold snap. The stored energy of sunny days spent swatting the badminton, chatting and laughing, now pours back into the living room where I just said goodbye to a young lady until another summer day.
Jan
13
A Part Time Trader, by Paolo Pezzutti
January 13, 2007 | 1 Comment
It's a hard life trying to outperform the stock market indexes. Most of the time these traders do not have tested systems or, if they have done some testing, it is likely that the methodology used has some shortfalls. But let's suppose that everything is fine, and that they have managed to find a niche of market inefficiency which can be exploited by a small flexible trader in and out of the market very quickly. The problem is that a part time trader goes to work in the morning, participates in meetings, travels, etc. Sometimes the boss calls him/her right when the setup is there to be traded! When the system gives a buy/sell signal, he/she is not there to trade it. The lack of consistency is the main issue. For a European trader, it is even worse. Markets in the US open 15:30 European time and close at 22:00. The European part time trader goes home when US markets are open and finds the family "requirements" to be met often more demanding than those of the office work. He/she has to help the kids with their homework, the wife/husband with things to do, dinner time, friends after dinner, etc. Being consistent with the trading plan is almost impossible even for the most determined and focused part time trader. Moreover, when they go on holiday, no trading is possible unless they want to divorce. At the end of the day, although their system works fine and they are very disciplined traders, there is no way to outperform the market simply because they were not there to trade their systems.
Maybe the solution is to give up trading, buying an ETF and spend more time with the family.
Kim Zussman comments:
Yes, but there can be advantages to the part-time vantage:
1. Not looking at markets all day reduces over-trading. The more you look at moment-to-moment moves, the more tempting it is to mistake them for opportunities.
2. Long-term patterns and anomalies are generally more profitable because they integrate more risk and less vig.
3. Personal diversification: Necessarily, frequent losing trades are extremely painful, and it is nice to have other concurrent professional activities which are rewarding. Be a portfolio with a mix of risky and low risk assets, balanced to suit your psyche.
3a. Cover: Being ridiculed and berated by family and friends is diluted when the income stream is not at stake, and they can more easily forgive difficulties of a second vocation if the first is intact.
4. You can easily run your own hedge or mutual fund while drastically reducing cost and customizing risk to fit your temperament.
4a. If you are certain there are others who can invest much better than you, get past your ego and use them.
5. The market needs you, especially if you trade a lot and make many mistakes, to provide liquidity and profits for smart guys on the other side of your trades.
6. The golf rule: Investing/trading can be more frustrating than golf, but it is 1.5 million times more interesting and will make you a babe magnet.
George Criparacos adds:
As a part time trader, I identify completely with the problems outlined and with the response of Dr. Z. I would humbly like to add that there should not be a target to outperform the market.
Scott Brooks offers:
This is a great post by Kim! There is wisdom here for everyone, even those who are not part time traders. Everyone, even pros and day traders, should cut this out and put it in their playbook. I know I am!
Thanks for this Kim!
Scott Brooks further adds:
It is important to remember that outperforming the market (usually thought of as the S&P 500 … the cap weighted index) is difficult. Most pros don't beat the index.
Maybe your goal would be to create an income stream of 3%/year to live on with a moderate amount of growth to offset some of the effects of inflation.
Maybe your goal is to beat a composite index of stocks and bonds (pick the indices that you think are appropriate).
Maybe you're good enough as a personal trader to accomplish the return goals your looking for and to receive satisfaction from managing your money (kind of like a hobby … but one that is profitable).
I have several clients that have me run a portion of their portfolio while they run the rest. The reason in many cases is that one spouse has nothing to do with the money (usually the wife) and the other spouse likes to invest and is really into it (usually the husband). The husband realizes that if something happens to him, his wife is not just going to take over the portfolio and all of a sudden become an expert in something that she has no interest in. So he has me run a portion of the money so that he can be comfortable with my competence and the wife can have a relationship with someone that she knows and has come to trust.
People can have many goals in the markets. It is imperative that you:
1. Identify what your goals are
2. Figure out a methodology that can accomplish those goals
3. Figure out if you have the time to work that methodology
4. Make sure that a fail safe is in place (i.e. work with a professional if your spouse is not interested, or work with your spouse)
5. Figure out if you have the competence to accomplish your goals
6. Be able to back test your system in the bad times (everyone was bragging about their genius in the 90's … but seem to have lost half their new found IQ since)
7. Have a playbook for how to handle different scenarios (especially what I call lifeboat drills)
8. Be willing to admit that they may not be able to do it
9. Other things that are important that I'm sure I'm missing
10. Make sure that you're having fun if you meet all the above criteria
Steve B. adds:
The part time trader is not the problem or the issue. The part time trader has at his disposal an arsenal of conditional orders that are set to fire on almost any imaginable market condition. It is the conditions that the part time trader has not taken the time to identify.
The issue in this case is the strategy. A part time trader will trade like "the trend is your friend." In this case the trend is what is hot and what strategy is in vogue. With the ever-changing cycle of trends, there is no possible way to get ahead in this type of trading. I would also argue that the part time trader is price focused - he does not care about volatility, interest rates, currency fluctuations, emerging markets, etc. due to the nature of his game "part time."
The part timer finally is apt to find shortcuts in order to make up the difference in time. The problem with shortcuts is that they run near to the edges of steep cliffs.
Dylan Distasio responds:
The issue in this case is the strategy. A part time trader will trade like "the trend is your friend." In this case the trend is what is hot and what strategy is in vogue. With the ever-changing cycle of trends, there is no possible way to get ahead in this type of trading.
I would disagree with this statement as someone who has traded both fulltime as an intraday trader, and who now trades part time with a different vocation during business hours (and a longer trading time frame for a number of reasons). The part time trader is not tied to trend following strategies, and is certainly not obligated to follow what is hot and in vogue. They are just as capable of fading the herd as a full time trader or coming up with any other strategy to try within an interday time frame.
I would go on to argue that trend following strategies are capable of making money long term. The No Load Fund X newsletter which combines a relative strength trend following strategy with mutual funds (or more recently ETFs) has consistently beaten the S&P 500 since 1980 as audited by Hulbert Financial Digest.
In any case, they are not tied to the trend. There's nothing preventing them from following whatever strategy they wish. Practical considerations usually exclude the intraday time frame as an option for the part time trader, but they can use their ability to sit on their hands and cherry pick within a longer time frame as a strength.
I would also argue that the part time trader is price focused - he does not care about volatility, interest rates, currency fluctuations, emerging markets, etc. due to the nature of his game "part time."
I would argue that the part time trader should care about all of these things. Speaking for myself, I certainly do.
The part timer finally is apt to find shortcuts in order to make up the difference in time. The problem with shortcuts is that they run near to the edges of steep cliffs.
The part timer who is serious about attempting to beat the market should realize the amount of work required to do so. I think most of the ones who are able to trade part time and consistently beat the market are combining a lot of hard work after hours with their experience, and a willingness to constantly learn.
J. Klein offers:
Respectfully, I would tend to disagree. Part time vs. full time is not a question of strategy. It is, I feel, an acknowledgment of one's limitations.
Many will disagree, but I find that trading is mainly hard work. If you work hard on learning the market and about yourself, eventually you will work out some small strategies that leave you with a few more coconuts in the evening than you had in the morning. I am old enough to have seen more than one dumb young person get decent rewards, if they hung around long enough and are honest and hardworking.
The market is very large and there are many opportunities, but a part timer may take a relaxed view and let most of those golden opportunities flow away. Existing in a less pressurized environment, he may engage in only a few situations, and follow them more carefully. He trades part time, but his mind keeps working full time (how can one avoid it?) so he may be doing more thinking on each trade. More thinking, less pressure, less fear = better results, hopefully.
Jan
13
FF Duo on Migration, by Kim Zussman
January 13, 2007 | Leave a Comment
Concerning stock-type, in explanation of value and size effect (if they did or do exist, usual CSRP tapes caveats apply): Read here
Evidently the high-language of scholarship is evolving, as evidenced by (formerly known as) the conclusion:
III. Bottom Line
Our results on how migration leads to the size and value premiums in average returns are easily summarized. The size premium is due almost entirely to the extreme returns of small stocks that move to a big stock portfolio from one year to the next. Three factors contribute to the value premium. (i) A relatively large fraction of value stocks improve in type (Plus transitions, with high returns), while few growth stocks do. (ii) A relatively large fraction of growth stocks deteriorate in type (Minus transitions, with low returns), while few value stocks do. (iii) Value stocks that remain in the same portfolio from one year to the next have higher average returns than the matching (small or big) growth stocks.
Jan
8
Symmetry in Nature and in the Market, by James Sogi
January 8, 2007 | Leave a Comment
 I'm reading a book, the Hidden Messages in Water by Masaru Emoto, about snowflakes. The author claims that thoughts affect the creation of snowflakes and the patterns of the water crystals. It reminded me of symmetries in nature. Snowflakes are constructed in a binary process. Similar are the formation of cellular automata described by Wolfram in A New Kind of Science whose ideas have been trashed on this list in past years. In each of the processes, a simple binary process is used to generate complex structures, each with a strong degree of symmetry in the multitude of generated forms. It is said that no two snowflakes are alike. In addition to the broad claims of the authors, the symmetry principles also apply well to the market, which is constructed in a binary process similar to the cellular automata and snowflakes.
Take Friday's drop and range and look at today's morning range and afternoon pop and see the symmetry being formed. The process of winding down buys and sells within a system, and the subsequent release of those same energies in a consistent system tend to form symmetrical structures. There is of course a random element and also new sources of energy which add a noise factor, but there is some tendency towards symmetry in the markets which could be tested. It could be considered the hidden messages in the price data.
 Kim Zussman comments:
Speaking of the space telescope and symmetry, here are some images of (rather symmetrical) planetary nebulae from HST:
These are luminous shells of gas expelled by average stars (like our sun) at the end of their lives. The gas of spent stars can be swept up into nebulae capable of forming new stars.
Large stars end their lives as supernovae. There is a huge explosion following an implosion, in which elements heavier than oxygen are formed.
The biggest stars blaze short and brilliant, and in their corpses germinate the seeds of new beginnings.
(now hum the 2001 Space Odyssey tune…)
Jan
6
Predicting the Year’s Volatility from the First Three Days by Kim Zussman
January 6, 2007 | Leave a Comment
The stocks of the first three days of 2007 have been interesting. How does the H/L range for these three days compare with prior years, and do they have any predictive value?
By using SPY daily since 1993, I checked the H/L mean for the first three days, the return of the first three days, the return of the next three days, and the standard deviation of the subsequent 241 trading day returns (starting at day four of each year through late December).
The H/L mean of the first three days of 2007 is relatively tame compared to other years, which is in keeping with the current low-volatility regime. Here is the data by year, with the second column being the average H/L for the first three days of each year:
year average H/L
2001 0.040
2000 0.031
2003 0.022
1999 0.020
1997 0.017
1996 0.015
2005 0.015
2002 0.014
1998 0.013
2007 0.011
2006 0.011
2004 0.009
1994 0.005
1995 0.004
Concerning prediction, here is the multiple regression with the dependent variable as the second three day return, and the independent variables as the first three day H/L average and the first three day return:
Regression Analysis: second three day return versus the first three day H/L average and the first three day return
The regression equation is the second three day return = 0.0052 - 0.189 first three day H/L average - 0.359 first three day return
Predictor Coef. SE Coef. T P
Constant 0.0052 0.0123 0.42 0.681
1st 3 day avg. -0.1891 0.6244 -0.30 0.768
1st 3 day ret. -0.3588 0.2444 -1.47 0.173
S = 0.0215894 R-Sq = 18.0% R-Sq(adj) = 1.6%
The range of the first three days had no predictive value for the second three days, but there was a slight tendency (N.S) for the return of the first three days to be reversed by the second three days.
More interestingly is what the first three days had to say about the standard deviation of the rest of the year. In the multiple regression, the return of the first three days didn't matter, but the average H/L range did (see graph).

Regression Analysis: the year's standard deviation versus the first three day average
The regression equation is the year's standard deviation = 0.00645 + 0.233 first three day average
Predictor Coef SE Coef T P
Constant 0.0065 0.0018 3.61 0.004
1st 3 day avg. 0.2325 0.0929 2.50 0.029
S = 0.00322239 R-Sq = 36.3% R-Sq(adj) = 30.5%
The significant slope coefficient says that the average range of the first three days has a positive correlation with the subsequent year's (daily return) standard deviation. 2007's average first three day range of 0.011 (1.1%) predicts another year of low volatility.
This probably relates to the persistence of volatility regimes, such that high (low) range early Januaries come amidst high (low) volatility years.
Jan
6
In Case Markets Get Too Efficient by Kim Zussman
January 6, 2007 | Leave a Comment
If you are banned from counting in the casino, you can always bet on sports' teams that are non-home field favorites: Read about Arbitrage Opportunities and Wining Strategies in the European Football Betting Market
Part of the problem is that there does not seem to be low-risk paths to wealth, as shown by the relationship between stock idiosyncratic (non-market) volatility and return: Read about Implied Idiosyncratic Volatility and the Cross-Section of Stock Returns
And if you are really risk-averse, you can use VIX futures to smooth returns of fixed-income portfolios: Read about Improving Risk-Adjusted Returns of Fixed-Portfolios with VIX Derivatives
Jan
5
Conservation of Panic by Kim Zussman
January 5, 2007 | Leave a Comment
The reaction to fear is invariable, but the duration and magnitude of panic and recovery cannot be known with certainty.
Vincent Andres comments:
As noticed several times here, reactions to fear (short moves) are also swift, swifter than long moves. Picking a banana doesn't need much swiftness, but escaping a snake does (in an ethologic spirit).
Jan
4
Days with big a range between the high and low come in three types: Close near high, close near low, close not near either. In SPY, yesterday’s range was greater than 1.5% [ (H/L)-1 ], and the close was not that near to the high or low.
SPY daily since 1/2003 was used to check five day returns following:
1. Range > 0.015 (1.5%) and close within 0.002 (0.2%) of low
2. Range > 0.015 and close within 0.002 of high
3. Range >0.015 and close not within +/- 0.002 of H or L (middle
range, like today)
Here is ANOVA of means, comparing five day returns of the three conditions with non-overlapping five day returns (there is some overlap in the conditions, especially when market was more volatile, and in the case of a close near the low — So inference is limited):
S = 0.01823 R-Sq = 1.07% R-Sq(adj) = 0.19%
Individual 95% CIs For Mean Based on Pooled Standard Deviation:
Level N Mean StDev
if >1.5,L<.2 40 0.00780 0.01947
if 1.5,h <.2 31 0.00607 0.02111
if 1.5,mid 67 0.00503 0.02174
5d return 201 0.00254 0.01612
All three high-range days were followed by five day returns greater than average, with those closing near low being highest, and those near the mid (like now) being the lowest (all non-significant).
High-range days are not as common as a few years ago, and are highly correlated with volatility. I used the same SPY series from 1/2003 and looked at, for every 20 days counted, the number of H/L > 0.015 as well as standard deviation of daily returns. Here is the correlation:
Correlations: s.d. 20, countif
Pearson correlation of sd20 and countif (H/L>0.015) = 0.876
P-Value = 0.000
Jan
4
The Liberal Paradox in Trading Firms, by Dr. Kim Zussman
January 4, 2007 | Leave a Comment
Fred and Mike are pals who both trade for the same hedge fund. Their compensations depend mostly on their individual efforts, but also on each other, because if both gain for the firm there is more profit to divide at year end. In addition to this, there is a competitive status hierarchy related to individual results.
This seems close to the “Liberal Paradox”, exemplified here (an excerpt from Wikipedia) by ranked desires of a couple contemplating a chick flick:
Suppose Alice and Bob have to decide whether to go to the cinema to see a chick flick, and that each has the liberty to decide whether to go themselves. If the personal preferences are based on Alice wanting to be with Bob and thinking it is a good film, and on Bob wanting Alice to see it but not wanting to go himself, then the personal preference orders might be:
Alice wants: both to go > neither to go > Alice to go > Bob to go Bob wants: Alice to go > both to go > neither to go > Bob to go There are two Pareto efficient solutions: either Alice goes alone or they both go. Clearly Bob will not go on his own: he would not set off alone, but if he did then Alice would follow, and Alice’s personal liberty means the joint preference must have both to go > Bob to go. However, since Alice also has personal liberty if Bob does not go, the joint preference must have neither to go > Alice to go. But Bob has personal liberty too, so the joint preference must have Alice to go > both to go. Combining these gives
Joint preference: neither to go > Alice to go > both to go > Bob to go and in particular neither to go > both to go. So the result of these individual preferences and personal liberty is that neither go to see the film.
Now back to the traders … (+ = up, - = down):
Fred wants: [I](F+/M+,F>M) > [II](F+/M+,F(F+/M-,F>M) > [III](F-/M-,F>M) > [IV](F-/M-,F(F+/M+,F>M) > [V](F-/M+,F(F-/M-,F(F-/M-,F>M)
In scenarios I - III, individual competition shows because concern about the firm is mooted, (both traders are up). II > (III and IV) shows that the trader prefers the community wins, even if he is beaten by his friend. And V is the least preferable, with the community losing and the trader losing to his buddy.
Individual vs. community relates to team sports, the question of individual achievement over the team, competitive sales groups, and the dynamics of group endeavors in general. Even if there are advantages to trading solo, ostensibly they are out-weighed by owning part of the “house” (working with other’s capital) and reduced risk resulting from multi-trader strategy diversification.
Jan
3
New Year Questions, from Kim Zussman
January 3, 2007 | Leave a Comment
2006 gains came essentially in the last six months of the year. The question is what happens in the first half of each year as a function of the last half of the prior year? SPY monthly closes since 1993 were used to regress the first six months against the last six months of the previous year:
Regression Analysis: First six months versus last six months
The regression equation is
1st 6mo. = 0.0318 + 0.542 last 6mo.
Predictor Coef SE Coef T P
Constant 0.0318 0.0323 0.98 0.346
last 6mo 0.5424 0.3443 1.58 0.143
S = 0.0995406 R-Sq = 18.4% R-Sq(adj) = 11.0%
The first six months tend to continue the pattern of the last six months, which is somewhat bullish for the present (though non-significant). The same test for the last three months and the first three months showed weaker results.
More to the point (and since it appears likely to start with a bang), for each January since 1993, what happens in the last 15 days as a function of the first five?
Regression Analysis: last 15 days versus first five days
The regression equation is
last 15d = 0.0129 - 0.747 1st 5d
Predictor Coef SE Coef T P
Constant 0.013 0.0114 1.13 0.281
1st 5d -0.747 0.5479 -1.36 0.200
S = 0.0357813 R-Sq = 14.4% R-Sq(adj) = 6.7%
Here there is a slight (non-significant) tendency for the last 15 days to reverse the first five.
Jan
1
Streaking in January, from Dr. Kim Zussman
January 1, 2007 | Leave a Comment
For the S&P 500 index, December 2006 was the seventh consecutive up-month. Looking at monthly returns since 1950, there were ten occasions of up-streaks of seven or more months, (the second column is the number of consecutive up months):
Stem-and-leaf of streak N = 276
Leaf Unit = 0.10
117 000000000000000000000000000000000000000000000000000000000000000+
(63) 1 00000000000000000000000000000000000000000000000000000000000000
96 2 0000000000000000000000000000000000000000000000
50 3 0000000000000000000
31 4 000000000000
19 5 000
16 6 000000
10 7 000
7 8 0000
3 9 0
2 10
2 11 00
Returns for the month after seven ups was higher than for all months, but not significant:
Two-sample T for month if up seven vs. all monthly returns
| N | Mean | Standard Deviation | Standard Error Mean | |
| Month if up Seven | 10 | 0.0160 | 0.0437 | 0.014 |
| All Monthly Returns | 683 | 0.0073 | 0.0408 | 0.0016 |
Month if up seven T=0.62
And in the current case, month eight will be January, which is historically a good month also (although again this is not significant):
Two-sample T for January vs. all monthly returns
| N | Mean | Standard Deviation | Standard Error Mean | |
| January | 56 | 0.014 | 0.0480 | 0.0064 |
| All Monthly Returns | 683 | 0.0073 | 0.0408 | 0.0016 |
Finally, here is a regression of January with prior Decembers (since 1973), which shows a trend towards reversal (but is not significant):
Regression Analysis: January vs. the previous December
The regression equation is: January = 0.0221 - 0.303 previous December
| Coefficient | Standard Error Coefficient | T | P | |
| Constant | 0.0221 | 0.0095 | 2.33 | 0.026 |
| Previous December | -0.3027 | 0.2631 | -1.15 | 0.258 |
S = 0.0504452
R-Sq = 4.0%
R-Sq(adj) = 1.0%
Dec
28
Predictive Gapping, from Dr. Kim Zussman
December 28, 2006 | Leave a Comment
Recently Vic suggested that gaps which fill (like PFE) might carry predictive information, for example, liquid names which drop and fill might say something different about the coming week than when they don’t fill, or trend lower. Conversely, an up (or down) recent market might predict what happens to gapping stocks.
Today AAPL gapped -5% on a stock options inquiry, which filled completely by the close, (my limit order wasn’t filled …).
I don’t yet have much capacity with individual stocks, but this looks interesting.
Dec
27
Predictive Gapping, from Kim Zussman
December 27, 2006 | Leave a Comment
Recently Vic suggested that gaps which fill (like PFE) might carry predictive information, for example, liquid names which drop and fill might say something different about the coming week than when they don’t fill, or trend lower. Conversely, an up (or down) recent market might predict what happens to gapping stocks.
Today AAPL gapped -5% on a stock options inquiry, which filled completely by the close, (my limit order wasn’t filled …).
I don’t yet have much capacity with individual stocks, but this looks interesting.
Dec
26
Gym-Borne Infections, from Dr. Kim Zussman
December 26, 2006 | Leave a Comment
I found this on Yahoo, about infectious diseases at the gym:
About 80 percent of all infectious diseases are transmitted by both direct and indirect contact, says Philip Tierno, director of clinical microbiology at New York University Medical Center and the author of The Secret Life of Germs.
That makes the gym, with its sweaty bodies in close proximity, a highly conducive environment for catching everything from athlete’s foot to the flu.
In swabs of medicine balls, for example, Tierno found samples of community-acquired MRSA — a strain of staph resistant to some antibiotics.
“You take your chances,” Tierno says. “Any time you touch a medicine ball or machine, you have to know that your hands are contaminated and should be washed.”
What about those spray bottles some gyms provide for wiping down equipment? They may help, Tierno says, but he recommends additional measures, such as wearing long sleeves and pants while working out.
Also, bring your own towels, since there’s no guarantee that your gym’s linens have been bleached or rinsed in clean water. While in the locker room, make sure you wear flip-flops, and avoid sitting nude on any exposed surface.”
An editor’s note: the estimate of 80% is off by 20%: All infectious diseases are transmitted by contact with pathogens. Having had this discussion with college freshman living in the dorm, there are only two issues.
- Asepsis
- Immunity
Asepsis is understanding and action that pathogens are microscopic, found everywhere humans congregate (including surfaces, air, and saliva), can remain infectious hours/days outside the body, and infection may occur after inoculation with only a few organisms.
Immunity relates to stress, nutrition, supplements, and voodoo, all of which is noise compared to the simple question of whether or not you get exposed to pathogens. Stress and sleeplessness do have immune suppressive effects, but there is not nearly as much you can do about them as contagion.
Here is some advice to the dorm girl which may help reduce cold/flu experiences: Remember that many viral illnesses are contagious before symptoms develop, and often people who look well are sick and you won’t know it. Get the flu shot if you cannot avoid frequent contact with people (meningitis for college kids too). Try to avoid handshakes and sharing food, writing implements, computer keyboards and mice, and clothes/scarves/hats/gloves. Wash your hands often (with good antimicrobial like Purell, etc), especially after contact with people, using the restroom, and before eating. Try to avoid close quarters with others in areas that are poorly ventilated.
The astute reader will notice that bugs take advantage of our social species, and if you do everything to avoid illness you will get even more unpopular. Asepsis advice to coeds will also reduce incidence of infections such as STD and pregnancy.
Dec
21
An Open Inquiry Re: the Often Stated Positive Drift of the Markets, from Scott Brooks
December 21, 2006 | Leave a Comment
I have asked this before…and the answers always go back to the long term positive drift. How long can someone who was 50 in 2000 and wants to retire at 60 wait for this drift to start again?
This fictional 50 year old (now 56 year old) has less money in his 401k today than he did in 2000 (he might have more if you count his deposits, but his principal is still down) and was banking on retiring in 4 years, how is he going to make it?
Dr. Kim Zussman Provides Food For Thought:
This is not an important question for those aiming to shoot the moon out of the sky. However for those (of us) realistic about our escape velocities, it is the prototype of a very important question. (parenthetically, how do hedge fund investors “average” annual performance series of many big returns with occasional years -100%?)
At a given age how much to save, how to invest it, and what are the risks resulting from the various answers? Immediately one realizes that variability of inputs and sensitivity of compounding makes this estimation difficult:
- Initial balance
- Presumed years of retirement for self and spouse
- Assumed annual expenses and forcastable unusual expenses
- Inflation
- Risk-free rate of returns
- Assumed return of risky investments (ie, stocks, hedge funds), including effect of bad years at the onset of retirement
- Tax law changes
Here is a (kind of prescient 2000) article article which discusses the “flaw of averages” (neglecting extremal paths and, as mentioned by Scott, beginning post-contribution compounding with a down market).
The article mentions Sharpe’s Financial Engines*, which at one time was a site which used Monte Carlo simulations for mutual funds to model scenarios of withdrawal and return rates.
It seems prudent for financial advisers to educate clients about risk, including the path of worst-case scenarios (which no one on Wall St. is thinking about this Holiday season)
*(Cynic’s note: Profs who leave to create consulting businesses are suspect)
*(Capitalist’s note: In competitive economies, consulting businesses which enrich former profs only succeed if they enrich clients)
Dec
19
Dr. Kim Zussman on BMI
December 19, 2006 | Leave a Comment
Body mass-index increase is cause (or effect) of increasing affluence of modern civilization. Species success should result in increased fecundity.
Then why is the sexually idealized physique de femme thin-tail-low, to the point of infertility or worse?
All this reminds me of Dr. Strangelove’s plan for post-nuclear war survival which involved living underground with a 10:1 female-to-male ratio!
General “Buck” Turgidson: Doctor, you mentioned the ratio of ten women to each man. Now, wouldn’t that necessitate the abandonment of the so-called monogamous sexual relationship, I mean, as far as men were concerned?
Dr. Strangelove: Regrettably, yes. But it is, you know, a sacrifice required for the future of the human race. I hasten to add that since each man will be required to do prodigious … service along these lines, the women will have to be selected for their sexual characteristics which will have to be of a highly stimulating nature.
Ambassador de Sadesky: I must confess, you have an astonishingly good idea there, Doctor.
Dec
18
The Kubler-Ross Five Stages of Acceptance, from Dr. Kim Zussman
December 18, 2006 | Leave a Comment
The Kubler-Ross Five Stages of Acceptance are intended to describe stages of facing one’s own demise, however these can apply equally to the final acts of dates, marriages, and trades. The stages are:
Denial - The “This can’t be real” stage.: “This is not happening to me. There must be a mistake.” (T=3 for Chrissake!)
Anger - The “Why me?” stage.: “How dare you do this to me?!” (either referring to God, the deceased, or oneself) (worked 9 out of last 10 times, and look at this!)
Bargaining - The “If I do this, you’ll do that” stage.: “Just let me live to see my son graduate.” (OK please just back to even and I will never do it again)
Depression - The “Defeated” stage.: “I can’t bear to face going through this, putting my family through this.” (See ya later/going hiking without a cell phone)
Acceptance - The “This is going to happen” stage.: “I’m ready, I don’t want to struggle anymore.” (Well, it’s guaranteed to happen; finally glad to have found a niche in the ecosystem)
Dec
15
Speaking of Perfection, from Kim Zussman
December 15, 2006 | Leave a Comment
In a quick check of quarterly GDP data since 1947, I looked for instances of quarters less than priors (those under 30 will need a good economic history text to understand this). I then counted quarters between down quarters, and regressed this lag with (proxy for) date:
Regression Analysis: lag versus no

The regression equation is
lag = 1.99 + 0.0451 no

Predictor     Coef  SE Coef     T      P
Constant     1.991    2.739   0.73  0.472
no              0.045    0.0249  1.81  0.079

S = 9.40899   R-Sq = 8.8%   R-Sq(adj) = 6.1%
The positive and almost-significant slope shows de-fettering native free-market forces over time has reduced the frequency of contracting GDP quarters.
Or as Buzz Light-year would say, “To volatility zero and beyond!”
Dec
12
Growth vs. Value, from Victor Niederhoffer and Tom Downing
December 12, 2006 | Leave a Comment
I have written extensively about my belief that growth beats value, because my experience with many hundreds of companies shows that you get paid for finding areas where capital has a high rate of return, and for doing innovative things. You don't get paid for using capital with low rates of return and imitative enterprises. I like to give the anecdotal example of Joe McNay, who took part of Yale's endowment from a few million to over $125 million in 20 years, as unobtrusive evidence supporting my view. Also, since 1960, Value Line has tried to find groups of low P/E and low P/B stocks that would beat their composite, but found that a dollar invested in their composite or their Group 1, rebalanced each month, grew at least 10 times faster than a dollar invested in value over the period.
There are some problems in this, in that the Value Line composite, is an equally weighted geometric average, (the return on portfolio at time t is equal to the nth root of the cumulative product of the relative returns P[t]/P[t-] of the n stocks), and the portfolio may be arithmetically averaged. In this case the average would always be greater for the arithmetic workings over the geometric workings for the same data.
Anyhow, I based my empirical conclusions on the Value Line findings, and pay no attention to the results of Fama-French and their followers, which are fatally flawed by data problems, retrospection, non-operational results, and data ending in 1999. Almost seven years have passed since 1999 and it is now time to update the prospective Value Line results.
% Returns
Year Value Line Low Market Low Price Low Price Low Price Comp Cap Earnings Book Sales
2000 -9 -24 -47 -33 -26
2001 -5 32 -19 10 22
2002 -29 -32 -50 -39 -29
2003 37 62 54 71 59
2004 12 6 4 14 16
2005 2 -9 -7 -7 -2
2006/Sep 3 30 14 26 3
Total -1 40 -63 4 38
We have in this data the unfortunate feature of a theory meeting a fact. The results show clearly that during this period low P/S was best and low P/E was worst. Low Market Cap was best of all by a thin margin, but because these stocks would have suffered from transaction and liquidity costs, they are only slightly more meaningful than the seriously flawed studies of my former colleagues alluded to above.
Professor Pennington offers:
 This is correct about the method used by Value Line to calculate the daily returns of their composite index. However, that's a very bizarre quantity to calculate, and it has no relation to a real portfolio that anyone could hold. Here are the problems:
- If any one stock goes to zero on day t, the entire portfolio would show a 100% decline! Surely that must have happened at some point over the last ~40 years of Value Line's existence, covering more than 1000 stocks. What did they do?
- They write that "This market benchmark assumes equally weighted positions in every stock covered in The Value Line Investment Survey. That is, it is presupposed that an equal dollar amount is invested in each and every stock.", but that's plainly not the case. Let's do a simple example involving just two stocks. One goes up 1% and the other goes down 90%. Value Line's formula would tell me to take the square root of 1.01*0.1, giving 0.32, corresponding to a 68% decline. An portfolio with an equal dollar amount invested in each stock would have declined about 44%.
- Not only are the weightings not equal, but also they can not be known in advance. You don't know the weightings that will be used until you know what the returns are.
- As Tom pointed out, and as illustrated in example 2 above, the calculated daily percentage changes using this method will always be less than the return of an equal weighted portfolio.
Here is text from the Value Line site.
Larry Williams replies:
I was always perplexed by Vic and Laurel's comments on growth vs. value, as my studies suggest that in the large blue chip stocks, DJIA, value outperforms growth hands down. The studies are backed up with actual performance from 1999 forward that beat the S&P and Dow.
Finally I reconciled it, in that Vic and Laurel are not looking at blue chippies, which have been my focus. There, growth is more difficult to come by, I suspect, so value leads the way. And I'm still learning about all of this.
Dr. Kim Zussman adds:
Out-of-sample testing should be powerful. However there are still fog issues with:
- Growth and value may go in-and-out of favor, and 00-06 (post-huge growth period) may partially attribute to this. Perhaps G > V over long periods, but sub-periods swing both ways.
- V.L.'s particular take on growth may be getting arbed out, with their publication of stock lists, F.V.L. closed end fund, and countless traders/funds using their data. i.e., the anomaly died.
Russell Sears mentions:
If the companies are reacting to incentive, it would make sense that they buy market share at the expense of profits, when growth is being rewarded in the markets, and do the opposite when value is being rewarded. Which comes first, and hence is predictive?
Steve Ellison adds:
Most companies are growth companies first and value companies later, after their industries mature and products become commoditized, or as a result of company-specific difficulties. Buying market share at the expense of profit actually heralds the end of growth, as it indicates the company is having difficulty differentiating its products from competitors' products.
From management's perspective, simply being in the value stock category is a slap that conveys an urgent need to improve profitability. One incentive is the possibility that management might be ousted in a takeover if the share price is low enough to attract a buyer. The generally high profit margins of growth companies provide incentives for competitors to enter the market.
Russ replies:
While this explains it on an individual company basis, I don't think it explains it on a total basis, as the graph Gordon sent suggest. What are the signs that this is happening at a macro level?
Dec
7
Engineer Ingenuity, from Dr. Kim Zussman
December 7, 2006 | Leave a Comment
Key in rescue of stranded family (CBS news):
Searchers rescued Kati Kim, 30, and her daughters Penelope, 4, and Sabine, 7 months, along a remote forest road Monday afternoon. The key to finding them, police said, was a “ping” from one of the family’s cell phones that helped narrow down their location. Though cell phone signals are rare in the area, reports Blackstone, the family’s phone connected briefly to a distant tower as it received a text message. That gave searchers a place to look.

According to one of two cell phone engineers who honed in on the Kims, the chance of the split-second signal making it through the rugged mountains was “very slim.”
“It was just a hunch that we could help. And we followed up on the hunch,” said Eric Fuqua, 39, an engineer for Edge Wireless LLC who contacted authorities to offer his services in the search. Edge Wireless provides cell phone coverage in southern Oregon, and is a member of Cingular Wireless’ network.
Fuqua and co-worker Noah Pugsley started digging through computer records of cell phone traffic Saturday and learned that one of the Kims’ cell phones had received two text messages around 1:30 a.m. on Nov. 26, the day after the family was last seen at a restaurant in Roseburg, Ore.
The engineers were able to trace a “ping” from the Kims’ phone when it received the text messages. They located not only the cell tower in Glendale, Ore., from which the messages were relayed, but a specific area west of the town where the phone received them.
With the family’s possible location narrowed down, the pair used computer software to create a map predicting what parts of the mountainous region received any cell phone coverage at all.
Fuqua then relied on his extensive experience traveling the heavily forested back roads as both a fisherman and a technician, he said, to guess the course the family may have taken as they headed from the mountains toward the coast.
The engineers’ sleuthing led searchers to focus on Bear Camp Road.
Kati Kim and her daughters were found with their snowbound car just off that road, which Fuqua called “impossible” terrain to navigate for anyone with no knowledge of the area.
The complicated network of roads in the area is commonly used by whitewater rafters on the Rogue River or as summer shortcuts to Gold Beach - the Kims’ destination when they went missing. The roads are not plowed in winter.
Searchers were lucky that the Kims received a cell phone signal at all in an area with “very, very sparse coverage,” Fuqua said. “Every now and then, if you go slow enough, you’ll hit our towers for just one second in that one spot,” he said.
Details of the contents of the text messages and who sent them have not been released.
But law enforcement officials said the engineers’ analysis of the messages was the critical breakthrough that searchers needed to ultimately spot three of the Kims by helicopter as Kati Kim waved an umbrella marked “SOS.”
“From what I understand about (Fuqua’s) help in this case, as far as I’m concerned he’s a hero to me,” said Inspector Angela Martin, who led the San Francisco police’s investigation into the Kim’s disappearance.”
Dec
4
Message Boards, from Dr. Kim Zussman
December 4, 2006 | Leave a Comment
Stock message board posts, if weighted by individual prior success, have significant predictive value:
- Somes got it, somes don’t
- Those who got it are being watched and probably arbed.
Nov
29
Prehistoric “Jaws”, from Dr. Kim Zussman
November 29, 2006 | Leave a Comment
The fossil record of life on earth can be read as sequential ecological dominance. It is interesting how formidable species at the top of then-current food chains often become extinct.
 Dunkleosteus terrelli is a fish which bit with 11,000 pounds of force (twice that of great white shark), which along with other big-biters (T. Rex) are dodos of other eons.
When this creature terrorized oceans full of big prey, what were eminent forces that would end his reign? Temperature change? Small prey? Disease?
Species success and dominance appears to require risks of commitment and inertia, which pay off competitively but increase vulnerability to unforeseeable environmental shifts.
Dylan Distasio comments:
An interesting creature for sure … This type of fish (Placoderm) was wiped out in one of Earth’s great mass extinctions in the late Devonian period. It is rather startling to look at just how many species died as a % of the total on Earth during any one of the given recorded mass extinctions.
Nov
29
Dr. Kim Zussman Flirts with Evolution
November 29, 2006 | Leave a Comment
A very cute 26 year young lady was temping at the office recently and told of her experience at a convalescent home where she had just quit. It seems there is an 87 year old Romeo who, just as she turned around, planted a big wet one right on her lips.
Another lady who works there and is pregnant is telling this guy, who has some Alzheimer’s, that the baby is his.
From a Darwinian view, a man of any age should construe any attention from a woman as an invitation (evolution occurred before lawyers); the goal is maximum projection of genome into the future, and you have to risk refusal to get it there.
In Russia flirting, sexual innuendo, and fondling, which used to be legal here between opposite sexes, is alive and well. Funny thing is, most of it is in jest (a Russian aphorism: “Every joke has some truth to it”) and women crave the attention tremendously. In fact, even married Russian women become quite furious if they cast a furtive glance at a man and he doesn’t respond. Even though they are busy poisoning their enemies, they haven’t yet polluted the soul.
Nov
27
In Search of a Trading Purpose, from Martin Lindkvist
November 27, 2006 | Leave a Comment
 I often ask myself what is the purpose of my trading. Yes, I know, I do it for the money, for the intellectual challenge, and all that. I also understand how the markets function by allocating capital and signaling value, etc., and how I am a small, small part of that. But I mean it from a different perspective. Having worked a lot with business planning (mostly with LOTS) in different companies, I often think of how I would characterize my reason for trading if I were to write it in a business plan format. If I sold some gadget for example, I would ask: What is the purpose of the selling of the gadget? Who benefits from it? What is the underlying reason that there will be a value gained from my selling the gadget, from which I can make a profit. I think that the same applies to trading. Furthermore, a good purpose should also function as a day to day rudder and make sure that I do not deviate from my niche. To do that, it should encapsulate what we should do, why and for whom. With a well thought out purpose, we should be guided both in our every day activities as well as our important long term decisions.
During the talk this year in Central Park, Mr. Wiz mentioned something that perhaps is not spelled out as a company or trading purpose, but which I nevertheless think was one of the best fitting purposes I have ever heard, as far as I understand the underlying thinking in the company. He said: “We provide the market with liquidity in fearful situations”. Well, it seems to have worked out quite nicely, and I think there is a lot to be gained by all traders from being very clear with what it is their niche is in the market, and spelling it out in a “trading purpose”.
Scott Brooks adds:
Providing the market with liquidity in fearful situations is tantamount to buying low. The flip side of this coin is providing the markets with liquidity during the great times, which is tantamount to selling high!
This is an investment philosophy that I invented years ago … it is called “Buy Low and Sell High” … (I know, you’re shocked, you did not know I was the inventor of “buy low and sell high”)
But seriously …
This was described to me by a college professor as the “good guy school of investing”. It works like this:
If someone wants to sell you something for far less than it is worth, be a good guy and buy it from them. Conversely, if someone wants to buy something from you for far more than its worth, be a good guy and sell it to them.
The “Good Guy School of Investing” is providing liquidity to the markets during fearful situations (and also providing liquidity when the party the market mistress is throwing is at its crescendo.)
In between, just take advantage of the long term positive drift!
Dr. Kim Zussman comments:
I recall Viktor Frankl’s Man’s Search for Meaning. His conclusion was that we are not in a position to ask life it’s meaning - life will ask you to determine it’s meaning.
Something like ‘what you get out of it is proportional to what you put into it.’ Even if you lose, or under-perform various benchmarks, you get to be ironic.
For some, trading has analogies in most aspects of the universe, and can become self-consuming. To others it is just money; and Buffett, Soros, Ken Smith, etc. all put on their pants one leg at a time and suffer the same frailties we all do.
Laurence Glazier contributes:
This brings to mind the great Armstrong lyrics:
If I never had a cent I’ll be as rich as Rockefeller Gold dust at my feet on the sunny side of the street [More]
So above all let us trade for the love of it! Trading is a two way process and equally important as our purpose is the realization that it shapes us, acting, like other arts, as a mirror.
GM Nigel Davies mentions:
Something I’ve noticed with many very strong chess players is that they don’t need to think about purpose, they are simply at one with the game. And one of the best ways to nobble a tournament leader is to congratulate him on his excellent play and ask what it is that he’s doing right (not that I’d use such a tactic myself).
Accordingly I suggest that one of the goals of mastery is get past the stage of awkward consciousness and discussions such as the present one. For a chess player it should be enough to say ‘I crush, therefore I am’, and the trading version would be ‘I’m profitable, therefore I am’. And the strategies required should be in one’s blood, things that are so well studied and deeply ingrained that one uses them as naturally as breathing.
Jim Sogi adds:
In Trading and Exchanges by Larry Harris of USC discusses why People Trade. People trade to invest, borrow, exchange assets, hedge risks, distribute risks, gamble, speculate, and deal. Understanding the reasons different people trade and the taxonomy of traders, including ourselves, allows understanding the opportunities that arise. Interestingly a smaller percentage of participants are true investors, and even fewer are speculators. Of those even fewer of what he terms informed speculators are the statistical arbitrageurs, of which we compose a small part. Oddly Many do not trade to profit but for other reasons. This is where the speculators purpose in the firmament comes in, and for which we are rewarded, to facilitate the other purposes of the other participants. They pay us for that privilege. Dealers are the ones who sell liquidity, not the speculators. The above does not answer the heart of Mr. Lindkvist’s query, but it does set the framework for the answer which must vary according to each of our purposes and which niche into which we fit in our respective operations.
Larry Williams mentions:
Years ago we did a personality profile at seminars asking traders to list the 3 primary reasons they traded.
None of them listed as the first reason to make money.
Answers were like, “Excitement, Challenge, to show my brother in law I’m smarter than him, etc”
Kim Zussman creates a masochist/self-loathing correlation matrix:
| Long Only | Bought | Hold | Sold |
| Too Soon | -$ | -$ | -$ |
| Too Late | -$ | -$ | -$ |
| Too Long | -$ | -$ | -$ |
| Long/Short | Short | Flat | Long |
| Market | Up | Up/Down | Down |
| Short Only | |
| 100 Year Return | -1,000,000% |
Steve Ellison comments:
There is a technique used in ISO certification called SIPOC. In this technique, an organization identifies its suppliers, inputs, processes, outputs, and customers (hence the acronym). The organization divides its processes into those that create value, triggers for value processes, and supporting activities that do not themselves create value for customers but facilitate value creation. This technique can help an organization articulate its value proposition and focus its processes on value creation.
Participating in a SIPOC exercise this week challenged me to consider how I might apply this technique to trading. A trader might create value in any of several ways, including providing liquidity, moving price closer to true value, assuming risk that others wish to avoid, and providing psychological relief by taking other traders’ losing positions off their hands.
Nov
27
Some Thoughts on December, by Victor Niederhoffer
November 27, 2006 | Leave a Comment
December is a generally good month averaging about a 1.5% rise in the S&P, and having declined only 7 out of the last 26 years since 1979.
 The biggest decline during this stretch came in 2002 with a 7% decline, which had been preceded by a 20% decline over the previous 11 months, and the next biggest decline was of 4% coming in 1980, following a 30% rise over the preceding 11 months. The biggest rise came in 1991 which was 11%, and followed a 10% rise over the preceding 11 months. The second biggest rise of 6% came in 1987, which was preceded by a big decline of 4% in the preceding 11 months. Thus, big declines come after big rises and big declines, and big rises came after big rises and big declines — in aggregate there is certainly not a linear relationship. All one can say about the extent to which this is non-random is that about half the moves were approximately 1% rises, and there were a few outliers that followed enormous rises and declines from the preceding 11 months.
- Compute a regression prediction of December based on all the data available up to that time. For example, in 1982 you would have two observations, 1980 and 1981. In 1983, you would have 1980, 1981 and 1982 to fit.
- Compute the average move in the Decembers up to that time and predict that the next month will be the same.
- Compute the average move in the last three Decembers, and predict that the next month will be the same as this.
- Take the prediction generated by the first three methods each year and find which one has the best forecasting record in the past, and use that method for the next prediction.
Now you have four methods of prediction. Does any beat just predicting the average change from month to month based on simulation, by a reasonable amount. If you want to make money, or test seasonality properly you have to use your head.
| Year | Adjusted Futures Move for first 11 Months (%) | Adjusted Futures Move in December (%) | Start of Year S&P Index |
| 1980 | 30 | -04 | 108 |
| 1981 | -09 | -03 | 136 |
| 1982 | 13 | 01 | 122 |
| 1983 | 15 | -01 | 141 |
| 1984 | -03 | 01 | 165 |
| 1985 | 20 | 05 | 167 |
| 1986 | 20 | -03 | 211 |
| 1987 | -04 | 06 | 242 |
| 1988 | 10 | 01 | 247 |
| 1989 | 25 | 01 | 278 |
| 1990 | -10 | 01 | 354 |
| 1991 | 08 | 10 | 330 |
| 1992 | 03 | 01 | 417 |
| 1993 | 08 | 01 | 435 |
| 1994 | -02 | 01 | 466 |
| 1995 | 30 | 01 | 459 |
| 1996 | 25 | -02 | 616 |
| 1997 | 25 | 01 | 741 |
| 1998 | 15 | 05 | 971 |
| 1999 | 12 | 04 | 1229 |
| 2000 | -10 | 03 | 1469 |
| 2001 | -15 | 01 | 1320 |
| 2002 | -20 | -07 | 1148 |
| 2003 | 15 | 04 | 880 |
| 2004 | 06 | 03 | 1112 |
| 2005 | 05 | -0.5 | 1211 |
| 2006 | 09 | 1248 |
Dr. Kim Zussman adds:
Looking further at the same monthly data, December moves seem large compared to the prior 11 months. To check this (and eliminate effects of sign), for each year I looked at the ratio of absolute values:
|Dec ret|/|J-N ret|
One would expect each month to contribute something like 1/11 of the return of the prior 11 months. But Decembers are larger, as shown by the data:
| Year | Jan-Nov | Dec | |Dec|/|j-n| |
| 2005 | 0.031 | -0.001 | 0.031 |
| 2004 | 0.056 | 0.032 | 0.583 |
| 2003 | 0.203 | 0.051 | 0.250 |
| 2002 | -0.184 | -0.060 | 0.327 |
| 2001 | -0.137 | 0.008 | 0.055 |
| 2000 | -0.105 | 0.004 | 0.039 |
| 1999 | 0.130 | 0.058 | 0.445 |
| 1998 | 0.199 | 0.056 | 0.283 |
| 1997 | 0.290 | 0.016 | 0.054 |
| 1996 | 0.229 | -0.022 | 0.094 |
| 1995 | 0.318 | 0.017 | 0.055 |
| 1994 | -0.027 | 0.012 | 0.450 |
| 1993 | 0.060 | 0.010 | 0.169 |
| 1992 | 0.034 | 0.010 | 0.296 |
| 1991 | 0.136 | 0.112 | 0.819 |
| 1990 | -0.088 | 0.025 | 0.281 |
| 1989 | 0.246 | 0.021 | 0.087 |
| 1988 | 0.108 | 0.015 | 0.136 |
| 1987 | -0.049 | 0.073 | 1.487 |
| 1986 | 0.180 | -0.028 | 0.158 |
| 1985 | 0.209 | 0.045 | 0.216 |
| 1984 | -0.008 | 0.022 | 2.733 |
| 1983 | 0.183 | -0.009 | 0.048 |
| 1982 | 0.130 | 0.015 | 0.117 |
| 1981 | -0.069 | -0.030 | 0.434 |
| 1980 | 0.035 | -0.034 | 0.966 |
The attached plot depicts |Dec|/|J-N| vs. date, and though variability in this fraction has damped out over time, it still seems high. Even discarding two out-lying years of ‘83 and ‘87, the mean ratio is 0.26; almost 3 times 1/11.

Rick Foust comments:
I suppose that there are two major factors (amongst other smaller ones) that cause the December effect.
The first is money flowing into IRAs prior to the end of the year. Someone on the retail side of the business could confirm or refute this.
The second is large fund rebalancing. Some funds operate on the basis of maintaining a fixed ratio in various asset classes (percent stocks to percent bonds…). Periodic rebalancing of the ratios forces them to buy the asset class that has done poorly and sell the asset class that has done well. It seems that rebalancing predominantly takes place towards the end of the year. Surely there is someone here that could confirm or refute this.
Scott Brooks offers:
IRA fund flow is bigger towards the end of March thru about April 20th or so than it is in December (I say April 20th because the envelope the IRA deposit check is mailed in need only be post marked April 15th).
One can also look at index reconstitution as issues are dropped and others added to the indexes. However, this has the greatest effect on the smaller issues (smaller in terms of cap weighting). Most larger capitalized stocks are going to stay in the index and could be bought in an effort to rebalance a portfolio fund back into the index weighting.
As a result, the index funds have to go thru a flurry of rebalancing, selling the issues dropped from the index and buying those that are added….and proportionalizing those stocks that stick (again, mainly the largest capitalized issues).
Something else to consider (for both money managers and individuals) …
Stocks that have a loss are often sold to realize capital losses to offset the fact that …
Stocks that managers or individuals feel have run their course and have a gain are sold.
Another phenomenon that occurs are RMD’s (Required Minimum Distributions) for those with qualified money that are over 70. This is a forced sale for no other reason than realizing taxable income. What’s interesting is that this now becomes money in motion and as a result, opportunity to invest in other areas. As the baby boomers age, this will become more and more of a factor … especially since such a large number of boomers bought into the myth that they will retire in a lower tax bracket than when they were working.
I’m sure there are are many other reasons that our resident bond mavens and options experts (as well as anyone smarter about the market than I) could add to this discussion
An Anonymous Contributor says:
In his post Kim Zussman wrote that:
Looking further at the same monthly data, December moves seem large compared to the prior 11 months. To check this (and eliminate effects of sign), for each year I looked at the ratio of absolute values:
|Dec ret|/|J-N ret|
One would expect each month to contribute something like 1/11 of the return of the prior 11 months.
No, one wouldn’t. Since you already have all the data, go ahead and look at every month relative to the other eleven months of the same year (or to the preceding eleven months, it won’t make much of a difference). My own back-of-the-envelope calculations with unadjusted data show a mean of about .22 over all months, with December being somewhat below average.
Nov
27
100 Largest Declines, by Victor Niederhoffer
November 27, 2006 | Leave a Comment
Below is the distribution of months between the chronological record of the 100 largest declines in S&P futures from January ‘01 to date. Starting with the January 2, 2001 decline of 27.1 points and ending with today’s, decline of 19.3 points, they range in size from a 57.0 point decline on 9/19/2001 to a 17.3 point decline on 8/28/2001.
| Months Between Consecutive Declines in Top 100 | |
| Number of Months | Number of Observations |
| 0 | 61 |
| 1 | 28 |
| 2 | 03 |
| 3 | 03 |
| 4 | 02 |
| 6 | 01 |
| 14 | 01 |
The average duration between each of the top 100 declines was 1.5 months. A time series of the durations between consecutive large declines however shows that the average duration between them was 1/3 of a month in 2001, 1/4 of a month in 2002, 1 month in 2003, 1 and 3/4 months in 2004 , 14 months in 2005, and 2 months in 2006.
Kim Zussman adds:
Since late 2003, big daily moves (up or down more than 1%) look to be less frequent, as well as smaller, which fits with the secular decline in volatility. The frequency change is shown by counting moves per year:
| Year | Down | Up | Up/Down |
| 2006 | 13 | 13 | 1 |
| 2005 | 21 | 16 | 0.76 |
| 2004 | 22 | 23 | 1.05 |
| 2003 | 38 | 42 | 1.11 |
The ratio of up/down is 1 or more for all years, except for 2005 (Which fits with other studies suggesting interval-returns scale contemporaneously to count down days).
Another observation is that yesterday’s decline is the first in a while, whereas big advances have been more evenly spaced. In fact when ranking gaps between big declines, yesterday’s was the longest hiatus dolor of any since January 2003.
Oct
26
Speaking of Fraud, by Dr. Kim Zussman
October 26, 2006 | Leave a Comment
Speaking of fraud, the first section of The Ludic Fallacy by Prof. Nassim Taleb seeks to combine elements of oenology (the sour varietal) with those darn tails:
It seems his current thesis has changed from “If you are so smart why aren’t you rich?” to collective academic regrets on missing the (huge) con-ponent of fraud in the game of life. Them’s smarts too!
So I offer this: forget the bulls and bears and learn to count.
Oct
26
Buy on the Rumor, by Dr. Kim Zussman
October 26, 2006 | Leave a Comment
On earnings: If you take SPY daily closes for earnings-reporting months (1,4,7,10) and compare with the non-earnings months (2,3,5,6,8,9,11,12), we see that for earnings months variance (F-test) is significantly higher:
F-Test Two-Sample for Variances
Variable 1 Variable 2
Mean 0.000664 0.000353
Variance 0.000141 0.000103
Obs 1153 2309
df 1152 2308
F 1.36085
P(F<=f) one-tail 4.17E-10
F Critical one-tail 1.086825
And even though return for days of earnings months are higher, the difference is N.S.:
T-Test: Two Sample Assuming Unequal Variances
Variable 1 Variable 2
Mean 0.000664 0.000353
Variance 0.000141 0.000103
Obs 1153 2309
Hypothesized Mean Diff 0
df 2017
t-Stat 0.762086
P(T<=t) one-tail 0.223049
t Critical one-t 1.645609
P(T<=t) two-tail 0.446098
t Critical two-tail 1.961141
Thus earnings months are more volatile.
James Sogi adds:
 The ES CME mini seems to have several modes of moving. One is the steady grind up on high volume a the buying just eats away at any selling with high volumes of bids and asks on both sides of the market, but at a slow steady pace. The odd thing is that the market grind sup through higher ask than bid. The other mode of movement is the airdrop such as this morning when all the bids seems to dry up and the market falls fast, not due to the ‘grinding action’ but more of a vacuum effect. This can happen even when the numbers at bid are higher than the asks. There is movement with up and down jittery price action and movement steadily in one direction. There is movement within quantum levels, and movement out of the levels which like boiling water takes more energy. The micro structural elements should be able to be quantified to signal at least descriptively what is taking place. Prediction is of course harder, but the precursor conditions ought to help prediction.
As to whether stocks fall faster than they rise, Vic and Laurel’s studies disprove that. The vacuum effect described above can happen to the upside and frequently sharp rises occur, as we have seen this past few months, with rises as fast as if not faster than drops. The rises are fueled by the short covering as well as the vacuum effect and can be even stronger. This rapid rise is what I call the ’swoosh’ effect. This also oddly happens when the ask volume is higher than the bids. As usual, its not what you would expect. Another issue is whether the vacuum drops and pops are connected ala Lobagola effects. It would make sense. George Zachar has said that volume is not predictive, and I agree, but something else is going on, and I intend to find out what it is and why it does what it does.
Steve Leslie replies:
Intuitively I understand the aspect of crowd behavior and a group think mentality. I have also read where analysts are slow to increase earnings estimates usually taking 9 months or more to actually catch up with the company. It is probably due to and it certainly is exacerbated by some companies not revealing all of their cards. They therefore give out parcels of information over time. It also may be due to lazy or fearful analysts who key their work off of others. They just mimic what every other analyst is saying. That way if they are wrong they can state the obvious, that everyone else was wrong therefore it was due to faulty information rather than their own ineptitute. . Blaming an uncooperative exec at the company for not disclosing pertinent information for them to do their job is often a proper copout.
I liken this phenomenon to elected officials who like to keep their jobs by not necessarily doing anything big but not making any big mistakes either. We based our decision to invade Iraq on faulty CIA intelligence.
Execs who make big mistakes can get fired quickly. There just isn’t much upside to being flashy when being average is just as financially rewarding.
On the other hand, how often do you see a stock get repriced overnight with a 30% haircut. Once again, fear may just be taking over. An money manager, hedgefundist, institutional investor, or similar professional may be saying well lets just step aside for now and see where the dust settles. There may be another shoe to drop and I don’t want to be around when that happens. So what is it to me to sell 1/2 of 1 % of my portfolio. To that end, they are being very reactionary and the insiders the market makers and specialists step back and let the stock fall. And they execute the stops on the way down.
It could also be a “gentleman’s” agreement on the part of the specialists and market makers to work in concert with other mkt makers to set the price and execute the outstanding tickets that may already be in the system. This way the “bookies” get rich and the public eats it. I suspect this is where the chair may fall in on. Just one more way to screw the investor for as we know most investors are long siders or “right way bettors” This way it can destroy the psyche of the individual make them easy prey for the predators and the scalpers (brokers included) and once more fulfill the prophecy of in the end the John Q. Public eats it. The publics time frame compresses and therefore they become the hunted rather than the hunter.
This is the stuff that runs through my mind and others are welcome to chime in. Or not.
As is one of my favorite lines from the movie “It is a fool who looks for logic in the chambers of the human heart.”
Oct
26
Election Pop, by Dr. Kim Zussman
October 26, 2006 | Leave a Comment
 One theory is that incumbent parties grease markets before elections. In that September and (thus far) October has been good for stocks, how do these two months compare for years with elections vs. not?
Checking SP500 index monthly closes (with dividends) since 1980, two-month non-overlapping returns were compared with two-month Sep-Oct returns, counting back every two years from 2006:
Two-sample T for election vs all 2 months
N Mean StDev SE Mean
election 14 0.025 0.0637 0.017
all 2mo 156 0.017 0.0646 0.0052
T-Test of difference = 0 (vs not =): T-Value = 0.44 P-Value = 0.667 DF = 15
Though Sep-Oct returns for election years are better than average two-month returns, the difference is not significant. But perhaps the levers are longer term. The same test on July-Oct returns of election years vs. all four-month returns shows election years to be lower:
Two-sample T for elect vs all 4 months
N Mean StDev SE Mean
elect 13 0.0160 0.0926 0.026
all 4m 77 0.0332 0.0913 0.010
T-Test of difference = 0 (vs not =): T-Value = -0.62 P-Value = 0.544 DF = 16
For two- and four-month moves prior to elections, it seems the greater powers which are working are not political parties.
Oct
24
The Spike, from Victor Niederhoffer
October 24, 2006 | Leave a Comment
 It is sometimes helpful to understand the infrastructure of Wall Street and LaSalle Street. Consider what must go through the minds of margin clerks and risk managers and heads of firms when the market can spike up by 20+ S&P points in one minute on light volume. That’s a $5000 per contract move in the big S&P, and any margin account that couldn’t stand that and be in good shape at the time, would cause great trepidation. Consider also, the others hanging onto their shorts. “Dear, don’t give me that ‘d#mned broker’ stuff any more. If it had stayed up there for one more minute, you could have gotten a call and we would have had to cancel the vacation and send Joe to State College. Promise me that you won’t put us in that position again.” You can try also to put yourself in the minds of those who were short and saw themselves on their knees or backs, and were repreived when Clever Hanses knocked the price back from 1398 to 1376. “My goodness, tell me again how close to death I was before they defilibrated me? I promise I’ll give up smoking now.”
Jason Goepfert replies:
While difficult, I would suggest that everyone try to find a way to observe the inner workings of a brokerage firm margin department.
I managed such in the late 90s for the discount side of a large bank. When traders are heavily margined and facing a call, the vast majority do not use objective analysis, or even limited intelligence, in making their decisions. They use raw emotion.
And what most don’t realize is that those on the other end of the phone are subject to the same. There is an extraordinary amount of pressure on the margin clerks and managers, and when faced with settlement deadlines, their pulse quickens as well - it is not all about rules and procedure.
One nasty day in particular a large client dipped below his equity requirement and was up for a forced sell out. None of my margin clerks could reach him - it turns out he was in the championship of the World Series of Poker at the time.
At the 11th hour, he called frantically insisting that he had the funds available in a bank safe, denominated in poker chips. Given the amount and the client, the decision of whether to sell him out went all the way up to just under the CEO. He said sell, so we did, adding not a little pressure to the current market decline.
The client promptly sued us. And won. A lot.
While I believe the impact of margin selling on overall market performance is greatly exaggerated most of the time, in times of duress it is not as wave after wave of sell orders emanate from these shops, often in close proximity as the guidelines from firm to firm are fairly close.
Dr. Kim Zussman adds:
Adaptive Optics is a technology used by astronomers to counteract atmospheric blurring effects which degrade images for earth-based telescopes.
One method uses a laser to project to the upper atmosphere, creating an “artificial star”. Images of this star, which contain information about how light waveforms are distorted as they fall through the local atmosphere, is used to modulate a flexible mirror which corrects the wavefront and greatly sharpens actual star images.
Might “fat finger” events or other strange/large trades represent a form of artificial star designed to perturb markets for the purpose of sharpening the real picture? If so, who are these astronomers and can we benefit with our own specs?
Vincent Andres responds:
Another image which comes to my mind is that such events may be a voluntary stress applied to the market in order to visualize where may be germs of possible fracture lines.
Not obvious to exploit when seeing only the input signal’s echo and without precise dating.
Oct
16
Declines Since 1950, by Dr. Kim Zussman
October 16, 2006 | Leave a Comment
I looked at SP500 daily closes to find instances when a day’s close was lower than 10% less than the highest close of the prior 42 trading days (about 2 mo). To further isolate such instances, I noted only those with two consecutive closes lower than 10% decline from 42D max, which followed two closes which did not meet the condition.
We are currently 929 trading days since the last such decline (Feb 2003), which is the 5th longest wait out of 45 noted since 1950. Here are the dates of 10% declines, along with count of days since previous 10% decline:
Date Days Date Days Date Days
——– —- ——– —- ——– —-
08/28/98 1993 02/07/03 96 11/30/78 23
09/23/57 1796 05/20/74 91 07/29/74 15
10/16/87 1336 12/04/74 90 07/07/82 11
08/23/66 1072 07/11/01 84 11/04/57 11
11/21/73 898 06/21/82 74 10/08/57 11
05/05/70 873 09/20/02 63 07/26/50 10
10/27/78 797 03/12/01 53 09/03/75 9
08/20/90 718 09/10/01 42 10/18/57 8
03/08/60 585 12/21/00 39 05/22/62 7
05/11/62 548 10/10/90 36 10/26/00 6
10/12/00 513 10/31/01 33 09/16/81 6
09/08/81 374 07/08/74 33 10/18/00 4
03/14/80 325 06/21/02 32 08/20/75 4
08/14/75 175 01/09/74 32 11/11/57 4
05/07/02 128 10/04/66 29
03/05/82 118 10/01/98 23
Oct
11
Very Good in One Role and Very Bad in Another, by Victor Niederhoffer
October 11, 2006 | 1 Comment
 Just as books like The Godfather teach us that an individual in his different roles can be very good or bad, like the Don's being so good with the grandchildren, but willing to kill you for a dime without a trial, the rednecks can be very good in one role and very bad in another. I know of a man whose views on things are as bigoted as those of the rednecks — yet he is a very good fisherman, always willing to share his catch with you, and would give you his views on the market without any charge or a hamburger for free if you were hungry and drove to his store. I found the same kind of people as the rednecks on the juries I have had the displeasure of facing. They all have relatives who are policeman or firemen, and you can't ever expect them to decide against the authority of the police. At a more fundamental level, the average person, the average G-d fearing, quarter acre owning, two child parent, high school educated, 40 years old, earning $40,000, has more common sense and compassion than the average prince of Wall Street because he has participated in a series of voluntary mutually beneficial transactions that have taught him that life is benevolent.
Craig Cuyler replies:
Your point reminds me of something I read once that said "the qualities that make you a good businessman are the same that make you a bad human being and vice versa."
Through various friends of mine and work I have come into contact (as am sure most of you have) with quite a few people worth in the hundreds of millions of dollars and the one common trait that they seem to share is their lack of real friends. I've often been to these people's homes for birthdays, New Years, Christmas parties, etc. and they don't seem to have a close circle of friends other than the ones that they have become acquainted with in the last year or two. Most of the so-called average people that I know have large circles of close friends that they have known for years. I don't know if your experiences are the same but is something that my friends and I have often commented on.
Dr. Kim Zussman responds:
 To borrow from another scientist, true friendship is an asymptote. The best illustration of this was my friend Mr. Clean (the tarantula), who died without ever issuing a nasty bite with his quarter inch fangs.
Another relation is |F(T)| = 1/$. The absolute value of true friends is inversely proportionate to your net worth (hasten to note this conclusion from too little n, but in that depicted net can be easily conned, you can test the affected sycophancy).
J. T. Holley responds:
My PaPa passed away in 1995 at the age of 98. He lived in a house that he built himself. The only running water was the kitchen sink. The outhouse was conveniently downhill 50 yards from the house and downstream from the creek that ran beside it. He had a Barn that had twelve bear hides on its outside with turkey claws hanging from the tin roof and had every tool known to man inside for survival. There was a cellar underneath the house that had a blacksnake named "Jake" that guarded canned goods and potatoes from rats, mice and men. He didn't have a high school education and never possessed a driver's license in his life. This aside he was probably the closest thing to a true scientist and empiricist that I've met in my life thus far with his handwritten notes, journals, calendars and such. He taught me to trap, hunt, fish and have a love and passion for NASCAR, football, John Deere, Remington, Buck knives and that life wasn't fair and you have to be tough, callous, persistent, and independent in all endeavors to succeed. Knowing my rural upbringing I feel qualified in making a few points about rednecks:
1. There's a lot more of them than you and it's easier for them to become like you than for you to become like them.
2. They really don't care for your opinion or how you do things.
At the same time my PaPa passed away I was ironically knee deep in textbooks teaching me of Plato's "allegory of the cave", Kierkegaard's "stages of life's way", Sartre's "existence precedes essence", Thoreau's "men live lives of quiet desperation", Plato's "mixed metals", and Heidegger's concept of throwness (pure choice except parents and death). Having that deep rooted upbringing and the benefit of a liberal arts education I can tell you the following:
"You are outside the cave, not everyone is. Just because you've chosen to advance your life along the way doesn't mean everyone else has and remain still inside the cave. They like being aesthetes and have not seen the need for logic, ethics, religion, and empiricism at the levels you choose. In their bliss they don't understand that they are suffering just like you are, and realized that they can choose like you choose and decide on a daily basis. For some reason we are all different but yet the same. The fact remains that we are here and that eventually we aren't going to be here anymore at some point. This bothers you more than them and you create value and meaning to cope and deal with your existence just as they strongly hold on to their essence, but this doesn't necessarily make you better than those in the cave when it comes to survival."
One thing that I've learned is the fact that nobody cares about your new found skills of countin' except a handful of people on this List. My wife doesn't care about "normal distributions", my Dad doesn't ever want me to utter the word "heteroskedasticity" in another conversation while playing checkers, while sitting watching football with friends don't ever mention that West Coast offense's edge is being "arb'd away" due to the "law of everchangin' and the adaptation of Defensive Coordinators, "randomness" is something that most people use as a creed, but the most, most, most ever importance is make sure that you and your Mom are on the same page when the words "Fat Tail" come rolling off your lips.
For those wishing to further their understandings on the topic of rednecks, simpletons, the "common man" located predominately in the South or at least having roots traced there, I would strongly suggest reading every single book in the Foxfire trilogy. These books are both educational and give tons of insights into the world of Speculation.
The other important thing is that rednecks or Southerners have a great "dumb act"; Vic conveniently pointed this out to me when I first gave him an "Awe shucks" comment. This is something I can't shake and to even "appear intelligent" is that which makes me feel naked and nauseated. Deception comes in all shapes and sizes.
Oct
10
On the Study of Business Models, by Dr. Kim Zussman
October 10, 2006 | Leave a Comment
The paper Do Some Business Models Perform Better than Others? looks at matrix of type of rights being sold (creator, distributor, landlord, broker) by type of asset (physical, financial, intangible, human) for about 10,000 Compustat firms:
They find differences in various performance metrics, including FF alpha (a suspect measure of stock performance against size and book returns). The alpha for entrepreneur companies was significantly negative, and significantly positive for physical brokers.
Here is definition of entrepreneur:
An Entrepreneur creates and sells financial assets often creating and selling firms. Examples: serial entrepreneurs, "incubator" firms, other active investors in very early stage firms like Kleiner,Perkins, Caufield & Byers. We do not include in this business model entrepreneurs who never sell the firms they create."
and physical broker:
(14) A Physical broker matches buyers and sellers of physical assets. Examples: eBay, Century 21
Oct
4
Even If There Were No Drift …, from Dr. Kim Zussman
October 4, 2006 | Leave a Comment
Even if there were no drift and you could make an equal case for the long or short based on studies, since the thing is for the most part random it is good to think about what happens when you get it wrong. If you limit yourself to long only, there is one way to screw up instead of two:
Position: Long
MKT:      DN

Position: Long Short
MKT:      DN    UP
One could consider limiting trading directions as risk reduction (i.e., less ways to lose). But in that risk should be compensated, should not trading both long and short, on average, produce higher returns? Or is the long-only advantage completely attributable to drift?
SPY daily returns for the past 10 years were (expressed as decimal fraction):
avg    1.00038
stdev 0.01200
This standard deviation was plugged into a random number generator, which simulated 2500 daily returns having a normal distribution with a mean of 1.0 (or zero daily return — a simulated market without drift). Then twenty different traders held these daily returns either only long, or half long and half short. Here is data for 20 longholders, with the product being the final compounded amount:
avg     stdev   prod
0.9996 0.0120 0.3410
0.9996 0.0122 0.3387
0.9996 0.0118 0.3445
0.9997 0.0124 0.4210
0.9998 0.0117 0.4857
0.9998 0.0122 0.5506
0.9999 0.0118 0.6535
0.9999 0.0123 0.6779
1.0000 0.0122 0.7678
1.0000 0.0121 0.9391
1.0001 0.0121 1.1213
1.0001 0.0119 1.2052
1.0002 0.0121 1.2838
1.0002 0.0121 1.3532
1.0002 0.0120 1.3768
1.0002 0.0122 1.4747
1.0003 0.0122 1.6099
1.0003 0.0121 1.8312
1.0003 0.0125 1.9530
1.0004 0.0122 2.0176

av daily  sd  cpd ret
1.0000 0.0121 1.0373
As expected, the overall average daily return for being long all the undrifting days was 1.0, and the average compounded return was 1.037 (+4%).
Here is the data for the strategy of long 1/2 the time and short 1/2 the time:
avg     stdev   prod
0.9995 0.0121 0.2469
0.9996 0.0124 0.2683
0.9997 0.0122 0.3479
0.9997 0.0118 0.3713
0.9997 0.0121 0.4079
0.9998 0.0123 0.5301
0.9998 0.0117 0.5398
0.9998 0.0122 0.5621
0.9999 0.0120 0.6176
0.9999 0.0122 0.6380
0.9999 0.0118 0.7248
0.9999 0.0121 0.7264
0.9999 0.0119 0.7374
1.0001 0.0122 1.1389
1.0001 0.0120 1.1730
1.0001 0.0121 1.1836
1.0002 0.0125 1.2056
1.0002 0.0122 1.4407
1.0002 0.0122 1.5368
1.0004 0.0120 2.2918

av daily  sd  cpd ret
0.9999 0.0121 0.8344
As expected, the mean daily return was essentially 1.0. However the average compounded return was 0.83; futher away than long-only (I suspect this is due to too few cases, and with more traders than 20 this would be closer to 1).
One measure of risk is the dispersion in compound returns. Long only ranged from 0.3410-2.0176. Long/short ranged 0.2469-2.2918, which is substantially larger.
So while long only and long/short simulated strategies give similar average returns in a no-drift market, the greater dispersion of long-short suggests greater risk.
Now if you put the drift in …
Oct
2
A Fall Chill is in the Err, from Dr. Kim Zussman
October 2, 2006 | Leave a Comment

… and as leaves drop from the stem at least in the northern hem (ahem) People worry about October and other months:
A study of big intra-month declines. Using SP500 daily closes since 1980, at the end of each month we look back and check the minimum of the last 10 days, and the max of the first 10. For each month the ratio min/max is a measure of severity of historic decline. This series was sorted to check on the worst such declines, over 5%, then count months:
Stem-and-Leaf Display: bigaldrops
Stem-and-leaf of bigaldrops N = 64
Leaf Unit = 0.10
7   1     0000000
12  2     00000
17  3     00000
22  4     00000
28  5     000000
30  6     00
(7) 7     0000000
27  8     000000
21  9     0000000
14  10    0000000
7   11    00000
2   12    00
The distribution looks quite even, with the possible exceptions of lower risk Junes and Decembers. And worst months in terms of big declines are tied: January, July, September, and October.
In fairness now look at equivalent big increases: Max of last half of each month/Min of first half, and note months with gains >5%:
Stem-and-Leaf Display: hichairpops
Stem-and-leaf of hichairpops N = 75
Leaf Unit = 0.10
11  1    00000000000
15  2    0000
22  3    0000000
29  4    0000000
(9) 5    000000000
27  6    000000
31  7    00
29  8    00000
24  9    000
21  10   000000
15  11   000000000
6   12   000000
Large intra-month increases are less uniformly distributed, and occur most in January, may and November, with October still well represented.
Oct
2
Risk, from Scott Brooks
October 2, 2006 | Leave a Comment
Risk is different depending on your perspective. Lets look at it in a non-academic manner. The risk is as follows:
Lets take a fictional person named Joe in 1975. Joe starts to get his life in order and finances stabilized in his early thirties. He starts saving some money and follows the edict of investing in the stock market.
He experiences extreme volatility for the first few years, but since he's only got a small, nearly inconsequential nest egg, he is able to ignore the extreme swings in the market that occurred from 1975 - 1982. After 7+ years of investing, his nest egg has built to a tidy little amount and by the accident of timing, he now has his decent nest egg positioned to take off with the greatest bull market in history.
And we are off to the races.
1987 hurts him, but he's got such huge gains, that he is able to overcome it, and "hold the course". less than 18 months later, he's back to even and off to the races again. The glitches along the way are still there, but they are quick, fairly painless, and its off to the races again.
By the end of 1999, between his pension account and 401k, he's built up $1,000,000 in his nest egg. Since the market has taught him that he can easily get consistent double digit returns on his money, usually in the upper teens or lower 20's, he decides to roll over his pension and combine it with his 401k in a rollover IRA.
He has expanded his lifestyle through the greatest bull market in history, and thus needs about $100,000/year from his portfolio to live. But that's no problem, with the market "drift" yielding him 15% - 20%/year (heck, in the late '90's, he was getting a 30%+ return), pulling 10%/year off his principle to live each year is no problem.
Then comes 2000.
He finds out he was right about being able to get double digit returns. Unfortunately, he finds out that they also come in the negative variety, too.
He pulls out his $100,000 to live on in year 1, and earns a negative 10% return. Now he's got around $750,000 in his nest egg. But that's only a glitch (and he's experienced these short term set backs before). In a few years he'll easily be over $1,000,000 again.
Then comes 2001.
He pulls out his $100,000 and the market goes down again. Now he has got around $500,000. He begins to sweat. Then comes 9-11. And it scares him badly, but he remembers 1987 and the big run up that occurred afterwards and decides the hold the course (heck, what choice does he have if he wants to maintain his current lifestyle).
Then comes 2002.
He pulls out his $100,000 and the bottom falls out of the market. The S&P 500 is at 755 (off from its 1550 high around the time he retired). Since he was an indexer to begin with, his nest egg is cut in half not counting withdrawals. Counting withdrawals, he is down to under $200,000.
He has to go find a job.
He has to stop taking withdrawals (which he was doing under reg. 72t since he retired early), and in some cases, the "Joe's" of the world mortgaged their houses to take advantage of the boom, and lost all or most of their equity.
Remember, when we talk about drift, and we talk about risk, we are doing so in a largely academic sense. We are discussing it in a manner that the average person cannot relate too.
If you're running a huge hedge fund and have tens of millions of dollars under management invested with you from people that can afford to lose millions and not have it ruin them, or if you are running your own money and can get another "job" if necessary, or have another means of support besides your portfolio, that you have a vastly different perspective on drift and risk than the "average Joe's" of the world who have no other means of support nor do they have the intellectual capital to figure out what to do and how to fix a problem as severe as seeing their entire life's work melt down 80%.
A few years of losses hurt Joe more than a lifetime of gains helped him.
Dr. Kim Zussman responds:
Someone asked earlier "What risk I am compensated for when the drift is a certainty?" I have a few clarifications:
- That drift is not certain, or actually that drift is certain but only with an uncertain timescale
- The uncertainty of your own uncertainty (like the second derivative of certainty: first you are sure. Then unsure. Then unsure if you should be unsure)
- Pain and suffering: see above
Phil McDonnell adds:
The idea of the long term upward drift in the market is a stochastic reality. It would be inappropriate to apply words such as 'certain', 'always' or 'never' to a stochastic process.
As Dr. Zussman indicated the drift is not guaranteed to be a certain amount or even positive in any one year. It is increasingly likely that your diversified returns will approach the long term drift rate if held long enough. However even the phrase 'long enough' implies risk. For there is no guarantee that one will live 'long enough' to realize the drift rate due to other risk factors.
Sep
27
The Agony of Irony, from Dr. Kim Zussman
September 27, 2006 | Leave a Comment
We are within a one day rally of an all-time high on the DJIA, augmented by the historically bullish Q4. This following a sell off May-July, and finally after more than 6 years past the January 2000 peak.
What does it mean? There are few stocks in the DOW, but the investing public might be interested in headlines and soundbites yelling "Stocks at all-time high". The S&P 500 and NASDAQ are still well below their climaxes, but perhaps they too can be hoisted up by their stodgy predecessor.
Will the regrets of the sellers of the past 6 years and hopes of new blood to the stock market combine to run the next bull?
Sep
25
The Big of the Small, from Dr. Kim Zussman
September 25, 2006 | Leave a Comment
The summer after freshman year in college a friend's father hired me for construction work, following a good showing pick-axing his manicured hillside for railroad-tie steps. Tony owned a successful contracting firm, and there was always a need for strong backs on the job.
The promised pay was good - more than double minimum wage. Each morning we would arrive by 7am for a full eight hours of pick and shovel with hard-hat, under the blazing San Fernando Valley sun. At 10 there was a break, heralded by the barrio horn of a catering truck. Orange juice! Soda! Sweet rolls, coffee! Anything please! Twenty minutes you could sit down and whatever he had, it was so good and warm or cold and almost the sweat would start to dry when it was time to go back again and swing that heavy tool.

A laborer; shoveling and cleaning up concrete debris, wood, sand, and mud around the foundations of recent block masonry, and trenches of proscribed depth destined for footings of a new building of industry. Every day. Hot. Dry. Dust. Muscles burn. Lungs burn. Eyes burn. At 4 we head home. Shower, dinner, a little reading, Star Trek, and exhausted collapse by 9.
Mother of puritan ethic always admonished hard work, "Or you will wind up a ditch-digger!" Which sounded horrible, but excusably my friend and I were there for the money for the life of guys. Motorcycle parts. Dates. We were to go back to our studies in September, but there were others with different purpose.
Porfy was a Mexican immigrant who worked alongside us every day. He was older, in his 40's, and had been with the company for several years. He rarely spoke as he knew little English, and there was suspicion that he was illegal and paid under the counter (Tony was not always up and up, and his heart gave out at 60). But Porfy never complained; about the heat, the dust, the tons of dirt and cement to be shoveled onto dump trucks. He squinted out from under his helmet with steady black eyes laid in sweat, and worked with purpose and efficiency missing from our strapping power. Because as I learned, he supported a wife and four children with this job - the same one I played at to score the smile of a girl at dinner and a trick fender for the Honda.
The first paycheck was pegged at $3 per hour, not the promised $5. What? All this for so Little? In what was the first of many discontinuities with authority, challenged the boss: Where was my money? "Well" he said, as if something else was promised, "You need to PROVE that you are worth $5 per hour." "I will ask your foreman Eddie, and if he agrees than you get your 5."
5 came in the next check, but the developer of the site ran short of money and the contractor laid us off - or so I was told. There was a kind of bounce off this job - which set me thinking about the people who make it happen by not complaining, rolling up their sleeves, and putting in good day's work. They are heroes too; like magnates and laureates, heart transplanters and evangelicals. They set aside great aspirations and risk, instead sacrificing hope of personal glory for the hopes and epic lives of others considered even greater.
There is a certain truth to goodness, even when wrongheaded, that imbues the spirit of leadership to the gallant efforts of workers who follow duty. Not everyone can be a great hero, but there is something transcendently noble in the silent toil of a family man.
Sep
21
Goodbye to a Friend, from Dr. Kim Zussman
September 21, 2006 | Leave a Comment
This weekend I was in San Diego at a periodontal convention, and on Saturday I took an all-day course in advanced pre-implant bone grafting. Most of the session was devoted to "monocortical block" grafts, which are plates of bone transplanted from thick areas of the chin and back of the jaw to deficient areas destined for dental implants. Though these techniques are in fairly wide use, the combination of substantial surgical risks with uncertainty whether grafted bone is actually supportive, suggested caution and sticking with more predictable cases.

We also toured the nearby wine-country of Temecula, and enjoyed wine-tasting with a couple we met at a winery. Celebrating their 30th anniversary, the gentleman told of his long career as an underground line electrician, and how the 13,000 volts can kill by electrocution or burns. On hot days, when electrical loads burn out transformers, they use an infrared gun to check the temperature of the transformers prior to opening them. In the days before such technology, if the transformers were too hot they would explode on opening. Then, the decision to open was based solely on experience.
As usual when visiting new places, one morning was spent jogged around the hills and canyons. This part of California is arid and warm, and though the picking season had passed some of the bunches were not harvested and there was the fragrance of fermentation on the vine. These grapes shrivel like raisins, and with high sugar are often made into delicious dessert wines such as the sweet pear Chardonnay and jammy Zinfandel varietals we tasted.
The Temecula valley is an eclectic mix of equestrian ranches, vineyards, tract homes, and large custom estates; all manifestations of various booms endemic to the area. The community has the ubiquitous turf battles, in this case between real estate developers and "save the vines". In that there is both a world-wide wine glut and cataclysmically declining real estate values, it is hard to tell just where the dust bowls first will howl.
On the drive back I was paged and had a terrible shock: on Saturday a colleague was struck by a car while cycling and had been killed. He was a humanist, extremely well regarded in the community, with a large, successful practice, and had left behind a wife of 25 years and two teen boys. He and I rode together several years ago, and in between steep hills we'd talk about life. This was before I gave up cycling following an accident that convinced me this wasn't the sport for a father. Recently, whenever I had see him he would chide me: "When ya gonna ride with us again?"
At the office today there were hushed tones as everyone discussed the tragedy, and some thoughts revisited from the past when others had died. There was guilt; I should have spent more time with him and now the opportunity is lost. Someone remarked, "Had he just left 5 minutes sooner, or later, or had the old woman driving altered her schedule, none of this would have happened".
The scientist explained that it was completely random; if you ride a bike there is always risk, and you cannot die in a cycling accident if you do not ride. And there were intrusive thoughts that were strange but familiar. Try to remember….what was I doing when the accident happened? Was there anything odd that day? The elderly driver who swerved as I jogged along the road? The fragrant grapes hanging too long as if by accident? Did I wonder about an inexplicable sadness in the eyes of the electrician, or the gait of an injured horse?
Even when we cannot ride together any more you teach me about the romance of senselessness.
Bruce Lee comments:
I offer you my condolences. I had similar misgivings about cycling (in Manhattan), but was fortunate to have my bike stolen, because it was doubtful I would have stopped. Before then, I came across the bicyclesafe website. The tips are common sense, but it is often useful to review the obvious anyway.
Sep
21
Equinox, from Craig Mee
September 21, 2006 | Leave a Comment

I have read a couple references to the Equinox and just too many cases to not to at least be respectful.
Legendary trader WD Gann claimed that more than any other day Sept 22 marks a turning point in capital + commodity markets. September 22nd (Friday) as a cycle date is Autumnal Equinox. The window includes the day before and after.
Could it be Natural Gas? Amaranth's long positions are probably squared now. Finally gas can rise? Could it be oil? Arbor's DSI Matrix shows oil's bullish sentiment at record lows as the price hits 9 month lows.
Could it be stocks? The Dow is just 200 points from an all time high. S&P trades are at a high for the year and the highest since February 2001, but in yearly resist 1301/1338.
Could it be bonds? The US 10 year is at a 6 month low yield.
It could be that the Autumnal Equinox passes without hitch, however it is worth noting that the few days around September 22nd have in the past marked major highs/lows and markets are trading at extremes.
Dr. Kim Zussman responds:
This looks like a testable question, so for a quick look I used SPY daily closes (yes, with dividends, including effects of deletions, additions, etc) since 1993 in the following scheme:
At the turn of each month, I noted the high close of a period of 7 days centered around the 22nd of each month. Then I compared this high with the high of a 40 trading day period centered on the same day. If there is a match, then the high close around the 22nd is a "major high" (not to be confused by anyone growing up in the 60's), and then note the month. Thus, if highs occurring around the 22nd of each month are major highs, and these are more common around the autumnal equinox, we would expect September (month 9) to dominate. BUT here is the list of months when highs around the 22nd corresponded with centered 40 day highs:
1
2
3,3
4
5,5,5
6,6
7,7
8,8
10
OK, no Septembers. Nor Novembers or Decembers.
My bet on margin is that equinoxes correlate best with calendar dates when the sun spends nearly equal time above and below the horizon.
Sep
12
‘How Low Can You Go!’ featuring Hillary Volartillery, from Dr. Kim Zussman
September 12, 2006 | Leave a Comment
Volatility of stock returns has declined markedly after the onset of Iraq II in March 2003. The price stability of the current period has been compared to the mid 1990's, as well as the event horizon at the edge of a black hole (terra no can see ya'). How stable is it?
DJIA daily returns were partitioned into non-overlapping 500 trading day (about 2 year) segments counting back from today to 1931. The standard deviation (vol.) of each segment was calculated, as was respective mean daily return.
Without giving away the entire plot, the answer is "A lot lower". The current 500 day standard deviation ranked 10th lowest out of 39 such periods. (You will get to see Hilly after the upcoming classroom scene).
Over most periods, high volatility accompanies concurrent low returns. This relationship was confirmed by regressing each 500 day period's mean daily return against the same period's standard deviation:
The regression equation is: mean return = 0.000769 - 0.0515 sd
Predictor       Coef       SE Coef      T      P
Constant       0.0007687   0.0001712   4.49   0.000
sd            -0.05150     0.01507    -3.42   0.002

S = 0.000496235   R-Sq = 24.0%   R-Sq(adj) = 21.9%
Looking further at whether the prior 500 days' standard deviation predicts the current 500 days' mean return, as usual, came up empty (slope coefficient N.S.). So it would seem that from a long-term historical perspective, current low volatility portends neither doom nor boom.
As promised, here are the dates and standard deviations of the 500 day periods, ranked low to high. One also notes the high vol. periods near the bottom, mainly around the depression, 1988 (containing 10/87), the start of WWII, and our old friend 2002:
Date        StDev.            Date        StDev.
12/23/1964    0.0050          1/15/1971     0.0084
1/23/1953     0.0054          12/9/1980     0.0087
1/16/1945     0.0057          11/20/1984    0.0090
1/19/1955     0.0057          12/23/1976    0.0093
1/21/1969     0.0059          1/20/1937     0.0094
10/12/1994    0.0060          10/29/1990    0.0096
12/16/1966    0.0063          1/22/1947     0.0097
1/9/1973      0.0065          12/1/1982     0.0101
1/3/1961      0.0066          9/16/2004     0.0109
9/11/2006     0.0066          9/20/2000     0.0116
10/3/1996     0.0066          9/28/1998     0.0116
1/9/1959      0.0070          1/20/1941     0.0127
1/22/1951     0.0074          1/2/1975      0.0129
1/20/1949     0.0074          9/20/2002     0.0140
1/15/1957     0.0075          1/19/1939     0.0167
12/15/1978    0.0078          11/4/1988     0.0175
1/19/1943     0.0079          1/23/1935     0.0214
12/28/1962    0.0082          1/14/1931     0.0218
11/13/1986    0.0082          1/11/1933     0.0312
10/20/1992    0.0082
Sep
11
Does the Mistress have NPD, from Dr. Kim Zussman
September 11, 2006 | Leave a Comment
Narcissistic personality disorder: (Summarized from DSM-IV-TR Fourth Edition)
Overview:
A pervasive pattern of grandiosity (in fantasy or behavior), need for admiration, and lack of empathy, beginning by early adulthood and present in a variety of contexts, as indicated by five (or more) of the following:

She has a grandiose sense of self-importance (e.g., exaggerates achievements and talents, expects to be recognized as superior without commensurate achievements).
She is preoccupied with fantasies of unlimited success, power, brilliance, her own beauty, or ideal love.
Believes that she is "special" and unique and can only be understood by, or should associate with, other special or high-status people (or institutions).
Requires excessive admiration.
Has a sense of entitlement - unreasonable expectations of especially favorable treatment or automatic compliance with his or her expectations.
Is interpersonally exploitative - takes advantage of others to achieve her own ends.
Lacks empathy: is unwilling to recognize or identify with the feelings and needs of others.
Is often envious of others or believes that others are envious of her.
Shows arrogant, haughty behaviors or attitudes.
Sep
6
Dr. Kim Zussman reviews The Devil’s Eye
September 6, 2006 | Leave a Comment
Don Juan the famous lover was dead and condemned to hell. Each day he awakes and chances to meet another lass who he proceeds to woo, until at last she begins to fall into his spell. Only just at the moment petals are quivering to fall from the rose, he would snap instantly back to the breeches of hell. This act he repeats every day, for an eternity of infinite frustration for Mr. Juan.
After much pleading by Don Juan to end his cycle of torture, the devil finds himself suffering with a sty. It turns out a vicar's daughter is still a virgin, and in seek of a cure the devil gives Don Juan a task to earn peace and be released from his condemnation. He was given one day on the surface to seduce the vicar's daughter, and if successful, he would be allowed to finally rest …
The irresistible Don was ecstatic — this would be easy! Up he went, and proceeded to work his unfailing magic on the lovely girl. She was a nubile blond maiden (there are lots of them in Sweden), 30 years his junior, graceful and sweet like a dream. Don proceeded to charm her, and though she resisted mightily she began to weaken. Yet before he could make the move that would save him from eternal condemnation, paradoxically something happened to him for the very first time. Don Juan fell in love.
He was tormented now. Could he violate his one and only love in the name of the devil, just to save himself? Even worse, his eternal charm began to flicker as he fell deeper in love with the girl, and his love made him look weak and pathetic to her.
Needless to say, Juan's infinite quests continue to this day.
Sep
5
Still Stable after all these Fears, from Dr. Kim Zussman
September 5, 2006 | Leave a Comment

Even with the recent pause in stocks that made Ben pause, volatility is still low and there has not been a steep decline in a while. How long exactly?
There are lots of ways to count this, but here is one: SPY daily closes 1993-present were checked to see if they were more than 10% lower than the high close of the prior 40 trading days (2 months). This method of screening does not specify the duration of the decline (bounded by 1, 40 days), only the magnitude, so the drops could span 2-40 days.*
Looking for declines this way does not eliminate all those nasty periods with many consecutive days meeting the loss 10%+ criteria, which clutters up attempts to gauge wait times between drops. To help with this, look-back days were counted only if the prior 3-days did not meet the 10%+ decline criteria.
Here are the ranked wait times, in trading days, between closes more than 10% less than the high close of the prior 40:
1160+, 388, 201, 161, 126, 98, 98, 50, 39, 39, 27, 24, 17, 11, 10, 10, 9, 9, 7, 7, 6, 6.
The top entry, 1160+, is from the start of the series in 1993, which you will recall from your almanac was another volatile period for stocks. The date of the next longest 388 day wait was April 2000, which more or less heralded the end of the 1990s bull run. (One wonders how many boys born 4/00 were named Herald).
History buffs will note that as of 9/1/06, the current streak without a big decline is 883 days-approaching the record length set in 1993.
Using macro analysis, compare and contrast the markets of the mid 1990's and today. Use this analysis to explain why volatility declined in both periods, and make a prediction of how many days are left before another down of 10%+. (This last bit turns the thing into an exam question for all the prof's on the list. If you use it please either send royalty of $0.25 to your ex-wife in my name, or mine in my name).
*this is a slight modification of something posted previously, only this way pins the day you look back from to survey your losses.
Sep
5
Waiting for Blotto, from Dr. Kim Zussman
September 5, 2006 | Leave a Comment
Along the lines of generational length of market regimes, I used DJIA daily closes to look at wait times between new 10 year highs (actually 2500 trading days). From the present back to 1928, each day looks back over the prior 10 years to see if it is a new high, and if so how many days has it been? Here is a graph of these results.
The bands of points cluster along two intervals (bull markets) when new 10 year highs were being set frequently: 1950-65, and 1982-2000. Notice there are gaps between the intervals, which represent the intervening bear markets of 1929-50 and 1965-82. During these bear periods, new 10 year highs were set infrequently (duh the market wasn't going up), so you see points during these periods representing many days. The longest was over 4000 days, and occurred in 1945, followed by 2500 in 1982, and 1677 in 1972.
Interestingly the current period (through 9/1/06) has not seen a new 10 year high for 1667 days (I put a point there to illustrate this, even though we have not yet seen the new 10Y high). So in 10 days, assuming the DOW does not jump over 300 points (i.e. youtube video of sniping Osama with a 50 cal. in slo-mo), we will be in the third longest wait since the 1930's!
Who cares? Perhaps these many-year length intervals are related to generational risk-aversion and memory of losses and ruin, which go on vacation when a new generation's pockets fill up. If the size of the gaps between bull markets has such consistency, the gap we are now in may have a number of years to go.
Sep
5
When Doomsdayists are the Photographers, from Russell Sears
September 5, 2006 | Leave a Comment
I consider myself lucky that my studies of the markets began with Investments by Bodie, Kane, and Marcus. Then before I could be corrupted, I started reading Vic and Laurel's books. The study of "Investments" begins by reading the difference between "real assets" and "financial assets". Then it explains their relationship to each other. How financial assets are used to transfer real wealth. This foundational underpinning often will clarify the fallacy in the arguments of the prophets of doom.
When the doomdayist is the photographer, one of the most common deceptions is to magnify the problem, then focus on only one side of the picture completely blurring the other side. He artistically crafts this clear snapshot of one side of the current state. Then he imagines a future world with both sides, but doomed to failure because of its imbalance.

Being interested in demographics, I often will read articles about the impending boomers retirement. This also is one of the doomsdayist most fertile grounds. The USA's boomers, the most productive generation in history will go from being a net producer of wealth to a net consumer. Transfers of this wealth will occur, either through boomers life or at their death. Because many in this generation have amassed a fortune, framing such pictures to imply your prophetic ability is a rich field. Also boomers want to know how this transfer will occur, to determine how to position their wealth. Do you hold "real assets" or "financial IOU's"?
Because of this great wealth, it is the rare author that will take a balanced look at how this transfer of wealth will occur. Often I find articles that will use the actuarial approach to the boomer's problem, that is taking the present value of future benefits then look at the current US debt and add it on to this social security present value and perhaps throw in a the present value of other future government debts.
All of this is put in fiscal terms, with mind numbingly large numbers even the most numerically literate has trouble understanding. The real wealth currently held by the US and the boomers is an ignorable blur. The conclusion is that the only solution is to devalue this debt by inflating your way out of it. Therefore you hold "real assets" such as gold, a doomsdayist favorite. This is of course what every generation X, Y, and Z'er will want; gold, hard assets.
This perhaps shows the brilliance of Mr. Gross's recent article No Cuts, No Butts, No Coconuts. He, like a good doomsdayist photographer, magnifies the problem. But unlike the fiscal doomsdayist, he focuses on the real imbalance. That is that the boomers have the real wealth, and the demand for that wealth will decrease. He uses housing as the basis for every real assets. He insist there will be a slowing of demand for housing therefore implies a slowing of demand for everything real. He implies that you especially do not want to hold a real company producing real wealth. He implies you certainly do not want to bet on the US, the current largest holder of the world's real wealth.
The intended message of this deflation is of course you want to hold bonds, or fiscal assets. Remember he is the biggest bond salesman around.
I would suggest that the truth lies somewhere in between. Boomers will have to transfer that wealth to someone. Generation X, Y and Z'ers clearly will not have to work as hard to obtain that wealth as the boomers did.
However, much of this ease in effort to meet needs will be due to increases in productivity, not totally inflation. There will be a slowing of demand for some assets, and a growth in demand for others. The more we look to the emerging markets to make up the shortfall in human capital, the more basis goods will be in demand. The more we look inward the more scientific discovery, quality and artistic expression, the human element, will be valued.
The younger generation will not lose an interest in obtaining wealth once their survival needs are meet. The US will not suddenly lose its real wealth advantage to motivate others. Neither will it loses its foundational ability to through creative destruction and nurturing of the individual spirit to produce wealth.
There will always be problems to solve and people reaching for the stars. In fact I would argue that, in a world where the fundamental shortage is human capital, in this world the wealthiest nations will be those that give the individual spirit the most freedom, not just the nations with the most humans.
Scott Brooks adds:
I have said this before, and I will say it again (even thought I am resoundingly ridiculed for saying it); losses hurt you more than gains help you.

If the premise of the long term positive drift of the market is true (which I believe it is), then getting good returns is simply a function of "showing up at the party". All one has to do is be there to get good returns. Unfortunately, getting good returns is not good enough.
Human beings are ruled by a two sided coin: greed and fear. When things are going well, we and forget the adage that "things are not as good as they seem", or worse yet, we think we are smarter than we really are. So we get greedy. "Hey, look at my returns, I'm pretty smart…so If I'm smart enough to get these returns, then why not go on margin, leverage the money and double, triple, quadruple my returns!"
And of course, you remain a genius, and/or your intelligence increases in direct proportionality to the acceleration or momentum of the "positive drift of the market" until the momentum or positive drift stops. Then you find out, in a very painful manner, what a margin call is.
Maybe you are not leveraged, maybe you just bought into the "safe stocks", argument, or the "new economy" stocks argument, or the "positive earnings" argument. And your newly acquired personal genius told you to hold onto to Cisco at 50 because it was recently up at 80 and it should be worth at least that much. Or Coca Cola, because it had positive earnings growth all thru '00, '01, '02. Or because the long term positive drift of the S&P 500 said keep being "long" even though the 1550 high ('00) is where it should be and not at 755 ('02) it got down to or even the approximately 1300 it is at now.
You see, it is during these times that the other side of the human nature coin rears it ugly head. Fear! Fear leads to rationalization. It leads some to be afraid to sell for fear of missing out on a big run … and thus they ride Cisco down to 12, or Enron to pennies, or Global Crossing to zero! Or maybe you sell after losing half your stake, and you become fearful and indecisive as to when to buy ever again, and the first time the market hiccups, you panic and have sleepless nights, and ulcers.

It does not matter how well you do when times are good. It does not matter how much you make during the market that has such a "positive drift" that tow truck drivers can buy an island, or dot com companies can advertise a monkey playing around in a suburban home garage for 30 seconds during the Super bowl and not even mention their name or what they do (or when tulip bulbs go from $1 to $600 and someone named Newton who missed out on the rise from 1 - 600 finally decided to jump on the tulip bandwagon). It does not matter during those times. What matters is how good you are during the bad times!
It does not matter what you make, it matters what you keep. It doesn't matter if you get 10,000% return, if you lose it all during a market hurricane.
The beaches of Florida may have long term positive effects on human beings (sunny days, warm weather, refreshing water), but you better get your butt off that beach when a hurricane is coming. Why? Because its hard to enjoy the beach if you are dead.
It is hard to enjoy the long term positive drift of the market if you have lost your nest egg, seed money, portfolio, clients, etc. Therefore, I submit to the site that the most important activity for any of us, is to become absolute experts at determining what is the likelihood that the markets are likely to decline. Therefore we should discuss what are appropriate courses of actions to take during those times. How do we recognize them? How do we know that the risk levels in the market are elevated?
What I am saying has nothing to do with being a bear, or discussing fear. It has to do with reality. How do we achieve good solid returns during the good times, and then preserve those gains during the bad times so that when the bad times are over, we have our portfolio intact and we can ride the new long term positive drift (the next wave) of the market again.
Why do I suggest this? Because losses hurt you more than gains help you!
Steve Leslie comments:
Nietzsche said that which does not destroy you makes you stronger. I say that depends on a person's evaluation of the experience. It hurts more when it is personalized.

Behavioral psychologists tell me that people avoid pain more than they seek pleasure. Or more importantly perceived pain. I am not a behavioral psychologist so I will allow some others to chime in.
After a plane crash people are reluctant to fly in a plane even though they stand a far greater chance of being killed driving to the airport. From personal experience I know that losses stay longer in your memory than wins. I can tell you every bad hand that has knocked me out of a major tournament. Or the putt I missed that cost me the club championship.
Everyone says they want the ball at crunch time but only a few of them really mean it. The rest hope that they are not called upon to face Mariano Rivera with the game on the line. Or having to make a knee knocker to go into a playoff with tiger Woods. (See Chris Dimarco at the Masters).
How about this one. Get a 50 percent return for 2005 receive your industries highest award CTA of the year, and then have a few months of drawdowns. Now you are a heel. It goes with the territory. Schadenfreude is ubiquitous.
It is a lot easier to be average or above average than it is to be exceptional or superior. It takes different wiring. Most analysts and all Re-elected politicians understand this, at least those who have long careers.
Dr. Kim Zussman contributes:
One hypothesis is that bull and bear markets have some correlation with the investment lifetimes of generations living through various markets.
For example my parents, who lived through the depression, did not own stocks when they were young because (besides not having much money) they had directly witnessed ruin. It was not until a close family friend did well in the bull of the early 1960's that they bought in the late 60's, and held down through the mid-70's. Thus from then on they eschewed stocks, pronouncing the mantra "Lost $20,000 in the stock market".
Undoubtedly there were many families burned like ours who got and stayed out by the end of the 1970's. By then, boomers only vicariously touched by the bad market of the 70's were becoming flush enough to buy stocks and help fuel the great bull that ensued.
So if painful memory of investment losses has lifetime effects in many people, this could explain some of the decade-length duration of bull and bear markets. And what effect, if any, the 2000-03 decline will have on the current cohort would seem to be a vital question.
Scott Brooks replies:
 All good insights, but I am not talking about just having some losses, I am talking about having a methodology to measure risk and the likelihood of downturns. How does one survive 1968 - 1982, or 1939 - 1946.
It seems to me that long term secular bear markets can be devastating to the long term drift theory. Just as a hurricane can damper the Florida beach experience. Markets seem to go thru long term secular trends. The last great bull basically lasted from 1982 - 1999, the one before that from 1950 - 1967.
If one looks at a chart of the long term market one will see that the long term bull cycles are punctuated by basically smooth sailing with the wind blowing pleasantly in the direction that we want to go. All one has to do in those markets is basically index and let the markets blow you to prosperity.
But if one looks at the long term bear cycles (for the sake of this discussion, a long term bear cycle is one where the market goes down and then takes many years to get back to its past high levels…i.e. it hit a high in 1968, proceeded to go down, and then did not get back to that high until 1982), one will notice that they last a long time (usually longer than a long term secular bull cycle) and one will notice that, unlike the smooth sailing of the long term bull markets, they are punctuated with extreme volatility.
Now I know that there are/were big downturns in the last bull market (1987, 1990, 1994, 1998 just to name a few) but they were quick. They went down, and within a short period of time (less than 18 months in the case of 1987) they were back to new highs. All I am saying is that there has to be a way to preserve capital during these downturns. There has to be a way of measuring the likelihood of their occurrence.
Make no mistake about it. I am a bull. But it is my job to be realistic about the markets, asses them and figure out a way to make my clients money. I do not care if the market is going up or down. It is my job to:
- Preserve my clients capital
- Grow my clients capital
- Perform actions 1 & 2 with the least amount of risk necessary
So, my questions to the are simply:
How do we reliably measure risk? How do we manage the portfolio's during higher risk times? How do we make a profit when conventional methodologies (i.e. long term drift) is out of favor, or when our personal pet systems, markets, sectors, regions, investment types, are out of favor, because they are experiencing a long term secular bear market?
Abe Dunkelheit contributes:
Marcel Duchamp, the famous French artist, was sharply criticized for his attitude towards the French Resistance in WWII. Instead of fighting against the Nazis he emigrated to the United States. In an interview he explained his attitude. He said to him it appeared that in any conflict there is a third alternative besides fighting for or against a perceived evil, which is withdrawal! Of course 'withdrawal' is a highly individual response to conflict; it cannot be the strategy of a whole nation. No wonder that such an attitude must seem to be anti-patriotic from the group's point of view.

The idea of long term investment is an illusion because investors as a group cannot survive the bear market periods. (The individual can but not the investors as a group.) The paradoxical situation is that the illusion of long term investment is necessary to keep the economy going. If we look at the wealth of the nation as an aggregate we see it growing; but if we look at individual lives we see much misery. Why is that? Because the wealth of the nation comes at a price! The price is the sacrifice of personal happiness. The welfare of the group depends on behavior that is not good for the individual! For the whole nation the investment meme is good but for the individual it is not!
What can one do? One can develop extremely individual solutions. I think one must become extremely individual in order to survive bad things which tend to hit whole nations. One must totally stay away from the crowd and eradicate anything which is crowd-like in one's own bosom. A lot of unconventional thought must go into the question of 'investment' but nothing definite can be said in an email.
There are many unpleasant truths and one must look at them. "When killers stop killing they get killed." (A wise gangster in a movie.) I do not know if I can make myself understood. What I am basically saying is that 'investment' cannot work for the many, not in the way it is advocated; it works only for the few, but in order to work for the few it needs the many. The whole thing, from a humanistic point of view, is perverse. Trading is not 'human', neither is 'life'. Yet, paradoxically, the long term effect of this 'inhumanity' is economical growth and prosperity, which is good for the group, at least in theory, but comes at a price, which is the sacrifice of the individual, because the individual member of the group ('the many') must be tempted to act in ways which are, from the individual point of view, not good.
As an example for unconventional ways of thinking/acting I studied how to lose money. It is said, people hold on to losers and cut winners. Some time ago I opened an FX account and traded such a strategy: buy low, sell high, based on hunches, otherwise hold (no stops). I did 100s of trades - and broke even! I had a dozen big losers which offset the 95% small winners. Now that was a basis to work from; I gained some highly precious insights from this experience. I learned, for example, that it is not wrong by default to hold on to losers and cut winners; what is wrong is doing this without regard to the liquidity process.
Among many other things, I noticed the unhealthy tendency to increase exposure after a particular market had gone up! In my opinion that is the real reason why people lose money. They tend to do the right thing after experiencing it was the right thing - only that it is now the wrong thing.
I also noticed that trading in and out of stocks is not increasing profits; but dramatically reduces drawdowns. I further noticed that profits tend to come 'like thieves in the night' - rather unexpected. I learned I cannot predict and do not predict. 90% of what I am doing is exposure (or inventory) management. No single decision holds meaning to me; I look and think in terms of the 'whole'. My trading tended to be highly fragmented and I had to stay focused all the time which was draining. Now I am still trading very actively but with a detached attitude, rather disinterested in any particular move. I hardly ever react. Almost all of my trades (entry/exit) are placed before the markets open. I also noticed that when the markets turn busy that this does not necessarily mean I will trade more; it means I will think more!
Finally, I was surprised how small but good decisions can add up to quite substantial profits. There is more to it, like a positive attitude; also useful is following news in conjunction with particular moves. I noticed that moves in individual stocks are often explained by news that are already known to the market for a week or more (like DELL); also that stocks can go up with hardly any comments (like EBAY). I also realized that it seems to be a good time to buy a stock now and not later when people recommend to buy it not now but later (like AMD).
Tom Ryan mentions:
In reply to Scott, it seems to this rather sunbaked speculator that there is an inherent conflict in logic here in the sense that having a long term goal, in this case growing capital, but an operational plan that is geared to minimizing a negative event in the very short term (preserve capital), well this will always produce a sub-optimal solution. if a client comes to me and says five years from now I want to look back and have made a 15% CAGR (doubled my money) but I don't want to suffer more than a 25% loss in any one year, then the reply has to be that really, they do not have a five year plan, they have a one year plan for each of the next five years. In other words the short term operating constraint always overrides the long term plan. Always.
As for risk, there is absolutely no reason for anyone to hire a money manager in order to pursue below average market risk as anyone can do that by calling 1-800 VANGUARD and apportioning the appropriate %s to stock and short term bond index funds to get whatever risk level they want. The only reason to hire a money manager is, to use Tim's phrase, to "pursue alpha". Now all strategies to pursue alpha boil down to one of two things, either selective/focus of positions (hopefully into things that will do better than the market average), or increased turnover of positions (trading). Theoretically, therefore, it is not possible to pursue alpha without above average risk. And yes, before I get 15 replies to this email (including from Melvin) it is possible to show in retrospection how someone or some strategy achieved higher returns with below average volatility or risk in the past, but theoretically, from day(0), all alpha pursuing non-indexed strategies have higher than average risk.
So at the end of the day the issue of how to grow and preserve capital at the same time, or grow capital whilst minimizing risk, can not be solved without proper definitions of risk, such as target CAGR, the significant time horizon, maximum leverage allowed, and what constitutes impairment of capital. Even with these factors mathematically defined, the solution will always have to be probabilistic rather than deterministic because we can only use the past behavior to construct general distributions which can guide us as to future expected behavior. Hence we have come full circle to my first assertion that there is a logical conflict between growth and preservation of capital i.e. your items one and two.
As a postscript: I suppose the one other reason for a layperson to hire a money manager even if they are not pursuing alpha would be to avoid fraud risk as brokers are subject to fraud from time to time. but fraud risk is hard to detect beforehand even for professionals as the past 10 years has repeatedly demonstrated. You can probably achieve the same effect much easier simply by some diversification.
Russell Sears adds:
I would disagree, short term draw downs do not always out weigh the long term goals, just usually. To paraphrase a recent conversation I had with Gordon H. "Principle protection is currently the biggest scam on Wall Street." Anybody that understands indexed options could design a plan that maximizes your exposure to a market, but limits your yearly loss.
The problem is two fold. One, doing so causes you to give up tremendous potential earnings, opportunity cost is high, as you suggest. Second, most advisers on Wall Street upon hearing this their mouths will salivate, they spotted the chump at the table.
How, do you get the client to understand you cannot make money without taking risk? And how do you explain that such a "no losses allowed" strategy, is a chump strategy that those without any integrity will gladly execute at your expense?
I wish I knew the answers, to that last one especially. My current strategy is to assume that most people with money are comfortable acknowledging "business risk", and you have to take business risk to make money. So I try to present "investment" risk as diversification of their current risk… it just has solid $ figures attached to it.
« go back —Archives
- July 2026
- June 2026
- May 2026
- April 2026
- March 2026
- February 2026
- January 2026
- December 2025
- November 2025
- October 2025
- September 2025
- August 2025
- July 2025
- June 2025
- May 2025
- April 2025
- March 2025
- February 2025
- January 2025
- December 2024
- November 2024
- October 2024
- September 2024
- August 2024
- July 2024
- June 2024
- May 2024
- April 2024
- March 2024
- February 2024
- January 2024
- December 2023
- November 2023
- October 2023
- September 2023
- August 2023
- July 2023
- June 2023
- May 2023
- April 2023
- March 2023
- February 2023
- January 2023
- December 2022
- November 2022
- October 2022
- September 2022
- August 2022
- July 2022
- June 2022
- May 2022
- April 2022
- March 2022
- February 2022
- January 2022
- December 2021
- November 2021
- October 2021
- September 2021
- August 2021
- July 2021
- June 2021
- May 2021
- April 2021
- March 2021
- February 2021
- January 2021
- December 2020
- November 2020
- October 2020
- September 2020
- August 2020
- July 2020
- June 2020
- May 2020
- April 2020
- March 2020
- February 2020
- January 2020
- December 2019
- November 2019
- October 2019
- September 2019
- August 2019
- July 2019
- June 2019
- May 2019
- April 2019
- March 2019
- February 2019
- January 2019
- December 2018
- November 2018
- October 2018
- September 2018
- August 2018
- July 2018
- June 2018
- May 2018
- April 2018
- March 2018
- February 2018
- January 2018
- December 2017
- November 2017
- October 2017
- September 2017
- August 2017
- July 2017
- June 2017
- May 2017
- April 2017
- March 2017
- February 2017
- January 2017
- December 2016
- November 2016
- October 2016
- September 2016
- August 2016
- July 2016
- June 2016
- May 2016
- April 2016
- March 2016
- February 2016
- January 2016
- December 2015
- November 2015
- October 2015
- September 2015
- August 2015
- July 2015
- June 2015
- May 2015
- April 2015
- March 2015
- February 2015
- January 2015
- December 2014
- November 2014
- October 2014
- September 2014
- August 2014
- July 2014
- June 2014
- May 2014
- April 2014
- March 2014
- February 2014
- January 2014
- December 2013
- November 2013
- October 2013
- September 2013
- August 2013
- July 2013
- June 2013
- May 2013
- April 2013
- March 2013
- February 2013
- January 2013
- December 2012
- November 2012
- October 2012
- September 2012
- August 2012
- July 2012
- June 2012
- May 2012
- April 2012
- March 2012
- February 2012
- January 2012
- December 2011
- November 2011
- October 2011
- September 2011
- August 2011
- July 2011
- June 2011
- May 2011
- April 2011
- March 2011
- February 2011
- January 2011
- December 2010
- November 2010
- October 2010
- September 2010
- August 2010
- July 2010
- June 2010
- May 2010
- April 2010
- March 2010
- February 2010
- January 2010
- December 2009
- November 2009
- October 2009
- September 2009
- August 2009
- July 2009
- June 2009
- May 2009
- April 2009
- March 2009
- February 2009
- January 2009
- December 2008
- November 2008
- October 2008
- September 2008
- August 2008
- July 2008
- June 2008
- May 2008
- April 2008
- March 2008
- February 2008
- January 2008
- December 2007
- November 2007
- October 2007
- September 2007
- August 2007
- July 2007
- June 2007
- May 2007
- April 2007
- March 2007
- February 2007
- January 2007
- December 2006
- November 2006
- October 2006
- September 2006
- August 2006
- Older Archives
Resources & Links
- The Letters Prize
- Pre-2007 Victor Niederhoffer Posts
- Vic’s NYC Junto
- Reading List
- Programming in 60 Seconds
- The Objectivist Center
- Foundation for Economic Education
- Tigerchess
- Dick Sears' G.T. Index
- Pre-2007 Daily Speculations
- Laurel & Vics' Worldly Investor Articles