Oct
3
Trend days, from Zubin Al Genubi
October 3, 2026 |
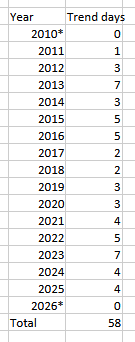
Remember trend days? Recently trade has been, I wouldn't say choppy, but with a lot of reversals. The legs are better than trend days in the past, point wise at least. Which led me to study trend days over the years. See how they cluster, and there have been none this year, at least how I defined them. Interesting to say the least. What does it mean? Algos? …that's my theory.
Adam Grimes asks:
What definition are you using?
Zubin Al Genubi answers:
Pick one, any one will do. The moral of the story is the same. Hint: These were up days only.
Adam Grimes responds:
I think the definition matters quite a bit. I would typically work with a definition like:
- opens near the low, closes near the high
- range > X * ATR(20) (starting with values of something like 3 for X)
Key concept is a larger-than-average day with open and close at opposite ends of the day. The reason I asked is I count far more than you do so I wondered if you were looking at "truly exceptional" days. I'll take a look at distribution by year later today.
I don't see any value in thinking in points, either. Saying the legs are longer point-wise when the price level is so much higher doesn't say anything at all, right?
I don't replicate your numbers at all. These are using open and close in the bottom/top X of the range. One table for day's range > 1.5 * ATR, the second for > 2 * ATR. I can't imagine the usefulness of extremely restrictive criteria for trend days, which is why I asked how you were defining them. At any rate, ES futures do not bear out your claim. What am I missing?
[Click to view tables.]
Bullish days: high-low range > 1.5 * ATR(20) table.
Bullish days: high-low range > 2 * ATR(20) table.
And why only look at bullish days? The thesis collapses further when we consider both directions (which I would argue we should do).
Bearish days: high-low range > 1.5 * ATR(20) table
Bearish days: high-low range > 2 * ATR(20) table
Is my math off? (Seriously asking, working with a relatively new and somewhat unvetted system here.) Or what am I missing?
Zubin Al Genubi writes:
Adam, My definition was pretty tight so your math is not off, my def is not too good. I subsequently did down days, which were larger than up days, and fewer of them. I am trying to find conditions that precede trend days. The only thing I am seeing is other trend days, like those 3 big up days 2 months ago ( which my system did not catch) Still playing with it as well.
Adam Grimes offers:
Interesting timing. I'm redoing some old work on the same subject:
A new look at measuring trend days
Catching the wave: ideas for finding trend days
Finding trend days in index futures
Ralph Vince offers:
Isn't it vital as well that the open be nearly the same as the low or the high!
Zubin Al Genubi responds:
There are a lot of interesting ways to define it, and I like your percent of new bar highs one. The range constriction break out is a good precursor. I've found there's not that many trend days so it doesn't seem like something to count on. I have a few more definitions I will be looking at: range efficiency |C-O|/(H-L), Kaufman efficiency ratio: |C-O|/\sum|\Delta C|, Choppiness-type ratio: total path divided by daily range, e.g. \sum|\Delta C|/(H-L). I just used retracement for the post.
I found an average of 28 trading days between trend days, but with wide dispersion over the years. Some years more, some less. That's what led me to the study, my observation of few trend days, lots of Z days this year, with long too straight un-choppy, overly efficient legs, caused by (in my theory) by bots.
Looking at your low vol triggers (for example NR5,NR7) over that last 5 years, I'm finding it persists to the next day. Not what I would have expected. Also, I found 0 instances of 3-consecutive-decreasing inside days (Russian Doll set up) over the last 10yrs!
Adam Grimes writes:
Yes, that no longer surprises me (failure of low vol triggers). Technical analysis literature and marketing has a lot to say about compression as a trigger. I don't think it's any kind of trigger. What's the best predictor of tomorrow's volatility? In models, the answer is today's volatility, by a wide margin. (Consider ARCH and GARCH models.) So low vol tends to lead to further low vol. (Also the observation one of our list members misses when he's concerned about low VIX = impending market crash.)
But if and when you DO get a move out of low vol it tends to be more directional and probably leads to a higher probability of trend days. One issue with all of this work is that good trend days are sparse enough you can't really generate reliable stats.
Zubin Al Genubi observes:
There were only 7 bottom tick/top tick day in the last 15 years and no perfect down days. So the definition needs to be wider. I used 10/90.
Adam Grimes responds:
Yes it has to be something like this. There's also a trend day subset where one part of the day might be a powerful and large trend and the other a range or a trend in the opposite direction. Intraday data can obviously untangle this, but one of the limitations of using daily data is that these types of days will be missed in the count.
Comments
Archives
- October 2026
- September 2026
- August 2026
- July 2026
- June 2026
- May 2026
- April 2026
- March 2026
- February 2026
- January 2026
- December 2025
- November 2025
- October 2025
- September 2025
- August 2025
- July 2025
- June 2025
- May 2025
- April 2025
- March 2025
- February 2025
- January 2025
- December 2024
- November 2024
- October 2024
- September 2024
- August 2024
- July 2024
- June 2024
- May 2024
- April 2024
- March 2024
- February 2024
- January 2024
- December 2023
- November 2023
- October 2023
- September 2023
- August 2023
- July 2023
- June 2023
- May 2023
- April 2023
- March 2023
- February 2023
- January 2023
- December 2022
- November 2022
- October 2022
- September 2022
- August 2022
- July 2022
- June 2022
- May 2022
- April 2022
- March 2022
- February 2022
- January 2022
- December 2021
- November 2021
- October 2021
- September 2021
- August 2021
- July 2021
- June 2021
- May 2021
- April 2021
- March 2021
- February 2021
- January 2021
- December 2020
- November 2020
- October 2020
- September 2020
- August 2020
- July 2020
- June 2020
- May 2020
- April 2020
- March 2020
- February 2020
- January 2020
- December 2019
- November 2019
- October 2019
- September 2019
- August 2019
- July 2019
- June 2019
- May 2019
- April 2019
- March 2019
- February 2019
- January 2019
- December 2018
- November 2018
- October 2018
- September 2018
- August 2018
- July 2018
- June 2018
- May 2018
- April 2018
- March 2018
- February 2018
- January 2018
- December 2017
- November 2017
- October 2017
- September 2017
- August 2017
- July 2017
- June 2017
- May 2017
- April 2017
- March 2017
- February 2017
- January 2017
- December 2016
- November 2016
- October 2016
- September 2016
- August 2016
- July 2016
- June 2016
- May 2016
- April 2016
- March 2016
- February 2016
- January 2016
- December 2015
- November 2015
- October 2015
- September 2015
- August 2015
- July 2015
- June 2015
- May 2015
- April 2015
- March 2015
- February 2015
- January 2015
- December 2014
- November 2014
- October 2014
- September 2014
- August 2014
- July 2014
- June 2014
- May 2014
- April 2014
- March 2014
- February 2014
- January 2014
- December 2013
- November 2013
- October 2013
- September 2013
- August 2013
- July 2013
- June 2013
- May 2013
- April 2013
- March 2013
- February 2013
- January 2013
- December 2012
- November 2012
- October 2012
- September 2012
- August 2012
- July 2012
- June 2012
- May 2012
- April 2012
- March 2012
- February 2012
- January 2012
- December 2011
- November 2011
- October 2011
- September 2011
- August 2011
- July 2011
- June 2011
- May 2011
- April 2011
- March 2011
- February 2011
- January 2011
- December 2010
- November 2010
- October 2010
- September 2010
- August 2010
- July 2010
- June 2010
- May 2010
- April 2010
- March 2010
- February 2010
- January 2010
- December 2009
- November 2009
- October 2009
- September 2009
- August 2009
- July 2009
- June 2009
- May 2009
- April 2009
- March 2009
- February 2009
- January 2009
- December 2008
- November 2008
- October 2008
- September 2008
- August 2008
- July 2008
- June 2008
- May 2008
- April 2008
- March 2008
- February 2008
- January 2008
- December 2007
- November 2007
- October 2007
- September 2007
- August 2007
- July 2007
- June 2007
- May 2007
- April 2007
- March 2007
- February 2007
- January 2007
- December 2006
- November 2006
- October 2006
- September 2006
- August 2006
- Older Archives
Resources & Links
- The Letters Prize
- Pre-2007 Victor Niederhoffer Posts
- Vic’s NYC Junto
- Reading List
- Programming in 60 Seconds
- The Objectivist Center
- Foundation for Economic Education
- Tigerchess
- Dick Sears' G.T. Index
- Pre-2007 Daily Speculations
- Laurel & Vics' Worldly Investor Articles
