Jul
10
Happy Infections, from Kim Zussman
July 10, 2010 | Leave a Comment
I found this article on how happiness and sadness are like infectious diseases very interesting.
Anton Johnson adds:
Correlated to feline population density?
Jul
3
Vol to Vol Part 10, from Kim Zussman
July 3, 2010 | Leave a Comment
Last week SPY dropped 5.2%. Going back to 1993, ranked weekly drops by % as follows:
1: 1-2%
2: 2-3%
3: 3-4%
4: 4-5%
5: 5-6% (like last week)
6: 6-7%
7: 7-or more % (7,7,7,8,8,10,10,19)
Then checked following week's return.
The chart compares variance of next week by prior week's 1-7 ranking; another version of "the wilder it gets the wilder it gets"

Using the same ranking system, this chart compares mean returns of weeks after down weeks ranked 1-7 to the mean returns after weeks declining between 1-19%.

The mean return is positive (NS, see below), but without a monotonic relationship with size of prior week's decline.
One-Sample T: nxt wk
Test of mu = 0 vs not = 0
Variable N Mean StDev SE Mean 95% CI T P
nxt wk 242 0.0038 0.0340 0.00219 (-0.00051, 0.00811) 1.73 0.084
Jul
1
Black Cross, from Kim Zussman
July 1, 2010 | 1 Comment

The 50D moving average of SPY may soon cross below it's 200D MA. Looking for instances when this occurred, AND it was the first downward cross in at least 20 days, found 6 instances since 1993. The following 5D tests bearish, but 10D and 20D are flat:
Date 5D 10D 20D
12/28/07 -0.042 -0.041 -0.077
10/01/98 -0.022 0.072 0.107
11/02/00 -0.019 -0.037 -0.073
04/29/94 -0.008 -0.013 0.017
08/25/04 0.002 0.012 0.003
07/25/06 0.004 0.006 0.027
avg -0.014 0.000 0.001
stdev 0.017 0.042 0.069
n 6 6 6
t -1.98 0.00 0.02
Jul
1
Down First Half, from Kim Zussman
July 1, 2010 | Leave a Comment
DJIA is down about 5% this year, Jan-June. Going back to 1928, for 1st half declines between -2% and -10%, here are the next month (July), 3-month, and 6-month return means:
Jan-Jun nxt 1mo nxt 3mo nxt 6mo
avg -0.065 0.000 -0.040 -0.026
stdev 0.022 0.053 0.126 0.191
n 20 20 20 20
t -0.02 -1.42 -0.61
>>Nothing much; 3mo somewhat bearish.
Same check on 1st half declines worse than -10% tested bullish for Julys, and N. S. for 3 and 6 mo.
The 3mo following down 1Q tests significantly less than all (non-overlapping) 3 mo periods, but 1-mo and 6-mo are not different. Which is a different question than is mkt up?
July all mo
Mean 0.000 0.005
Variance 0.003 0.003
Observations 20.000 974.000
Hypothesized Mean Difference 0.000
df 20.000
t Stat -0.436
P(T<=t) one-tail 0.334
3 mo all 3mo
Mean -0.040 0.016
Variance 0.016 0.011
Observations 20.000 325.000
Hypothesized Mean Difference 0.000
df 21.000
t Stat -1.949
P(T<=t) one-tail 0.032
6 mo all 6mo
Mean -0.026 0.032
Variance 0.036 0.020
Observations 20.000 163.000
Hypothesized Mean Difference 0.000
df 22.000
t Stat -1.306
P(T<=t) one-tail 0.103
Jun
28
We Need Inflation Now, by Kim Zussman
June 28, 2010 | 1 Comment
Attached chart of TIP/TLT (Inflation-indexed bond etf / 20Y bond etf) shows recent roll-over in the wrong (deflationary) direction for those seeking easier repayment of debts and waving of flags over tracts of appreciating houses.
OTOH it is a good direction for those seeking more stimulus and associated nest-feathers.

Kim Zussman refines his views:
A friend, Sam Humbert, pointed out that TIP and TLT differ in duration (~3.7 yr vs ~20). So to better isolate on inflation, here is a chart of TIP/SHY (SHY= 1-3yr Treasury bond ETF).
The recent move for TIP/SHY is up; opposite to TIP/TLT, showing a significant yield-curve-change component is affecting the former chart. I conclude that the market is more concerned recently about inflation at a 3 year horizon.

Rocky Humbert comments:
The current inflation "breakeven" for 5 Year TIPS versus 5 Year T's is 1.56%.
The current inflation "breakeven" for 10 Year TIPS versus 10 Year T's is 1.91%.
This is the least worst measure of of "investor inflation expectations."
It's important to recognize that TIPS funds (and secondary market TIPS) have a variety of complex technical and tax nuances that make apples-to-apples comparisons with straight Treasuries difficult or misleading.
For example, a taxable buyer of seasoned TIPS who experiences deflation followed by inflation can have a strikingly different total return than a buyer of seasoned TIPS who experiences inflation followed by deflation. This path dependency does not occur in regular Treasuries.
And if one is really clever, one can try to understand the WIP etf … which is based on the DB Global ex-US Inflation Linked Index….
Al comments:
I must fight the war against my own ignorance here: What is a "seasoned" TIP?
Rocky Humbert responds:
Asking a question is not a sign of ignorance. It's a sign of wisdom.
A seasoned TIP is both a delicacy at my local steakhouse, and it's an inflation-linked bond that's been trading in the secondary market for a while. The TIP's par amount increases by a CPI factor (when the CPI is positive), and the par amount decreases by a CPI factor (when the CPI is negative).
So, for back-of-the-envelope purposes, if you invest $1mm in a particular TIP bond after it's been through a few years of inflation, and then you hold it through a few years of deflation, it's theoretically possible to lose money even if you hold it to maturity. An analogous extreme example would be if you buy a mortgage-backed security in the secondary market with a 6% coupon and a price of 108 … and the homeowner(s) unexpectedly refinance … and you suddenly get 100 back….losing 8 points.
Easan Katir pleads:
The country has had so many years, decades, of rewarding borrowers and spenders through creeping inflation. How about at least a few years for the ones who have scrimped and saved, are unleveraged and tired of paying more for everything every year for most of one's lifetime. Deflation is wonderful. Everything is on sale.
Nick White writes:
That is, of course, until you lose your job because your employers has gone bankrupt from falling prices…. ![]()
Stefan Jovanovich comments:
Neither deflation nor inflation is wonderful because both are founded in dishonesties; their prices are not set by ongoing enterprise and competition but by government clipping of the coinage, political favors and the sheriff's auction. Easan exaggerates the rewards gained by the borrowers and spenders here in the Golden State. Most of the people in California who used their houses as ATMs did so because their after-tax incomes never recovered from the dot.com bust (unless, of course, they worked for the state or the schools.) There were great frauds committed on mortgage applications and by brokers, appraisers and mortgage lenders; but those were minor costs compared to the major fraud of having the GSEs become one-way hedge funds who agreed with the people chasing housing prices that no one ever lost money buying real estate. (The frauds at the retail level would never have been possible but for the demand from Wall Street. Without the credit bubble there would never have been a housing bubble.)
How about we all try a monetary/tax system that favors neither the borrower nor the lender? Prices would still fall; they always do in competitive markets because the buyers keep their eyes out for ways to get a better deal and the sellers work hard to produce things and services better, cheaper and faster. Nick is right; what makes "deflations" ruinous is not the steady decline in nominal prices that results from constant competition but the collapse that comes from a cascade of credit defaults that reduces commerce to a race to the courthouse.
In 1930 "everybody knew" that the solution to the problem was for the government to bring back the WW I boom by spending money. Mellon tried to argue against such stimulus. He did not say that the solution was to "liquidate, liquidate, liquidate"; what he did tell Hoover was that adding government borrowings to an economy already worried about private credit risks would call the soundness of monetary system itself in question. He was right, of course; that is why Hoover never forgave him and Roosevelt literally persecuted him. Once again, Gresham wins the day; sensible advice, like hard money, is never rewarded in a modern political economy.
Jun
25
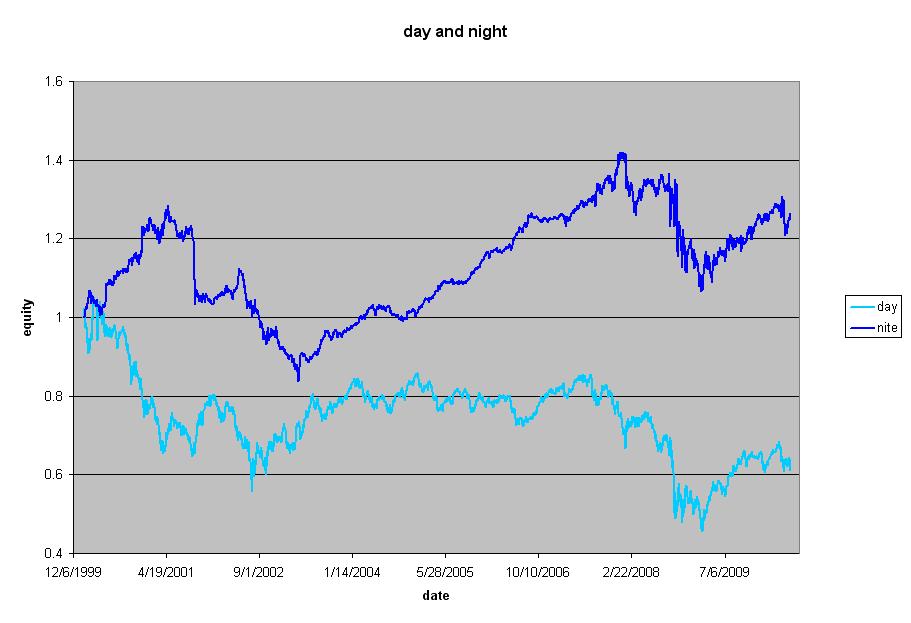
Day Vs. Night Update, by Kim Zussman
June 25, 2010 | Leave a Comment
Attached chart has equity curves for day session (open to close) and overnight (close to next open) for SPY, 2000-present.
The stock market run-up from 3/03-12/07 was primarily an "overnight" phenomenon. The 08-09 decline, as well as the borrowed recovery, accrued both day and night.
Jun
24
[When it comes to the war on terror,] we need to show the world in absolutely clear terms not only what we can do, but that we are willing to do it.
Unfortunately, there are far too many people in this country who are under the mistaken impression that [people everywhere] want the same things we want, and respond to the same set of incentives that we do, or respond to the same set of values that we do.
They don't.
Yet, we naively apply our "higher standard" to them. I almost hate to say it, but this is akin to the animal rights wacko's who actually think that they can give rights to animals. You can't give rights to anything that isn't capable of understanding them, or who is incapable of handling the responsibilities that go along with those rights…..let alone reciprocate and respect your (our) rights.
You have to deal with an animal at the level of that animal.
Laurence Glazier comments:
Is this not false logic? The mentally handicapped have rights which they may not understand. The rights of the human fetus are the subject of fierce debate. One could argue that the propensity of humans to wage war is a form of projective identification to avoid facing the moral question of the abuse of animals. Those that have resolved the latter issue in their own minds are not noted for forming battalions.
Moreover referring thus to the level of animals is unfair to animals which are less violent than humans.
In the UK animals have limited rights and there are frequent cases of conviction for cruelty to animals. Progress is slow in this area as we are still in the secondary cannibalistic era.
Jeff Watson writes:
The 9th district court in California gave Dolphins (Porpoises) the right to sue the Navy. Somehow, the rights of animals were being denied when the navy was training them to place limpet mines on ships and other tasks. Animals have rights, in fact, those rights should be extended to spirochetes, and they should be able to file a class action suit against the makers of penicillin which is the Zyklon-B of their species..Never mind service animals, the labor board ought to look into their working conditions, no pay, and hazardous duty. Equal rights for seeing eye dogs! As for slaughterhouses and eating animals, we need, as humans to go back to foraging for roots, berries, and lichens in order to protect the dignity and rights of our bovine and porcine citizens.
Kim Zussman comments:
Does it make any sense for the species at the top of the food chain to debate hunting (cultivating, slaughtering, farming, taxing, etc) its lessors?
What if we were somewhere in the middle: "Well, they ate our children again. But really, they deserved to die; in order to feed and perpetuate more successful species. And in any case the Good Book says we were put here for that purpose…"
Jeff Watson writes:
One of my favorite places to surf in the world is New Smyrna Beach, Florida. Best wave in the state, funky beach town vibe, very cool, mellow tropical paradise. It also has more shark bites than any place on the planet. It's a rather disconcerting feeling when I'm out on the water and realize that I'm not at the top of the food chain. http://tinyurl.com/49wgkf
Jun
17
Yield Curve and Stocks, from Kim Zussman
June 17, 2010 | Leave a Comment
Attached chart is 10Y-1Y (FRED, "Market yield on U.S. Treasury securities at 10-year, 1-year, constant maturity, quoted on investment basis") vs date, along with log SP500, 1982-present (weekly).
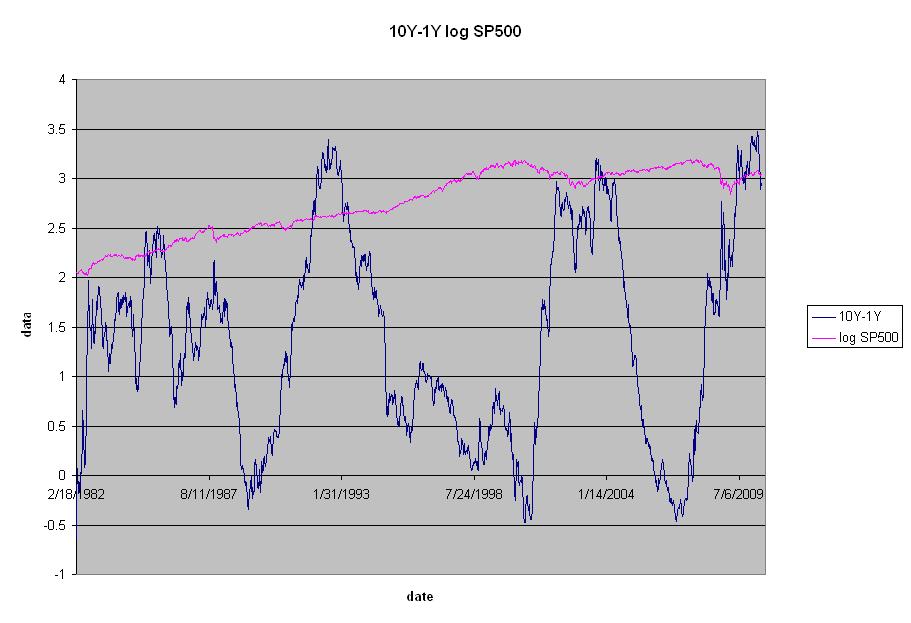
Note 3 major minima: 3/89, 8/00, 11/06
Note 3 major maxima: 7/92, 8/03, 4/10
Jun
4
I periodically take a fresh look at the so-called "equity risk premium" for various global stock markets. There are many academic articles on this subject that are nearly useless for short-term market-timing, but quite helpful for long-term asset allocation. For example, here are two papers from a Google search on "Equity Risk Premium Across Countries":
Ibbotson, Chen: The Supply of Market Returns (2001) [30 page pdf]
or
Dimson, Marsh, Staunton: Global Evidence on the Equity Risk Premium, (2002) [17 page pdf]
What is the current situation? Examining the Bloomberg screenshot below, one notes that Japan has by-far the highest nominal risk premium. It's possible that this is due to their JGB yield at 1.28% — and if JGB yields increase by 100-200 basis points, the risk premium will decline by the same amount — reducing the apparent relative cheapness. Nonetheless, I looked at a handful of mega-cap Japanese stocks. When I plugged in a 1% growth rate and lowered the risk-premium to around 10-12%, the "theoretical" value of these stocks increased massively — in many cases predicting more than a doubling in valuation.I am NOT rushing out to blindly buy Japanese stocks, even though Toyota, Honda, Mitsubishi, UFJ, Canon, Sumitomo, Mitsui, Sony etc. model-up incredibly well on a Dividend Discount Model that assumes any positive GDP growth over the next decade.
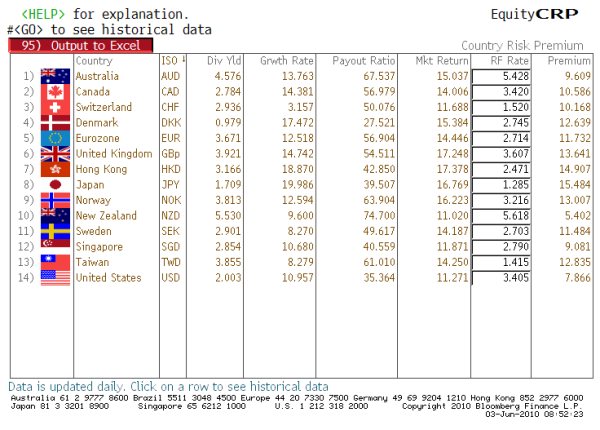
But one wonders whether we are approaching trough valuations after a 20-year bear market? And, other than slow, trend-following technicals, what approaches would one use to make such a call?
Sushil Kedia adds:
If there is a larger risk premium in Yen terms, is it also the same in terms of Dollars?
What if Tokyo pits are pricing a much stronger Yen ahead in the year? Hungry mind is just generating possible explanations and keen to learn. With the JGB Yields being where they are for years, the real variation comes from the change in interest rates in the US treasuries. Is the Risk Premium in Japan a good way to start thinking of a theses that the interest rates in the world will be rising in other important places including the USA, later in the year?
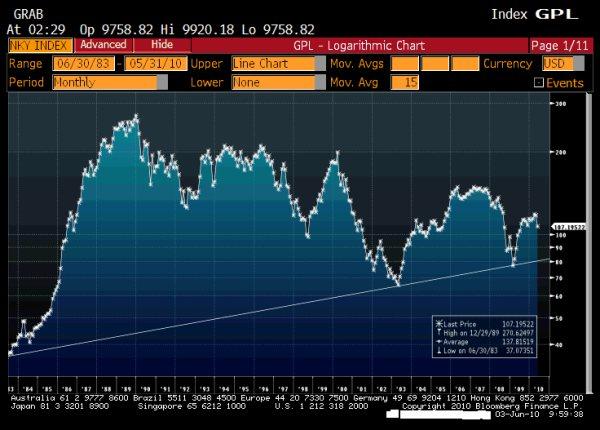
Kim Zussman comments:
Here is log nikkei in USD. It appears US investors were less driftless than the Japanese.
Jun
4
Inspired by the Berkeley astronomers in The Education of A Speculator, below is a chart of log CPI (monthly, 1928-present, FRED) vs contemporaneous log DJIA monthly closes.

Log CPI ranged between 1.1 and 2.3 during this period. Beginning at the lower left, the downward squiggle was the depression - when CPI declined along with stocks. Then both stocks and CPI rose (irregularly) in tandem, from CPI ~1.13 to 1.5, from the 1940's to the mid 60's. CPI increased from 1.5 in 1965 to 2 in 1983 - a period which saw no net change in stocks, with log DOW stuck below 3. The great bull market 1983-2000 occurred while CPI rose from 2 to 2.2.
The last decade is depicted by the squiggles at the upper right, ending with a miniature retracement of the 1930's style cpi/stock decline followed by increase.
Jun
4
Harry Browne’s Take, from Victor Niederhoffer
June 4, 2010 | 1 Comment
 Harry Browne's book about why the best laid investment plans go wrong has a very precise and useful chapter on how to evaluate forecasters starting with keeping records of the actual forecasts, when they were made what the price was, and what transpired. These are usually very different from the humble self evaluations "we erred on calling the high in silver" we said 1080 but it was 1065. A hilarious review of such is contained in edspec.
Jeff Watson comments:
To me, the value of forecasters, pundits, touts, advisors, mavens, etc lies in the opportunity in fading them. When one says that everyone in the world should be short t bonds, I look at the other side. When a guy rides a motorcycle around Europe and says to buy German stocks and forget about them for 5 years, I take a look at the other side. When the newsletters and blogs tell you to do one thing, the move has already happened or else they're talking their book or gambling.
Kim Zussman comments:
Years ago, the late Louis Rukeyser published a newsletter which listed picks of various market experts either interviewed on Wall $treet Week or profiled in the letter. Each issue had a running return for each pick, as well as the average - which was usually very good.
I noticed once in a new issue that a stock had been dropped from the list of recommendations, with a note to the effect "manager no longer covers". Also noticed the bad return for this stock had been removed from the running total average. Had you bought all the recommendations, your results would definitely have been worse than reported!
There is a similar problem with extrapolating stock index data from over 30 years ago, before indexing was widely available / utilized. Think of how difficult it would have been to own 500 stocks of the SP500, in correct proportion, adding and deleting simultaneously with the index. This may be an "indexation premium", which ought to be gone by now.
May
21
Log Nasdaq vs Log SP500, from Kim Zussman
May 21, 2010 | Leave a Comment
The attached chart is plot of weekly closes of the Nasdaq vs corresponding (by date) log SP500; the time period is 1971 to Present.
Mostly a linear relationship (not mathematically one-to-one as there can be various log nas for a given log sp500), but note the upwardly-divergent squiggle at top right. This is the tech bubble; the overall market was doing "well" but Nasdaq was doing "great". Multiple paths in this area are various relationships with log Nasdaq during the frequent sojourns of log SP500 between 2.8-3.2, ca 1996-present.

The current point has approximate coordinates (3.0,3.3), in the upper right quadrant. Imagine an arrow "you are here".
May
19
A Bizarre Business Model, from Rocky Humbert
May 19, 2010 | 2 Comments
 From the Associated Press:
"CLAYTON, Mo. - Panera Bread Co. is asking customers at a new restaurant to pay what they want. The national bakery and restaurant chain launched a new nonprofit store here this week that has the same menu as its other 1,400 locations. But the prices are a little different — there aren't any. Customers are told to donate what they want for a meal, whether it's the full suggested price, a penny or $100. The new store in the upscale St. Louis suburb of Clayton is the first of what will Panera hopes will be many around the country. Ronald Shaich, Panera's CEO until last week, was on hand at the new bakery Monday to explain the system to customers."
PNRA is a public company. If this model actually works, what does that predict for the economy as a whole?
Kim Zussman comments:
Some museums are similar, asking patrons to make a donation at the door if they wish (Last time at NY Metropolitan Museum of Art, and Santa Barbara Museum of Art), at a recommended amount (or less/more). Presumably this is to allow poor people to enjoy the exhibits, without requiring those with means to pay.
I wondered whether they studied this, and found this kind of model to be more profitable, bringing in lower mean price but more customers. There could also be data generated on which items are most in demand, etc, useful for other stores.
Rocky Humbert replies:
Museums may not be the right model as the "recommended" admission price doesn't cover the true cost. According to Museum News, in 2004, the median entrance fee to an art museum was $7, however, the median cost to the museum for each visitor was $35.98 Museums are able to do this because of their endowments and benefactors. While you might someday visit the Rocky Humbert Memorial Wing at the MMoA, I promise that you'll never find the Rocky Humbert Bagel Wing at your local Panera's.
May
14
 I will stand up and predict a retest of the Flash Crash low, making it the Ultimate Milstein.
Kim Zussman adds:
Last week's events remind us that:
1. The probability of zero for a stock is not zero
2. The probability of SP00 zero is not zero but much closer to zero than #1 above
3. The probability of SP500 660 is less when it is 1100 than when it is 670, at least for time periods you care most about
May
10
Tail Drag Race, from Kim Zussman
May 10, 2010 | Leave a Comment
One check on whether declines are faster than advances is to compare the size of extremal moves over equal times. SPY c-c (93-p) daily returns were ranked top to bottom. The largest gain day was paired with the largest loss day, second largest to second largest, etc. Then took the difference between each ranked extremal gain and the absolute value of the correspondingly ranked loss, for the top 200 extremes. The effect is subtracting the decline tail from the gain tail:
G1-L1
G2-L2
G3-L3
…….
G200-L200
The attached chart plots these differences, beginning with the top ranked gain - loss (14.5%-9.9%).
At least for the 24hr time-frame, "which is bigger" is a complicated question. At the tip of the tails, extremal gains are much larger than losses. The difference rapidly declines, and goes in favor of losses at point 3. The advantage switches to gains at point 9, then oscillates above and below zero until point 29 - when gains again outsize losses all the way to point 81. From 81 on, losses are smaller than gains all the way to point 200 (which is 400 pair-differences; about 10% of the total series of 4350 days).
The contest may be different for shorter (and longer) time-frames, as seen in a certain 5 minutes yesterday. Having reformed from intra-day data this study will be left for others.
May
10
This week is a 10-week low in DJIA. Going back to 1929, checked for instances when this week's close was a 10 week low, AND it was the first 10W low in 10 weeks (a dip). Then checked the return going forward, for the next 10W, 20W, 40W, and compared the mean returns for such "dip-buying" with the means of non-overlapping periods of 10W, 20W, 40W.
(This study is not statistically (or politically) correct, as there is overlap with some of the dip-buying and the data is not strictly independent. However assuming an investor bought at all the stated points, comparison of mean return to dip buying vs buying every 10W, 20W, 40W is valid)
Here are the comparisons of mean returns to dip-buying v automatic buying:
Two-sample T for 10W ret vs all 10W
N Mean StDev SE Mean
10W ret 132 0.0108 0.0915 0.0080 T=-0.15
all 10W 425 0.0122 0.0860 0.0042
Two-sample T for 20W ret vs all 20W
N Mean StDev SE Mean
20W ret 132 0.022 0.136 0.012 T=-0.15
all 20W 212 0.024 0.121 0.0083
Two-sample T for 40W ret vs all 40W
N Mean StDev SE Mean
40W ret 132 0.039 0.190 0.017 T=-0.40
all 40W 106 0.048 0.169 0.016
All of the "buy the dips" returns were lower than equivalent auto-buy periods (though not significantly). Note also the stdev of dip buying was higher (though NS, F-tests not shown): the result of buying in declining/more volatile markets.
How could buying after declines give lower returns than buying all the time? By missing periods of high momentum (eg 1990's), when stocks go up for long periods without making many 10W lows. (From a T and A perspective, this is equivalent to missing the returns above long-term moving averages).
If profit were simple we'd all be rich.
Craig Mee comments:
British Politics in hung parliament, US struggling with oil disasters, Aussie politicians trying to bring in a 40% extra mining tax because the miners are making too much dough and should share it, (where was the government, showing gifts when gold and raw materials where going nowhere for 20 years. They want their hand in the cookie jar, after shocking mismanagement) Europe struggling and debt across the board globally, and as Vic said retail accounts coppering a hammering. No doubt anyone close to retirement who rode the last equity wave up will be thinking of any bounce, and I'm going to cash.
I'm all for contrarian trading, but as Larry has outlined once before, wait for the setup, in price, and volality (just as it did on the recent high). Wash outs no doubt provide a key guide.
May
10
Insurance Week, from Kim Zussman
May 10, 2010 | Leave a Comment
VIX closed at 40.9 Friday- doubling in 4 days to a 1-year high - after closing at a 1-year low less than a month ago on Apr 12.
Also interesting that despite relative calm Friday compared to the day before, Friday's VIX close was higher than Thursday's high (Yahoo data):
Date Open High Low Close
5/7/2010 32.8 42.2 31.7 41.0
5/6/2010 25.9 40.7 24.4 32.8
5/5/2010 26.0 27.2 23.8 24.9
5/4/2010 22.5 25.7 22.5 23.8
5/3/2010 22.4 22.4 19.6 20.2
Vince Fulco writes:
I've been thinking for some time, which solidified watching Thursday's action, that there could be parallels to mkt instability and earthquake prediction. Something along the Arias Intensity measure could be created with index members acting as observation stations. I'm doubtful the existing vol indices do the job:
The Arias Intensity (IA) is a measure of the strength of a ground motion.[1] It determines the intensity of shaking by measuring the acceleration of transient seismic waves. It has been found to be a fairly reliable parameter to describe earthquake shaking necessary to trigger landslides.[2] It was proposed by Chilean engineer Arturo Arias in 1970…
Barking up the wrong tree or some theoretical underpinnings?
Thanks…
May
7
Throwing in the Towel, from Alan Millhone
May 7, 2010 | 2 Comments
 Noted in my morning's rag that Celtics GM Danny Ainge was fined $25,000 for tossing a towel to try and distract Cavalier forward J.J. Hickson as he shot a free throw! A really visible example of very poor sportsmanship. Perhaps the NYSE floor traders need to hire him to try and distract the sellers the last couple of days?
Kim Zussman replies:
The 1930s created a generation of retail investors who decided equities were fool's bets (and one could argue that the next unadulterated generation, coupled with a fortuitous lack of major wars, explains much of the bull market 1980-00).
One wonders how many broken hypotheses, market glitches, scams, sovereign/municipal defaults, real-estate which never drops, and government interventions it will take to persuade the 401Kaboomers who are starting to retire (often without choice) that assumptions about investment vehicles makes asses out of…
May
7
Speaking of Fishing, from Kim Zussman
May 7, 2010 | Leave a Comment
The range for May 6, 2010 was 1168.75 to 1056.00 on the S&P futures.
On Tue, Apr 13, 2010 at 9:05 AM, James Lackey wrote:
Would one of you big fish please buy, sell, or short the markets
please? The movement and ranges are too small. The joke around here is
day traders can't even find a way to lose money…much less make.
Dear Lack, this proves that the round trip distance to G-d is 23 light-days ( assuming v(prayer) = c )
May
5
Sell In May, from Kim Zussman
May 5, 2010 | Leave a Comment
Here is a check on the evolution of "Sell in May". SP500 Nov1-Apr30 mean returns were tested against zero, by decade ("00" = 2000's, "90"'s, etc):
Test of mu = 0 vs not = 0
Variable N Mean StDev SE Mean 95% CI T P
N-A 00 10 0.0105 0.0912 0.0288 (-0.0547, 0.0757) 0.36 0.724
N-A 90 10 0.1154 0.0871 0.0275 ( 0.0531, 0.1777) 4.19 0.002
N-A 80 10 0.0830 0.1055 0.0333 ( 0.0075, 0.1585) 2.49 0.034
N-A 70 10 0.0648 0.1233 0.0390 (-0.0234, 0.1531) 1.66 0.131
N-A 60 10 0.0576 0.1246 0.0394 (-0.0314, 0.1468) 1.46 0.177
N-A 50 10 0.0790 0.0841 0.0266 ( 0.0188, 0.1392) 2.97 0.016
All positive, 3/6 decades significantly greater than zero. Here is the same test for May1-Oct31:
Test of mu = 0 vs not = 0
Variable N Mean StDev SE Mean 95% CI T P
M-O 00 10 -0.0152 0.1514 0.0478 (-0.1235, 0.0930) -0.32 0.758
M-O 90 10 0.0442 0.0657 0.0207 (-0.0027, 0.0912) 2.13 0.062
M-O 80 10 0.0429 0.0979 0.0309 (-0.0271, 0.1130) 1.39 0.199
M-O 70 10 -0.0272 0.0683 0.0216 (-0.0761, 0.0216) -1.26 0.240
M-O 60 10 -0.0064 0.0760 0.0240 (-0.0608, 0.0479) -0.27 0.794
M-O 50 10 0.0414 0.0871 0.0275 (-0.0208, 0.1038) 1.51 0.166
3/6 decades were negative (however not significantly different than zero), 3/6 were positive (only the roaring 90's significant).
Russ Sears writes:
Having heard "sell in May" for eleven years, it is time to put paper to pencil. For the S&P index,
First day, whole mnth, month, year
1.30%, ? 5 2,010
0.54%, 5.17% 5 2,009
1.70%, 1.06% 5 2,008
0.26%, 3.20% 5 2,007
-0.41%, -3.14% 5 2,006
0.46%, 2.95% 5 2,005
0.92%, 1.20% 5 2,004
-0.07%, 4.96% 5 2,003
0.88%, -0.91% 5 2,002
1.35%, 0.51% 5 2,001
1.08%, -2.22% 5 2,000
First day 9 positives, average 0.73%, worst -0.41% 2006, best 1.70% 2008, Cumm. Binomial Dist 99.4%
Whole month 7 Positives, average +1.28%, best 5.17% 2009, worst -3.14% 2006, Cumm. Binomial Dist 94.5%
No wonder this dogma seemed annoying.
May
5
The VIC and the Churn, from Kim Zussman
May 5, 2010 | 1 Comment
When ideas that seem to hold promise intuitively don't pass the acid test, you wonder whether you left something out which may have been the key, eg, X-day high, index vs individual stock, different definitions of volatility, various lags, what other markets have been doing, which prior period assumed analagous, yield curve, inflation rate, tax regime change, seasonality, etc. Eventually you are likely to find something, and maybe put on a full-Kelly trade based on it. Then, as it goes against, you wonder whether you have overfit the data, or had so many hypotheses that you fooled yourself. Or, maybe just unlucky or unsuited to gambling?
Dr. Zussman is a trader, astronomer, philosopher and periodontist from Los Angeles.
May
4
How Fares the Sage? from Phil McDonnell
May 4, 2010 | 1 Comment
 He has made his investors' fortunes…
How has Mr. Buffet actually been doing? On July 1, 1998 BRK-A was 78,000. Today it is about 115,000 per share.
That is a gain of 43% over roughly 12 years — about 2.8% per annum compounded.
Dr. McDonnell is the author of Optimal Portfolio Modeling, Wiley, 2008.
Kim Zussman writes:
Regressing the last 10 year's monthly returns for BRK-A vs SPY (with dividends, etc), BRK-A's alpha is positive but not significant:
Coefficients Standard Error t Stat P-value
Intercept 0.008 0.005 1.583 0.116
Slope 0.436 0.106 4.113 0.000
However slope (beta) is 0.44, so you could say BRK-A out-gained SPY with less market exposure.
Rocky Humbert comments:
Math is fun. BRK-A has outperformed AAPL!
Total compounded returns (dividends reinvested) since 12/31/87:
BRK-A 18.2%
GE 10.4%
AAPL 15.5%
MSFT 22.7%
SPX 9.66%
And this is all-the-more-remarkable when one considers that AAPL returned 123% over the past 12 months.
As I said, "math is fun."
Rocky Humbert, quantitative analyst, speculator and master chef, blogs as OneHonestMan.
May
3
DJIA weekly returns (1928-p) were used to look for runs of consecutive up-weeks, such as the recent run of 8 consecutive (ending week before last). As a check on whether longer up-runs end in bigger declines, regressed the run-terminating down week return (the week ending the up-run) against the count of consecutive-ups ended:
Regression Analysis: week ret versus run up wk
The regression equation is week ret = - 0.0155 + 0.000405 run up week
Predictor Coef SE Coef T P
Constant -0.015497 0.001188 -13.04 0.000
run up wk 0.000405 0.000319 1.27 0.204
S = 0.0131489 R-Sq = 0.3% R-Sq(adj) = 0.1%
Conclusion: No significant correlation between run-terminating decline and length of up-run.
The attached chart compares means of run-terminating decline weeks, by length of prior up-run. As with the regression, there are no obvious differences between run-ending decline week returns as a function of run length. (If any of the decline means differed significantly from the global mean, it would be beyond the red confidence interval limit-lines. The lines diverge as run-length increases because there are fewer long runs than short ones).

May
2
For the First Time, from Victor Niederhoffer
May 2, 2010 | Leave a Comment
 For the first time since October 2006 there were no declines of 1% or more in the month of March 2010. One hypothesizes that the number of such declines will increase from the three in April 2010. Indeed, one hypothesizes that a month with zero such declines like March 2010 is inordinately associated with the end of a bull market in Birinyian terms – assuming such exist.
Kim Zussman writes:
To clarify, these dates are for 21D periods which had one or more daily decline <-1% and were following a 21D period which had no declines <-1% (like March and April 2010). The first column after "Date" is count of declines <-1% in that period. Next col is that 21D period return. 3rd column is count of declines <-1% in the next 21D period, and the last column is the return for the next 21D period.
The last 4/5 mean returns for subsequent 21D periods have been negative:
Date count -1% 21d ret nxt 21-1% nxt21 ret
05/31/07 1 0.030 4 -0.018
01/30/07 1 0.001 1 -0.018
11/27/06 1 -0.005 0 0.032
04/28/06 1 0.006 4 -0.039
01/27/06 1 0.022 1 -0.002
10/26/05 3 -0.020 1 0.065
08/26/05 1 -0.031 0 0.009
11/26/04 1 0.051 1 0.026
07/29/04 2 -0.031 3 0.007
03/29/04 5 -0.020 3 0.000
01/28/04 1 0.030 0 0.015
Apr
23
Getting Even, from Kim Zussman
April 23, 2010 | Leave a Comment
Time once again to see what % gain needed to get to even after X% loss:
% gain needed
% loss back to even
-10 11
-15 18
-20 25
-25 33
-30 43
-35 54
-40 67
-45 82
-50 100
-55 122
-60 150
-65 186
-70 233
-75 300
-80 400
-85 567
-90 900
-95 1900
-100 Robert Mugabe
Apr
16
Types of People Who Disseminate Views About The Market, by Victor Niederhoffer
April 16, 2010 | 17 Comments
 What are the many types of people who disseminate their views about the market?
There's the tout, the man who has a position and wants you to get into it so that it will move in his favor. There's the sponsor, the man who advertises or sponsors a program who is always treated well by that program. There's the would be manager, the personage without funds who wishes to impress you with his knowledge and ideas so that you will put money up with him. There's the old lion, the man who no longer is virile and is fighting back any young men who might take his place in the world of power or romance. There's the curmudgeon, the old man who hates everything modern, doesn't own a CD or computer and sees no reason for it, and wants to bring everyone back to the old days without technology. There's the spankist, the woman who's beautiful and always looks like she is so aggrieved with the pubic or her guest that she would have to give him a good spanking unless he puts his things in order. There's the iconoclast, the person who's always contrary and never reads the papers or travels to New York, and always feels the market is wrong.
There's the man with a hole in his shoes who's so down home that he only drinks coke and eats hamburgers and never pays a fee more than 10% of the going rate to the brokers. There's the sanctimonious, the one who pretends to be the most honest person in the world– who won't under any conditions tolerate a blemish in the reputation of his firm even if it costs him a good stake. He's the one who never hears or is briefed about the dishonesty in his troops and finds that any allegations of misdoing in his firm that are brought to his attention never pointed directly in writing to the crime. There's the academic, the man looking for a consultancy who can manipulate numbers especially retrospective files that are very suggestive of alluring profits that a wealthy investor might wish to participate in with him. There's the mystic, the person who looks at the stars and the bent keys. There's the old timer, the person that looks at the iron castings reports and freight car loadings and newsprint figures for guidance as to where the economy is going. There is the fund manager, the man who will always be quoted on a given stock that he owns which he feels is a good buy still but which he sold the bulk of his holdings of in the quarter before the recall.
There's the jack of all trades, the personage who will explain the market going up as due to a good economic report or falling interest rates or who will explain the decline as due to uncertainty about earnings or fears of interest rate rises. There's the chronic bear, the person who never since 1966 has written a column that did not find the weight of evidence highly bearish with signs of excess in many quarters and regrettably some signs of optimism still persisting. There's the humanitarian, the person who believes that the world is very selfish and that the solution is to force everyone into doing good by redistribution or service. This personage also believes that the only good people are the poor and that the purpose of life is to make sure that any pockets of poor are stamped out regardless of how it's taken or from whom. Of course, many of these personages fall into more than one of these categories and they are mobile as their age and wealth changes. What are the major categories that I am missing or what is a better way to classify and make this useful?
John Lamberg comments:
And the mark, who in a hushed tone, glazed eyes, and a glance around the room as if someone was eavesdropping, reveals the privileged information that will make him a rich man. And the friend who, seeing the tells, suggests to deaf ears to exit before his pocket book is emptied…
Ken Drees writes:
Permabull type–always likes the market anywhere, anytime. Wears high fashion suits, well coiffed–male or female. Strong BUY! spouse/lover/significant other–why didn't you buy that, hun? Why won't you get back into this one, dear. I read about that in the paper–are we in that? Foreign fund guy–always likes an exotic market somewhere over there in that far off place. Always a better value there. Always more room for catch-up to other valuations.
Nick White writes:
With precious few exceptions, doubtless one can point to many of the most eminent bank of Sweden prize laureates…they most often get trotted out as permission to allow others to do the thinking.
Kim Zussman adds:
Don't forget the Walter Mittyist.
Market hobbyist with secret hopes to surprise to the upside. Knows a little about a lot, but nothing in depth. He dangerously equipped with the same software and data filtered hourly by everyone in the 100 million Mitty-march.
Known to recognize causal patterns everywhere, convinced they are invisible to others. A market philanderer, he migrates wounded from one instrument to the next, and from one seductive strategy to another. Momentum - reversion - correlation - divergence.
Mitty envies his brother, Admitty, who worked for the city and retired at 50 with 90% pay.
Apr
14
Happiness and Certainty, from Kim Zussman
April 14, 2010 | Leave a Comment
Assuming the majority hold stocks long, happiness is associated with a large rise, and unhappiness with a large decline. Independently of happiness, uncertainty can be thought of as volatility; for example, intra-day range.
SPY 93-present was checked for daily return/happiness as well as range/uncertainty, defined as:
(H-L) / {(H+L)/2}
Uncertain days were defined as those with range >3% (V). Happy days were up >2% (U), and unhappy ones down more than -2% (D).
With these assumptions let's see whether uncertainty presages uncertainty or unhappiness. First, compare returns "r" after high-uncertainty days which were either happy or unhappy:
t-Test: Two-Sample Assuming Unequal Variances
VUr VDr
Mean 0.0007 0.0045
Variance 0.0004 0.0011
Observations 70 99
Hypothesized Mean Difference 0
df 165.0000
t Stat -0.9313
P(T<=t) one-tail 0.1765
Uncertain days which were either happy or unhappy were both followed by up days on average, though the difference was NS (due to higher variance after down days).
Next see what happens to uncertainty after uncertain days which were either happy or unhappy:
t-Test: Two-Sample Assuming Unequal Variances
VUv VDv
Mean 0.0303 0.0421
Variance 0.0003 0.0007
Observations 70.0 99.0
Hypothesized Mean Difference 0.0
df 166.0000
t Stat -3.6144
P(T<=t) one-tail 0.0002
After uncertain days, uncertainty after happy days (up) was significantly lower than after unhappy days (down).
When uncertainty is high, market participants become more uncertain when they are unhappy.
Apr
10
Tiger’s Comeback, from Kim Zussman
April 10, 2010 | Leave a Comment
DJIA daily returns (1929-present) were partitioned into non-overlapping 50 day periods. For each period, counted number of days with return greater than 0 (up days). For the recent 50D period ended Friday, there were 33 up-days (66%), which is in the highest 3.6% count of 50D>0 for the series.
The attached chart shows 50D>0 counts for the entire period, and the stem-leaf below covers the tree aspect:


To clarify the stem-leaf, the rows tally (using the "ones" digits) the number of each 50D up-count. The second column of each row is the "tens", the first column is count for that row and all those larger, and each number to the right of tens row represents an individual count.
eg, for the bottom row: 5 3 44455
3 is the tens, and 4445 are ones. Thus there are five observations in this row: 34, 34, 34, 35, 35 (and they are the top 5 observations in the sample).
The row above the bottom counts: 10 X 32's, and 9 X 33's. "24" before this row says there are 19 in this row + 5 larger (in the next row).
Perhaps the ranking is clearer in the following histogram for the same data, with a marker ("o") above the current "33" count.

But wait…there's more!
The probability chart below incorporates a Kolmogorov-Smirnov test of normality for "count of up days within 50D periods". The P-value is N.S., and as shown in the graph, the [statistically non-significant] deviation from normality is due to "heavy tails" (too many high and low counts).

Apr
8
P&C Insurance Companies, from Bill Rafter
April 8, 2010 | Leave a Comment
Suddenly my "buy" list has a large number of companies which have never graced the list before. They are property and casualty insurers. Although they have sufficient capitalization, their volumes are too small for me to get involved. Does anyone know why they would be in favor?
Dan Grossman writes:
 Volumes too small for you to get involved… You must be quite a heavy hitter, trading millions of shares.
I don't know what you mean by in favor, but because the insurance companies held mostly bonds, including mortgage bonds no one knew the value of, they were beaten down to very low levels, below book value, PE multiples of four or five. Now bond valuations are normalizing, and I guess the insurance stocks are returning to reasonable levels.
Scott Brooks writes:
I deal a bit in the insurance world and I have to say that this baffles me. Insurance brokerage firms that I deal with are hurting big time. Premiums are down as small businesses (which insurance brokerage firms have as clients) continue to layoff, not hire, and generally decrease payroll.
Maybe their revenues are down, but their margins are looking better, but I find that hard to believe since every P&C guy I know is busting his butt to bring on as many new clients as possible and bidding as low as possible to "buy" the business. The problem is that their competitors are doing the same to them.
Vince Fulco comments:
A few I follow remain at a healthy discount to book value (WTM, CNA) and I've been wondering when the rising tide would lift these ships– since other industries are being given the benefit of the doubt that conditions are normalizing — and when would some of them get credit for adequate portfolio management and improving pricing and underwriting activity. Loosely speaking, a properly running P&C company can trade from .9-1.3x book and when the punch bowl really overflows, multiples of 1.5-1.8x are possible. Still plenty of room vs. normalized valuations. Why it has taken the crowd until now to really start bidding them up, I remain puzzled particularly vs. underlying corporate performance. It would seem the investors wanted to wait the half life of the bond portfolios to ensure no more problems as most run short duration portfolios.
Secondarily, there had been concerns within the industry about six months back that the Obama administration would go after the Bermuda-domiciled ones doing biz in the US for a bigger tax bite. That seems to have fallen by the wayside for now. Talking my book as I've owned WTM off and on for the last seven years.
Ken Drees adds:
The big question is since these insurance companies were screwed by their debt holdings, took writeoffs and have muddled through — some with Tarp but most P&C did not get Tarp — where do these companies park their cash now? They used to make money in the derivative leverage through the bond kingdom — outside of normal operational gains through underwriting. What is the risk of their holdings now? I don't see many stock buy backs from these guys and I don't see dividend rates that have gone up — both factors here would show that companies would rather pay out earnings or reinvest in themselves. Will they be able to ring the registers as normal through the bond markets?
Kim Zussman replies:
At a recent lecture by a business law attorney, the take-away message was "everyone needs business practices liability insurance." He went through a litany of litigations; violations of overtime laws, rest-breaks, bonuses not being factored into overtime calculations, performance reviews, extensive paper-trailing, s_xual harassment (including a married doctor who had relations with a woman six times before hiring her, then continuing to pursue her on the job).
In an environment of increasing regulation/litigation, empowerment of little old ladies in lieu of rich guys, and increasing taxes, the deductible expense of increasing insurance coverage could make sense — even though lining pockets of bureaucrats and their legal co-conspirators.
Phil McDonnell asks:
Vince, I have a question. For CNA the ratio of receivables to revenue is about 100%, for wtm it is about 75% (by eye). That would correspond to 12 and 9 months worth of receivables they are owed by their customers. Are their customers really the slowest payers in the world or am I missing something?
Dr. McDonnell is the author of Optimal Portfolio Modeling, Wiley, 2008
Vince Fulco responds:
Not sure where you are looking but the largest receivables on the balance sheet from the last few years relates to business they've reinsured with others. WTM management is generally more risk averse than their peers and is inclined to cede segments of their business to better define their upside/downside. These arrangements have truing up terms, conditions and times which make the receivables ratio more lumpy than an ordinary industrial concern. The mix of biz between them and CNA is probably another factor.
If you are speaking specifically to 'insurance and reinsurance premiums receivable', they've been 21-22ish% of revenues for the last few years. I have no specific answer for that but it doesn't seem out of line if we think of the balance sheet as a point in time.
Apr
6
Briefly Speaking, from Victor Niederhoffer
April 6, 2010 | 7 Comments
 One has always hypothesized that holidays are inordinately associated with major turning points. One hypothesizes that the correlation between the extent of bailout and subsequent economic recovery between countries is not zero. One notes the story from The Book of 5 Rings where a group of wealthy samurai were traveling in Kyoto and were met by a vanguard of vassals telling them that a group of noblemen were behind them and they should bow down on floor in prostration. It turned out the noblemen were robbers and stripped them of their clothes and honor and the samurai had no recourse but to renounce their profession out of shame. What lessons does this have for markets, market people, and others? One believes that the early leads in basketball games and other games tend to be increased in subsequent parts of the game. One hypothesizes that the expected change from the time that the NBER announces that a recession is over or started are opposite in direction from the economy's current announced state — i.e., after they announce a recession the market goes up more than after they announce an expansion.
Rocky Humbert writes:
The continuous surfeit of negativity over the past year (and now hints of protectionism) makes one ponder whether one fell asleep during the housing bubble and awoke in Bizarro World (the mirror-image of Superman's world)… A successful investor doesn't need to either celebrate unemployment (Dr. Rehmke) nor declare millions are out of work forever (Dr. Dreyfus). Both statements are simply provocative– it's much less dramatic to simply observe that employment is a lagging indicator. (Yawn.) Perhaps it would be good medicine for all– if the Chair resumed his slights toward Alan Abelson (last mention July 20, 2007), and prior to that more than once/month. Most importantly, for those who are looking for a "major turning point," I share the words of Bruce Kovner, with whom I had the honor of briefly working: "Listen to the market."
Put simply: for the past year, the optimists saw a monetary/fiscal cyclical recovery with the yield curve predicting growth and inflation. During the same time, the pessimists saw a false stimulus/inventory uptick with the yield curve predicting troubling deficit/supply overhang. (No one expects the job market to recover meaningfully before 2011+.)
By any standard, the pessimists have been horribly wrong. But instead of acknowledging that things are improving, they are being Alan Abelsons, digging in their heels, and predicting that the next huge downturn is just around the corner.
Pitt T. Maner III comments:
Trying to be more in the optimistic camp it looks like the US unemployment fits a hysteresis model. Sort of like TW at Augusta and at home–it could take awhile and that's if there are no more more shocks along the way! :
1. According to Caporale and Alana , two well-known facts about the unemployment rate are
(i) the high persistence of shocks, or hysteresis (see Blanchard and Summers, 1987), which is a feature, among others, of "insider" models (see Lindbeck and Snower, 1988), or of models in which fixed and sunk costs make current unemployment a function of past labour demand (see Cross, 1994, 1995), and
(ii) its asymmetric behaviour, namely the fact that unemployment appears to rise faster in recessions than it falls during recoveries.
2. The next survey of Professional Forecasters will be May 14th, but most see an improving jobs situation. Slow at first but accelerating by end of current POTUS term.
3. Interesting chart of GDP fall vs. unemployment rise (Okun ratio). Less regulations in US (and Canada) would seem to be a long term positive, but the US and Canada sensitivities to GDP fall are higher because workers can be let go faster.
Kim Zussman adds:
Here is an update on P/E type-forecast, with a caveat about markets remaining irrational…if they feel like it.
Pitt T. Maner III comments:
What about the case where you may be moving quickly from high P/Es to lower estimated 12-month forward P/Es? (i.e. S&P 500 going from 31 one year ago to 23 now to possible 15 in 12 months time). So if you have a high rate of change in the P/E downward (if numerators continue to grow) that might make the positive portion of the bars more likely?
It seems with the P/E in the 15-17 range you have more variability in range of returns but the forward dividend yield would still indicate lower returns given yield of 3.4 (one year ago) to about 1.8 today.
Jordan Low replies:
I think that the 10 year data mines the worst case as it includes both the dotcom and subprime busts. The peak of the dotcom was almost exactly 10 years ago, and investors in 2000 weren't looking for E. (They preferred g.)
I understand that the long window is supposed to average the business cycle. Well then, the window should be variable. As of right now, we are getting bad earnings from two crashes and many of those companies don't exist anymore. Perhaps it says something about the unfortunate timing of two bad periods and growth of the Internet being captured by late comers (e.g. Google and Facebook) rather than early adopters (AOL and Yahoo). Being an investor in today's market, not yesterday's, may still be attractive.
Apr
6
Corporate Bond Spread and VIX, from Kim Zussman
April 6, 2010 | Leave a Comment
Using Fed data, I calculated corp bond spreads: BAA yield - 10Y treasuries, weekly from 1990. (Data = "Market yield on U.S. Treasury securities at 10-year constant maturity, quoted on investment basis", "MOODY'S YIELD ON SEASONED CORPORATE BONDS - ALL INDUSTRIES, BAA").
The graph shows fairly close correlation with VIX, with the eyeball suggesting closer correlation since 9/11/01. Verified by correlation post and pre 911:
correlation
pre 9/11: 0.038
post 9/11: 0.218

David Aronson comments:
John Wolberg and I have done some work to derive a normalized version on VIX in order to produce a more accurate timing signal. However we only used various measured derived from price data as normalizing variables (price velocity, acceleration and volatility). We were able to obtain some improvement. However it appears that including the default spread might improve things even more. Anyone interested in a copy of the paper email me, aronson[at]mindspring[dot]com.
Apr
6
Canada’s Grim Future, from Stefan Jovanovich
April 6, 2010 | 1 Comment
 Our daughter Eddy who is in medical school thinks the predictions of ever increasing medical costs — like David Dodge's – fail to take into account two likely changes:
(1) the breaking down of the medical cartel's current structure of required licenses and
(2) further advances in medical micro technology, both in drugs and in physical surgeries.
A nurse-practitioner with access to computer tools can now do as good a job of diagnosing patients as any Internist; and, just as many patients who once would have been candidates for open-heart surgery are now treated by angioplasty, so will other now expensive surgeries give way to cheaper, less invasive procedures. The medical future may not be as expensive as is feared.
If Christie's catalogs are any indicator, the really good stuff among collectibles seems destined to continue its century-long ascent to the financial heavens. Assuming that the non-profitistas and the life insurers keep the envy-the-dead tax in place, that trend seems destined to continue. However, other, less genuinely precious objects may find themselves becoming less pricy even as currencies become rivals to replace the Yugo (fiat joke!).
That seems to be happening now in our the niche of the economic environment with equipment rentals. In this part of the pond even the biggest fish are finding it hard to eat. Volvo Rents, which is at the top of the food chain, is now offering a $15,000 fee to "the referrers of franchise candidates who become Volvo Rents franchisees and open a store". Coke and ore contract prices out of Australia have certainly proven George right about the worth of tangible vs. paper assets, but there are few, if any, new takers for backhoes and the other stuff actually made out of iron and steel.
George Parkanyi writes:
I don't know what the answers are either– it doesn't look very promising given the social, political, and economic status quo– none of which can be easily changed from the inside, if at all. If you want to play the decline both here and elsewhere, I think you have to look at the eventual effect of these unsolvable problems. Governments are not only bankrupt financially, but also for ideas and simply just in the ability to execute. The knee-jerk response to each crisis du-jour is and will be to borrow and spend out of it. When they can no longer borrow, they'll just print. This can only mean continuous and accelerating currency debasement around the world, so I think tangible (vs paper) assets will remain a very persistent investment theme. Governments are going to default, and currencies are going to fail with new ones issued in their place. It's just a question of which ones and when. In that environment tangible assets (the more liquid the better) would have to do well I would think– precious metals, commodities, real estate, perhaps some collectibles, and equities that represent these things. It's not going to happen overnight, and no given trade will be a slam-dunk, but that's where I think the heart of the drift will remain.
Ken Drees comments:
5 years ago the highways were choked with landscaper trucks and their stuffed trailers with ubiquitous mowers, weed whippers and gas cans. Getting gasoline in the morning on the way to work, one would always see a few landscapers fueling up the tanks and the cans for the day.
I am lucky to see one landscaper a day now. There are many pieces of equipment for sale now–if things don't pick up this summer, you should see these items go for 20 cents on the dollar (used of course) in the fall.
Justa Guy respectfully disagrees:
Many of you do not know me, but I am a physician who has practiced in both Canada as well as in the US. In my opinion there are two issues that are a threat to health care in both the US, as well as in Canada, as follows:
(i) Increasing technology. Over the two decades that I have been practicing medicine there have been innumerable new gadgets which have allowed physicians to more precisely define where problems exist ( we used to diagnose stroke with CT scans, then it was MRI, then it was supersensitive 3 Tessla MRI, now there are some unbelievably sensitive 15 Tessla MRI machines being produced). These incremental advances in technology of course come with increasing costs. Unfortunately these advances rarely improve either clinical outcome, or survival. For reasons of medicolegal protectionism, and customer expectation, we are in a culture in which the biggest, best and latest technology is the norm in our healthcare, however the use of these technologies does nothing to affect the outcome of patients.
(ii) Unreasonable expectations. There are two facts in healthcare which are undenyable: Every one of us will die, and we spend >60% of total healthcare expenditure on people within the last month of their lives. In order to curb healthcare expenditure, we must begin to recognise futile situations, and limit the resources spent in these situations. Do not beleive that is the same as Palins "death panels", rather it is a first step in healthcare fiscal responsibility.
(iii) There is a need to transition to more mid level providers as a means of primary health care delivery. Those midlevel providers will be equipped with algorithms for how to treat certain conditions in a medically proven and fiscally responsible manner. Only if those initial steps are unsuccessful will patients be seen by internists and then specialists.
(iv) About 30% of health care spending occurs under catastrophic circumstances. These include bone marrow or solid organ transplants, trauma and accidents. In many of these circumstances, the chances of survival are minimal at best. In the US ( and to a lesser extent) in the Canadian systems, there is no good mechanism by which to limit care in such catastrophic circumstances. A poignant personal example: Several years ago, my aunt (age 70) who lived in the UK was diagnosed with an incurable ultimately fatal lung disease; her physicians told her ( with out presenting options) that her care would be designed to minimize symptoms and discomfort. She died about 2 years later. Around the same time, I was involved in the care of a wealthy businessman age 75 with the same diagnosis in the US. He was offered and ultimately received a lung transplant (even though outcomes are poor for lung transplants in patients with that condition). He died within the year. We need to learn that no matter what insurance company is paying for such cases, it is financially irresponsible to offer such extraordinary care in hopeless situations
(v) The way physicians are compensated needs to change. In most health care settings, Physicians are paid in the same way that lawyers are: the more they do, the more money they make. Example, a cardiac surgeon who does five bypass surgeries in a week makes more that the cardiac surgeon who does three bypasses, and puts two patients on aspirin rather than operating. That system of having a disincentive for choosing cheaper care is dangerous and expensive. Example: many obstetricians believe that the optimum C section rate is between 5-10% of births. In the 60's in the US it approached that number. By 2007 the rate was >30% of live births, although it remains unclear why the rates have grown so remarkably. If physicians were paid by salary, any potential for conflict of interest is removed.
In my humble opinion, without addressing these issues health care costs will continue to rise, and as David Dodge succinctly puts it, heath care will bankrupt which ever countries fail to tackle the issues.
Kim Zussman responds to Dr. Guy:
Dr Guy:
As markets amply demonstrate, there are many discontinuities and irresolvable problems inherent to the human condition. eg, be kind to animals while eating them, love thy neighbor while profiting at other's expense, woman should be faithful but with men its optional, government for the people and for the government, ration health care to others but not your loved ones.
I would likely pay for a lung transplant for one of my daughters, if there was some hope the operation could save her. And if the insurance company making billions will pay some of this, I'll take it.
Outcome, "evidence based treatment", should always be the driver but ultimately humans are driving. Doctors may earn more (earn) by doing more, Kaiser and other HMO's get to keep more by doing less. Both systems have moral hazard problems, as do all the in-between solutions brokered by governments.
Stefan Jovanovich replies:
Eddy has the fortune/misfortune to have Dr. Zussman's head for statistics. It is a blessing to have that knowledge, but it can be a curse once people in research labs discover that they have someone can actually make sense of the data Pearl Diver spits up AND, if she can't do it herself, she knows some really bright people from Cal who work at JPL who can make sense of the outputs. As a result, in her fledgling career, she has already done a full year and more of full-time lab work collating price and outcomes data for both an ophthalmology and an orthopedics lab. From that limited and completely skewed base of knowledge, she has come to these tentative conclusions about medical costs:
(1) price competition works - in those areas of care that are open to active price competition (Lasik, elective plastic surgeries), where the patients pay for at least half the ultimate bill, prices have gone DOWN each year, not UP,
(2) universal insurance is absolutely the worst possible financial model to use for financing general health care- "imagine an energy/transportation system where people were issued monthly, fixed-price gasoline insurance cards; even the most responsible, self-reliant people would find themselves thinking why not take a Sunday drive, it's free and the energy producers do everything they could to abandon market pricing and go to a cost-plus, government contracting model just as the hospitals have",
(3) the Big Lie in medicine is that there is no scarcity of skills, that, if we can only get the costs down, there are enough skilled people like Dr. Guy available to treat all the patients who need care. The rationing that the medical education system imposes does not help; but, even if the libertarian dream of open, unlicensed competition arrived tomorrow, there would still be a shortage of first-rate care. That is a truth that no one can profit from telling. On the issue of lung transplants, Eddy and her Dad are hopelessly biased; her uncle, my brother, had both lungs switched out 6 years ago so our family interest would outweigh our principles even if we believed in rationing by medico-political authority rather than price.
Apr
4
The Bull Move, from Victor Niederhoffer
April 4, 2010 | Leave a Comment
 The bull move by many measures is the greatest in history. Birinyi looks for big 10% turning points in markets and found that by some measures this one is the greatest in history going up 1/5 of a % a day versus 1/6 % a day in the 10 others of comparable rise to this. And we're right in the midst of another such surge with exactly 20 days of consecutive 4% or more moves, an event that's only occured 6 times in last 15 years, with previous dates 5/28/1997, 4/06/1998, 11/24/1998, 4/12/2000, 5/15/2001, and 1/27/2004.
One notes also that we haven't had a a month minimum since Feb 8th, 2010. Since Feb 8, 2010, the median S&P 500 stocks is up 13%, and the top 10 are each up more than 40%. An opposite scenario is working itself out in the world of fixed income. How can we make sense of what is happening?
To what should we turn in conjunction with the bearish feedbak that counting gives. I have been considering the fields of economics, martial arts or romance. What fields would you suggest?
Vince Fulco comments:
The thought of a pendulum with too much transitory force being applied to one side comes to mind.
Russ Sears writes:
In my opinion to understand the crisis and the resulting recovery, you must understand that most of the crash stemmed from "model risks". People had bought these wonderfully complex AAA structured products that suddenly you had to be able to model the expected losses. In the past this was considered only a remote possibility with no need to model. Once it became clear that much of this "structure" was mush, it was equally clear that these things really could not be modeled well. A slight change of the breeze from the butterfly caused wild swings in the heavens.
Models with even a slight downward trend in the housing markets quickly turned into a death spiral in housing. AAA suddenly were worth pennies. And those that bought them were those least able to absorb the losses or downgrades, further cascading the price due to illiquidity.
One must wonder if this recent reversal similarly has the "all clear" signal being given, and people are coming out of their bunkers to see some rays of sun. In other words which came first for the pendulum, the crash or the recovery?
Ken Drees writes:
Some recent puffy white contrary clouds that have passed my eyes:
advertising aimed at gold straddles
advertising oil calls and bull spreads
themes of money market money needing to go to stock market to earn advertising mailers about apple type clone micro caps–a ground floor opportunity advertising for homeowners to lock in natural gas now–don't wait for summer since rates NG rates can't go lower best 12 months in recent stock market history and the recovery isn't even rolling yet at full steam.
Bond bears are simply frothy–they can't wait to feed! The fed is in a box and its locked and its under water.
Lots of interesting hooks in the water in many markets. I am not surprised since trends have been running themselves quite far without pause, and thats the action that creates the hooks–the unarguable facts of self reinforcing trend. Voila!
Kim Zussman suggests we look at the big picture:
The attached plots log [base 10] (SP500 close) every March from 1871-2010, using data from Prof. Shiller's website.

In the context of history, the recent decline and bounce don't really stand out. However stock returns of the recent decade are noticeably different than the prior two, and rather resemble the pre-WWII period.
Next, Kim Zussman looks through a magnifying glass:
Using Shiller's SP500 monthly data, here is comparison of mean monthly returns by decade 1900-2000
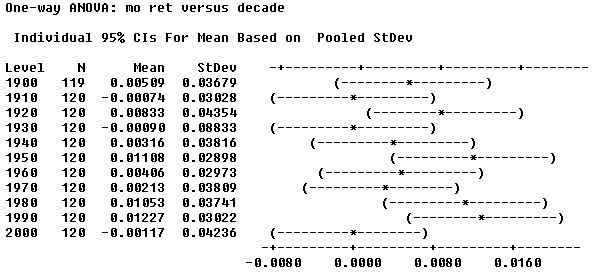
Note that the 2000 decade was one of only 3 (1910, 1930) with negative mean monthly returns. The two prior decades, 1980's and 1990's, both had the largest mean monthly return since the 1950's, and the 50's, 80's, and 90's - the top 3 - all occurred in the last half of the century.
I also plotted log(sp500) within each decade. Drift is noticeable in some of the decades, and noticeably absent in others.
Apr
3
Marionette Cat Bounce, from Kim Zussman
April 3, 2010 | Leave a Comment
The quarter just ended gained 7.4% in the DJIA, after two prior qtr which gained 15% and 11%. Long ago (March 2009) there was a down quarter. Looked for other instances with quarterly return pattern DUUU, also stipulating that the up-qtrs gained more than 5%. Here are the dates, along with the return for the following quarter:
Date DUUUX qtr
06/01/99 -0.058
09/01/95 0.068
03/01/83 0.081
03/01/71 -0.015
06/01/54 0.081
12/01/38 -0.146
12/02/35 0.085
avg 0.014
stdev 0.090
t 0.408
As a wakeful friend pointed out, we are now up 4 consecutive quarters after the down Q1 2009(or DUUUU). Here are the subsequent qtr assuming all 4 were up >4%:
Date DUUUUX
09/01/87 -0.253
03/02/36 0.009
06/01/83 0.009
12/01/95 0.092
09/01/54 0.122
avg -0.004
Mar
31
A Poem, from Russ Sears
March 31, 2010 | Leave a Comment
Schlock
The help laughs behind their backs,
As the Mercedes, Lincoln and Catties.
First fill the handicap spots..
Until the whole lot is full
Of Gray and Bald headed Early-Birds.
They stroll, walk and hobble,
To the supper special for the day:
Desserts puffed with air
And weak artificial flavor
Vegetables steamed to oblivion;
With variety of syrupy fruits;
All with slabs of meat
Served with pomp and detached jazz
The waiters know them by name
And the story behind each one
A doctor, a lawyer, a professor or two
Little did they know,
The devil's trade they daily made
Those toiling years ago.
To miss the daily diligence of running, hiking or seeking:
The wild beauty of the bobcat,
Attacking the spotted doe.
They would be left with black velvet deer
And serene glowing trails on canvas.
As their arteries clogged
As their blood turned to medicated sludge.
But then the conversation turns sadder
As they talk of greater minds, lovers or brothers;
Gone or in the home,
From dementia, strokes or fatty cancers.
The devil smiles as they say grace,
And thankfully say they are the lucky ones.
Rocky Humbert comments:
The studies which I've seen suggest that running 30 minutes a day will add 3.5 to 3.7 years to one's life. However, if one is awake only 16 hours/day, then that 30 minutes of running consumes 3% of one's life for an increase of life expectancy of approximately 4.7%. While this gives no value to the increase in general well-being from regular exercise, it's hardly grounds for the help to be laughing.
In contrast, a talented attorney can spend those 30 minutes billing at $1,200 per hour, and use the income to ensure access to a private room at the Cleveland Clinic for a quadruple bypass, valve replacement and experimental treatment for Type II Diabetes.
One wonders whether Jim Fixx has any regrets?
Kim Zussman adds:
 Which begs for a present-value calculation for doctors who run 30 minutes a day from $1200/hr lawyers.
Nigel Davies writes:
The time could be used to listen to talking books and the like. Plus it would be interesting to see if cycling on an exercise bike would produce similar results in which case one's options are much more varied (eg trading and cycling).
Of course the other thing they didn't measure is quality of life. Not much fun having a blonde on one's knee whilst struggling for breath and wondering if one will survive the experience.
Mar
30
Review of Greenberg, from Kim Zussman
March 30, 2010 | Leave a Comment
 The underwhelming "Greenberg", played by Ben Stiller, is Hollywood's latest glamorization of neurosis. Woody Allen, the pioneer in this genre, charmed up his leading men (himself) by laundering neurotic obsession through talent. "Shine" put light on a Jewish Australian music prodigy who is rescued from his illness by a high chinned maternalistic matron. Nerds who are crazy but smart, inexplicably winning the girl.Hollywood women veered from the winning Jewish neurotic toward the gentile variant. Jack Nickolson capitalized on his money as a talented writer with OCD in "As Good as it Gets". And the tolerant wife of the Beautiful Mind of John Nash (who in real life got busted for perversion in a Santa Monica beach public toilet).
Greenberg brings us to the untalented Jewish neurotic, who is pursued and conquered by a much younger, convincingly dumb and slightly bovine blonde, because she is lost, lonely, and in need of a pursuit. While driving in LA traffic, she mutters "Are you going to let me in?". Parallels between Israel and Hillary aside, perhaps we are witnessing the curtain on forgiveness of the American shtetl.
The viewing angles of Hollywood neurotics was done the same way Playboy analyzes things. A more honest treatment of women as objects is the new book, "T, T and A" by Tony Stamolis. One of the few tomes I could read in two hours (the only words were inked on the bare skin of gang bangees), Tony interposes nice images of California girls with those of "gut wrenching" Mexican fast food. I asked the author whether he sampled all the dishes, and for a family website the answer is omitted. (however one did suggest a new book for him).
Finally, a new genre is the Jewish* neurotic genius who lives with mom, refuses money all while solving the remaining math puzzles.
*To Russians he is Russian, though Jews in that country are not considered Russian
Mar
28
Males More Likely To Take Risky Detrimental Moves in Chess, from Kim Zussman
March 28, 2010 | Leave a Comment
 Here is an interesting paper by Swedish researchers Christer Gerdes and Patrik Gransmark on how male chess players are more likely to take risky moves, to their detriment.
Nigel Davies comments:
Long ago I realized that the best procedure against most risk averse females was to riskily snatch a hot pawn or damage their structure in a way that would force them to attack.
But the researchers do not appear to have a category for my behavior…
Needless to say I wouldn't do it against Judit.
Mar
26
The Market as a Mirror, from Kim Zussman
March 26, 2010 | 4 Comments

The yogis say our true nature is joy. When we're laughing and truly having fun, perhaps that's when we're most being ourselves - and not the product of something else. G.P.
It is easy to be jocular and personable when things are going well, but you get to see who you really are when things are going badly. The energy required to maintain interpersonal facade is redirected toward survival. The market is a very good mirror. And a very bad one.
Bill Rafter adds:
Who you really are is very much like a stock in Portfolio Theory. The good side is the rate of return, but most compare that with the additional information of the standard deviation of the returns.
Similarly a person should be measured along the same lines. The person who is happy go lucky most of the time but occasionally has bouts of violent anger is not as desirable a friend as one who is relatively constant but with lesser high points.
Each person responds differently to stimulus. And as with stocks it is the bad side that is most important. Someone who is in a funk for a long time has the risk of getting clinically depressed, with physiological damage to the synapses.
Ken Drees comments:
I always liked the saying that "not all great companies are great stocks". Forgot who coined that one–maybe from the Livermore books that I have read. Meaning that the stock of the good company may not act or behave well for speculation. In general, it is interesting how stocks are given human qualities by specs.
Alex Castaldo replies:
Forget about Livermore. The first to warn about confusing good companies and good stocks was the late Peter Bernstein in the Harvard Business Review in 1956. The idea was followed up by many people, including Solt and Statman (1989) and most recently Richard Bernstein .
Kim Zussman generalizes and extends:
Galton weighed in on this, with five big personality traits: Openness, Conscientiousness, Extroversion, Agreeableness, and Neuroticism (OCEAN) In modern times, add Yeswecannyness, Islamocapitalist, and Amelanotaxophile.
Mar
19
Tail Weigh-In Update, from Kim Zussman
March 19, 2010 | 1 Comment
 The 4314 SPY daily returns 93-present were checked for mean and stdev:
mean 0.0003742
stdev 0.0124951
4314 random daily returns were generated with normal distribution having the same mean and stdev as the actual series. Both series were
ranked, then compared means of the top 5% of the real and simulated
returns (N=215):
Two-sample T for day ret vs SIM
N Mean StDev SE Mean
day ret 215 0.0290 0.0146 0.00099 T=2.49
SIM 215 0.0263 0.0050 0.00034
>> the real top 5% ("day ret") was indeed heavier than the
simulated top-tail. Here is the comparison on the bottom 5% tail:
Two-sample T for day ret- vs SIM-
N Mean StDev SE Mean
day ret- 215 -0.0293 0.0125 0.00086 T=-4.4
SIM- 215 -0.0252 0.0044 0.00030
The real bottom tail was even heavier than the top tail, compared to its normal counterpart.
And here are the entire two series compared, showing that global means
and stdevs were the same:
Two-sample T for real day vs sim day
N Mean StDev SE Mean
real day 4316 0.0004 0.0125 0.00019 T=0.2
sim day 4314 0.0003 0.0125 0.00019
////////////
Vixenophiles note that the volatility of the real tails was higher than the simulated/normal tails:
Test for Equal Variances: day ret, SIM
95% Bonferroni confidence intervals for standard deviations
N Lower StDev Upper
day ret 215 0.0131569 0.0145864 0.0163495
SIM 215 0.0045136 0.0050040 0.0056089
F-Test (normal distribution)
Test statistic = 8.50, p-value = 0.000
Levene's Test (any continuous distribution)
Test statistic = 24.26, p-value = 0.000
Begging the question whether tail obesity is related in some way to higher tail volatility.
Mar
18
Michael Lewis’s Book, from Dan Grossman
March 18, 2010 | 3 Comments
 I haven't read The Big Short, but after seeing the Lewis interview on 60 Minutes it's clear to me the book is quite illogical and contradictory. Somehow that makes it like Gladwell's, the book that the media loves, and will doubtless be the most popular. See the good paragraph posted below from an amateur Amazon reviewer.
As the Chair will testify about the nature and culture of AIG, the most ludicrous claim of all is that innocent, naive AIG was forced or tricked into writing $20 billion of credit default swaps by Goldman Sachs.
What are these points Lewis wanted to make? I suppose the major tension of the book is the teeter-tottering between the greed/evil genius of the major Wall Street firms (on one hand), and then the utter stupidity and incompetence of Wall Street (on the other). It is a difficult balance to strike, and one reason it is difficult is because, well, one can not have it both ways. Lewis can not claim, as he astonishingly and explicitly does, that Goldman Sachs made AIG write credit default swaps on the subprime mortgage industry, guaranteeing AIG's demise and Goldman Sachs flourishing, but then on the other hand claim that the firms had no idea what they were doing, and were completely shell-shocked by what happened to their CDO's (the collateralized debt obligation instruments which served as the toxic assets you hear so much about). This inconsistency permeates the book, and tonight on 60 Minutes I heard Lewis repeat what his major thesis is: Wall Street did not know what they were doing. This is the correct thesis. But it is wholly imcompatible with the obscene Goldman Sachs conspiracy movement that has taken over the Oliver Stone mainframe of our society. Even a Michael Lewis fan like myself was taken aback by the audacity of this oft-repeated contradiction.
Kim Zussman comments:
The better story is not the book but the author. Lewis, a Princeton/LSE grad, had a first career as a successful bond salesman at Solomon. He left finance to become a more successful author, colorizing Wall St villains and others.
"Be the house"
Nick White comments:
I know Mr. Lewis isn't terribly popular 'round here (though I enjoy his writing a great deal - pinch of salt or otherwise)…but I think Kim nailed it when he observed, "be the house". Full marks to Lewis for parlaying his edge. What's more, he's hardly ever been bashful about his motivations or disposition in the industry.
By his own admission, (see excerpt from business week interview below) he seeks to illustrate the issues through characters he (and us) can grab hold of. Sure, it sensationalises the story a bit - but it makes the complexity of all this a bit easier for those who aren't familiar with all the personalities, actors, products and institutions. The only way vast swathes of the non-professional population will understand this mess is through exaggeration, analogy and over-simplification. Hell, even most of those within the industry will probably only understand it this way.
He's also been great in giving credit to people who did the real homework and who have the nitty gritty facts and figures on this crisis– girls like Anna Katherine Barnett from Harvard (see this article and link to her paper there). Maybe it's just me defending the old school tie, but I've been long Mike Lewis for many years and will continue to be. Of course, I've never met him, so I simply take him at face value as an author. Others here may know him from a different angle. To me, he's an interesting and engaging social commentator and, like the rest of us here, can only put his pants on one leg at a time– none of us are perfect.
I, for one, am really looking forward to reading his book. Will surely be better than Paulson's and a nice perspective change from Andrew Ross Sorkin's.
Interview Excerpt:
SCHATZKER: You note early on in the book that John Paulson made more money than anyone had ever made so quickly on Wall Street. So why not make him more a part of this story?
LEWIS: I spent time with him. And he was very friendly. I could have made him part of the story very easily. But I had a purpose for this story. And the purpose was I wanted to explain to the reader what on earth had happened. And to do that, it helped that the characters themselves had to learn about these markets, that they didn't understand these markets to begin with.
So the reader could learn with them.
John Paulson happened to be oddly positioned inside the financial markets in that he was one of the few people who made his living shorting bonds and looking for bonds to short. His motives were, to me, less interesting. He's much more a purely economic animal. And so he didn't have a great distance to travel to get to the trade. And in addition I'm writing a story. And the story is driven by these characters. And it's got to be true. I can't make it up. I don't want to exaggerate what this thing means to a character.
The people who I was interested in were the people who had laid it all on the line, where they started out thinking, "A nice little trade," and they'd end up, essentially, that if this didn't work out, their careers were over. And Paulson had very cleverly but, from the character, the logical point of view, less interestingly structured his financial life so that he was going to win either way.
When he went to investors and said, "Give me your money so I can short the subprime mortgage bond market," he didn't say this is a bet we want to make because we're all going to get rich. He said your whole portfolio is premised on this not happening, this catastrophe not happening. Give me a tiny bit of your money and put it in this as an insurance policy. And if it works out, it will be a hedge. And if it doesn't work out, the rest of your portfolio is fine.
So there wasn't a lot at stake there. He made a lot of money when it worked out. But he wasn't set up to be in a lot of trouble if it failed. And I was particularly interested in the people who were set up to be in a lot of trouble if it failed.
Mar
17
VIX Doesn’t Work as Signal for U.S., from Alex Castaldo
March 17, 2010 | 1 Comment
VIX Doesn’t Work as Signal for U.S. Stock Returns, Birinyi Says
March 17 (Bloomberg) — Investors looking for clues about the U.S. stock market should probably ignore the Chicago Board Options Exchange Volatility Index, according to a study of the VIX by Birinyi Associates Inc.
Speculation that equity returns will be positive after the volatility gauge decreases and negative when it climbs has little basis in fact, Birinyi said. "The VIX is alleged to be an indicative indicator and has become a staple of analysts and journalists alike," Laszlo Birinyi and analyst Kevin Pleines wrote in a report to clients.
The following is a table of the S&P 500's average gain or loss during periods after implied volatility climbed above or fell below the 50-day average: (since September 2003)
1 Month 2 Months 3 Months 6 Months
VIX 20% Below 0.09% -0.49% 3.33% 5.84%
VIX 20% Above 1.25% 0.50% 0.95% -4.51%
Source: Birinyi Associates
Larry Williams writes:
As I have always postulated, the VIX is just the Dow/S&P upside down. It's hard to predict A with A.
Jason Goepfert comments:
I'm not a VIX fanboy by any means, but that article was ridiculous. It only looked at returns since September 2003. And it only tested a strategy of crossing 20% above or below the 50-day average. Why 20%? Why the 50-day average? Why just since September 2003? Did they test anything else? Or is that the one they found that supports their (so far very correct) bullish view?
The ridiculous part is taking such a weak study and then proclaiming "the VIX doesn't work."
Allen Gillespie adds:
He doesn't have enough bins — bins of 5 show something different.
Kim Zussman writes:
- Volatility was extinguished by fiat liquidity
- The only double-dippers left are Jibao, Roubini, and Michael Moore
- Nothing to fear above moving averages
These two articles might shed more light on the above points #3 and #2.
Marlowe Cassetti responds:
I have always doubted the assertion that VIX is a measure of market fear and greed. Years ago I read Whaley's academic paper and I was not satisfied with the author's fear/greed connection. To me VIX is simply the volatility number you plug in to make the Black-Scholes option equation work.
Bud Conrad answers:
My detailed review of VIX concluded that the VIX followed stocks (inversely) a day later. It was not predictive. Longer term charts seemed to indicate opposite movements, but the data could not be used as expected.
Mar
17
The Merit of Meritocracy, from Kim Zussman
March 17, 2010 | 1 Comment
 On the merit of meritocracy from Leonard Mlodinow:
Gary Wendt, for example, was once thought of as one of the smartest businessmen in the country. Wendt parlayed his job at GE Capital under Jack Welch into a $45 million bonus when he was hired away to run the troubled finance company Conseco (nyse: CNOPRB - news - people ). Exuberant investors, betting on his past record, tripled the company's stock. But two years later Wendt abruptly resigned, Conseco went bankrupt and the stock was trading for pennies.
Sherry Lansing, who ran Paramount with great success for many years had a similar story. Under Lansing, Paramount won best picture awards and posted its two highest-grossing years ever. Then Lansing's reputation suddenly plunged–and she was dumped–after Paramount experienced, as Variety put it, "a long stretch of underperformance at the box office."
But Paramount's films for the following year were already in the pipeline when Lansing left the company, and based on her choices Paramount had its best summer in a decade. A Variety headline on the subject read, "Parting Gifts: Old Regime's Pics Fuel Paramount Rebound," but one can't help but think that, had Viacom (nyse: VIA - news - people ) had more patience, the headline might have read, "Banner year puts Paramount and Lansing's career back on track."
A more recent and equally famous example came last year: In Spring 2007, the stock of Merrill Lynch (nyse: MER - news - people ) was trading around $95 a share, its CEO E. Stanley O'Neal was celebrated as the risk-taking genius responsible, but in the fall of 2007 after the credit market collapsed Merrill Lynch stock fell to $59 a share, O'Neal was branded the risk-taking cowboy responsible–and was promptly fired. Were these highly able executives whose ability suddenly evaporated? Or did both their coronations and subsequent disgrace rest on the questionable assumption that past success is a reliable indicator of future performance?
Mar
15
East of Eden, from Victor Niederhoffer
March 15, 2010 | 2 Comments
 John Steinbeck's East of Eden, which he considered his best novel and is autobiographical at age 43, has much wisdom about the market and life in it. I like the passages where he talks about fattening up the cow before the slaughter the way the father fattened him before having him inducted into the army after a beating by the Cain brother, and the part about his father missing Cain with a shot gun to get revenge thereby changing his life, which Steinbeck extends to say that every little thing you do like stepping on a twig affects everything else in your life, and also the part about 10 year cycles of rain in Salinas County which everyone forgets about selling out at the bottom or living high on the hog during the rain. Totally brilliant and O' Brian-esque albeit a little forced relative to O' Brian.
Kim Zussman adds:
Or when the father came up with the idea of packing lettuce in ice for shipment, only to receive news that the ice melted in the train and the lettuce spoiled anyway. Though he was financially ruined, he optimistically said
"One day someone will develop a way to ship refrigerated produce. It just won't be me."
Later the black sheep son made a fortune speculating on futures as war broke out in Europe. Thinking that repaying his father's debt would redeem him, he was disappointed when father regarded this as blood money which must be returned.
Stefan Jovanovich comments:
East of Eden is that rarest of all things– a great, great novel and movie both. As Kim knows, the father's own fortune came from his selective accountings for the monies collected by his Grand Army of the Republic veterans group (the American Legion, VFW and SEIU of its day which expanded the pension program for Union veterans–no Rebels– from the combat veterans to the children of the clerks who never left their desks). Steinbeck also adds the irony of the father, whose veteran constituents had all been volunteers, serving on the draft board and then finding his son's profits from selling to the British purchasing agent somehow tainted.
Gregory van Kipnis adds:
But the greatest insight to me came from the discourse over the biblical debate about Cain and Abel. Was Cain fated to kill his brother "Thou shalt" or did he have choice: "Thou mayest." The search for a correct translation of the key Aramaic word 'timshel' led to the Chinese immigrant scholars. After much study they ultimately declared that 'timshel' meant that Cain had choice.
Nigel Davies comments:
This is quite a widespread idea, but an alternative way of looking at this may be that the 'stepping on twigs' is relevant only in that it can reflect attitudes (personality traits) that affect broader and more vital issues. On its own it is irrelevant.
Mar
14
Exponential Volatility Decay, from Kim Zussman
March 14, 2010 | Leave a Comment

Since we're back to school lately, went back and brushed up to check whether stock market volatility spike-decay follows an exponential-decay law, of the general form:
dV/dt = -L*V(t), where
V=volatility
dV/dt is change in volatility with change in time
-L is the "decay constant" for V
This can be rearranged as dV/V(t) = -L*dt
And integrated:
ln(V) = -L + C (c= integration constant)
Which is a linear equation that can be used to evaluate the decay constant (slope). Using DJIA daily closes 1929-2009, every (non-overlapping) 10-day period I calculated stdev for the prior 10D. Then I identified volatility peaks >=3%, finding these:
date max D10
10/20/08 0.059
09/25/01 0.030
10/29/97 0.030
10/28/87 0.089
09/11/39 0.031
10/30/29 0.074
For each spike, checked 10D stdev for 36 subsequent periods, and plotted ln(10D stdev) for each date. For the log-transformed six historical volatility spikes, used linear regressions to fit lines to the data: Independent variable = date. Dependent = ln(10D stdev). The first regression is for the recent spike ca 2008:
Regression Analysis: ln2008 versus date2008
The regression equation is ln2008 = 143 - 0.00369 date2008
Predictor Coef SE Coef T P
Constant 143.29 16.35 8.77 0.000
date2008 -0.0036902 0.0004087 -9.03 0.000
S = 0.369075 R-Sq = 70.6% R-Sq(adj) = 69.7%
Note the slope (-0.0037) is highly significant, and negative; following
exponential decay (see plot above). Here are the results for the other
years:
Regression Analysis: ln2001 versus date2001
The regression equation is
ln2001 = - 30.0 + 0.000685 date2001
Predictor Coef SE Coef T P
Constant -29.95 16.16 -1.85 0.072
date2001 0.0006853 0.0004319 1.59 0.122
S = 0.390306 R-Sq = 6.9% R-Sq(adj) = 4.2%
///////////
Regression Analysis: ln1997 versus date1997
The regression equation is
ln1997 = - 14.6 + 0.000282 date1997
Predictor Coef SE Coef T P
Constant -14.65 15.38 -0.95 0.348
date1997 0.0002819 0.0004274 0.66 0.514
S = 0.387066 R-Sq = 1.3% R-Sq(adj) = 0.0%
/////////////
Regression Analysis: ln1987 versus date1987
The regression equation is
ln1987 = 80.1 - 0.00262 date1987
Predictor Coef SE Coef T P
Constant 80.11 14.09 5.69 0.000
date1987 -0.0026168 0.0004357 -6.01 0.000
S = 0.392181 R-Sq = 51.5% R-Sq(adj) = 50.1%
//////
Regression Analysis: ln1939 versus date1939
The regression equation is
ln1939 = - 2.10 - 0.000184 date1939
Predictor Coef SE Coef T P
Constant -2.101 9.765 -0.22 0.831
date1939 -0.0001840 0.0006618 -0.28 0.783
S = 0.602352 R-Sq = 0.2% R-Sq(adj) = 0.0%
//////////
Regression Analysis: ln1929 versus date1929
The regression equation is
ln1929 = - 3.24 - 0.000074 date1929
Predictor Coef SE Coef T P
Constant -3.237 6.889 -0.47 0.641
date1929 -0.0000739 0.0006175 -0.12 0.905
S = 0.562338 R-Sq = 0.0% R-Sq(adj) = 0.0%
Of the six historically large volatility spikes, only 2008 and 1987 followed exponential decay. This doesn't seem to be a result of the size of the spike, as 1929 was bigger than 2008 and smaller than 1987. To the extent that volatility proxies fear, Is the current volatility decay in some way similar to 1987, and different from the others? Unlike 1987, 1929 spike was the beginning of a long period of economic turbulence. In 1997 the market was already volatile, and went on to become more so. 2001 featured 911, followed by further stock declines through early 2003. In 2008, the banking system teetered on the edge of what now looks to be a fake precipice - with the only real consequences being higher debt/gdp, less home ownership, and higher taxes.
Alex Forshaw comments:
I am clueless on the science of volatility (ie approaching it with any quantitative proficiency). as a market participant though, i have found that there are three kinds of volatility.
one is VIX volatility. this seems to be negatively correlated to liquidity of risk assets, which sounds obvious to the point of tautology as i'm typing it out, but ive been surprised how insensitive it is to other metrics i've though should matter, e.g., estimate revision momentum (for example: once a sector's estimate revisions are X standard deviations above the historical average, particularly as correlations have risen to recent highs in an upward trending market, shouldn't this matter? apparently animal spirits among option market makers is a lot more important.) and so on.
two is pnl volatility, which for me is very positively correlated to volatility of volatility (in either direction, but especially volatility that trends down for surprising lengths of time), much more so than volatility alone. as a firm we very carefully watch the PnL volatility of the 30 separate books of pairs, particularly during a rising market, as a sort of jerry rigged predictor of market volatility. when it gets to intolerable levels during a rising market that sometimes signals that a trend is about to reverse, although it's not consistent enough to be reliable as a frequent go-to indicator, I believe it did work well for the firm in several very critical situations (in 2007, 2008 and 2009) when other indicators were not working.
another is "long term volatility" which i think is best captured by the seasonally adjusted price of gold. e.g., "how big will the nuclear explosion be when the world's imbalances eventually, inevitably?! readjust". the VIX seems to totally ignore that.
Mar
10
Professor Longterm vs Dr. Bubbles, from Kim Zussman
March 10, 2010 | Leave a Comment
 There was an article in yesterday's WSJ updating the bear v. bull debate between grad-school buddies Jeremy Siegel and Robert Shiller .
Shiller, who correctly called the 2000 stock and 2006 home price bubbles, contends the current rally has taken (his version of) stock market P/E above its long-term average, and the on-life-support real estate market will continue to drag on corporate earnings. The concern is that for some time FED/government intervention has artificially buoyed stocks above their "natural P/E"; beginning with the 1998 Russian debt default (thank you Mr. Meriwether), Y2K, 911, tech bubble bursting, and the recent credit crisis. In spite of all this help, we just ended the worst decade for stocks since 1930.
Professor Siegel counters that Shiller's P/E method is flawed, and that a version of analyst earnings estimate suggests that earnings will increase now that the credit-crisis write-downs have been taken.
Another possible explanation for a new, higher P/E regime is the transformation of investor thinking: Stocks changed from the "sucker bets" of our parents and grand-parents to the main-stream, primary investment for retirement. This is a self-fulfilling prophesy: since people associate economic well-being with the market, governments now borrow heavily to buy puts (of course someone has to pay for these, hopefully only those making more than $250,000/yr).
There is no reason embedded in nature that stocks must center about a certain P/E. They could stay higher or lower for decades without reason. One of the weakest arguments in Siegel's "Stocks for the Long Run" relates to the question of who will buy stocks as baby-boomers retire. His answer was foreign investors in developing countries -who currently look to be pretty well stocked up on American securities.
Currently the heroes of liquidity-provision are the mavens of Wall Street, who now hold the P/E levers and remain beholden to a market too big to fail.
Stefan Jovanovich comments:
I share Kim's skepticism about Professor Siegel's end-game for American securities. There is no historical evidence for the proposition that wealthy people in developing countries want to put their savings into the common stocks of the already developed/relatively declining countries. The periphery does not send capital to the center. Europeans bought American securities in the 19th century and again after WW II, when the U.S. offered superior growth prospects; those were precisely the times when Americans kept their capital at home, except, of course, for buying trips for foreign baubles. (Every time I visit the Huntington Library I find myself wondering how much the sale of Gainsboroughs for the pound; perhaps the rich in Singapore will develop a taste for the Hudson River school). The only event that could drag capital from Asia to North America would be the political collapse of China; if that were to occur, the money would be flight capital, and that would hardly be enough to cash out 50 million IRAs and 401(k)s. If the United States is going to return to the path of financial progress, like Sebastian the crab we will have to do it ourselves. It is going to take a while.
On another note, I finally understand Keynesians. You guys literally don't think balance sheets matter; it's all about the flow. But what do you do when the pipes have sprung a permanent leak? Opening the sluice gates won't help because the little water left behind the dam has to be kept so no one will worry about a drought and the Valley farmers have already used up their allotments.I have no understanding of the world of 3rd party incomes and investments - the one where the students don't pay the teachers and the money to invest is always OPM. I have not lived there in 35 years; my last brief visit was 1 year as a salaried tax lawyer before the combination of the 1976 tax reform act and my unfortunate manner got me fired. Since then, all I have known is the world of incorporated wallets. Right now in Munchkin Land investment bargains exist; but they are there precisely because the income flows are diminished. The prices have come down because the people who own the businesses do not themselves have the cash to reinvest. They simply want out. And, many of the bargains are anything but because the businesses are simply failing.
That, combined with the likely further extension of confiscatory regulation, makes any current investment here in California very much of a dodgy proposition. The risk of loss seems much, much greater than the reward. If there is to be new investment, it will have to come because we greedheads think we can make money, not because we have a positive cash flow. Until we can see a prospect for profit at the prices for capital assets, the flows will go into the bank to wait. Those businesses that have access to bank and government credit may, indeed, be recovering; but few, if any, small businesses and non-government employee customers are. Their own income prospects are lousy, and their balance sheets are under water. Hayek would blame all this on the past nationalization of credit and money. (Cf. Good Money, Vol. I and II). That, and the prospect of having the government tax more of the flow is only encouraging people to look for ways to camouflage their wealth. Someone - it may have been Jim Farley but I can't find the precise source - said about Joseph Kennedy, Sr. that "he was the only guy I knew in 1932 who could buy something without having to sell something else." The Kennedy political tradition may be dead, but the bootlegger legacy is alive and growing.
Kim thought Siegel was being naïve in expecting that new capital to be invested in America from abroad to buy out the retiring geezers like me. I agree, but God only knows; perhaps Brazilians will acquire a taste for windfarms in Tornado Alley. What we do know is that growth in real wages is a pure function of increased investment. Workers who get to play with newer, more expensive machines make more money because things and services can be provided better, cheaper and faster. I don't like the term capitalism, but one should give Marx his due. He did understand what was at stake. The money and credit and assets held by competitive enterprises - what he would define as "das capital" - are the only chips in the game. If the capital stock is diminished, the holders of cash who are able to invest at 6 or 8 x present earnings will probably make money; but they will be doing it at a time when the workers will be making less - as they did in the decade after the 1982 bottom. (Marx would say it was BECAUSE the new investors were making more money; and even if he was wrong about the causality, he was right about the coincidence; workers' wages do not increase dramatically while capital stock is being rebuilt. They have to wait their turn.)
What we also know is that a world of lower stock prices is one in which profits have declined and the prospect for future earnings has grown less cheery. Those situations usually do present opportunities for future gain but only if someone has "das capital". Andrew Carnegie said that, if you have a choice between losing the factories and losing the people, you want to lose the factories because, with the people you can build a better factory. Being a 19th century primitive, Carnegie presumed that a prudent businessman always had a stash of money - what used to be known as a reserve - whose value was not subject to confiscation or abolition by the government. Carnegie also presumed that he and other prudent businessman would use the cash to pay the workers their wages while the new, better factory was getting up and running. What was different in the past was that there was a stock of private capital willing to speculate after a factory had burned down or the market had crashed.
The question that Kim raised– and for which there is still no apparent answer - is where will that real cash come from now? The diminished future can only be a Grand Bargain after private savings are restored. Until then, it is likely to be a Grand Fail with both the young and the old getting far less than they expect. "Other than that, Mrs. Lincoln, how did you like the play?"
Phil McDonnell writes:
One important aspect of this discussion is to look at the required level of stock prices. To this end it is helpful to consider that there is a large store of wealth in the world which must be invested somewhere. Right now Real Estate is in the dog house so people are dis-investing in that area. But bonds and stocks are relatively close substitutes with comparable liquidity.
Thus the required yield on stocks is simply the reciprocal of the P/E ratio. To be competitive stocks must yield something comparable to and competitive with bonds. But bonds yields are remarkably low now largely through Fed intervention. So stock P/E ratios can go quite high and still remain competitive with the historically low yield of bonds.
Alston Mabry comments:
Perhaps Dr Siegel's thesis will be supported by a new paradigm that dispenses with the connection between "American" and "securities", i.e., is Coca-Cola really just an "American" stock? Or Exxon-Mobil? Or Microsoft? Or many smaller US-based companies whose business is actually global in scope? Or think about the large foreign companies that are a big part of daily trading volume here and also part of most/all retirement accounts. Increasingly, it may be that boomers are selling their holdings into a more and more homogeous global market.
from the WSJ article:
"They say they've been chewing over the issue during vacations together at the New Jersey shore."
One shudders to think of the reality-tv-show possibilities….
Rocky Humbert comments:
An alternative way to look at this issue is to consider whether one's ownership of equities is an investment based on an assessment of future earnings and dividends — or a speculation based on a greater-fool theory.
To quote Keynes: "Most of these [professional investors and speculators] are, in fact, largely concerned, not with making superior long-term forecasts of the probable yield of an investment over its whole life, but with foreseeing changes in the conventional basis of valuation a short time ahead of the public. They are concerned, not with what an investment is really worth to a man who buys it "for keeps," but with what the market will value it at, under the influence of mass psychology, three months or a year hence." Source: Keynes "General Theory," Harcourt,Brace & World 1965 ed. pg 155
This quote is reminiscent to statements made by a certain gentleman from Omaha, whose company has now outperformed the S&P-500 for the past 1, 3, 5, 10, 20 years…
Stefan Jovanovich adds:
The gentleman from Omaha has an easy standard of comparison. If you apply the average tax rate of the S&P companies to Berkshire's past 20 years' earnings, the company's book value drops by roughly 1/3rd. Never mind being a specialist in a bull market; in my next life I want to come back as the owner of an insurance company who is on a first-name basis with the Secretary of the Treasury.
I hate to trash what was once part of Dad's backlist, but Keynes' presumption about what is in the minds of investors and speculators is the truth only because it is theory that has won the academic beauty contest. It has been the most fashionable theory going since neo-Marxism trumped all else (note the reference to "mass psychology"), but it no more likely to be the truth than any other guess about something that is unknown and unknowable.
"The man of system is apt to be very wise to his own conceit. He seems to imagine that he can arrange the different members of a great society with as much ease as the hand arranges the different pieces upon a chess-board." - Adam Smith
Tyler McClellan writes:
I don't understand the relevance of any of the above. There are complicated ways in which falling stock prices affect on economic growth and even more complicated steps through which this transmission affects corporate profits.
But surely other than these effects, we don't care about the price of the capital stock. We care about the return to the capital stock at the given price of transfer. If the profits don't decline, so what if the old transfer the assets to the young at 12x or 15x, excepting of course the old.
Considering the IRR of social security has gone from high 30s for the first generation to slightly negative in mine, I can assure you that we need not worry about the "misfortune of the old". Social security is a flippant example, but the fact is empirically undeniable, the current generation of old people have benefitted from the most massive transfer of wealth to them from the young the world has ever seen. The baby boomers will do materially better than breaking even at current projections (driven almost completely by medicare), and the next generation will do substantially worse.
Its astounding to me that we allow the "old" to impart their wisdom to the "young". Now of course the young will benefit in the non-taxed sectors. If no one in Westchester's children can afford their parents houses, then in aggregate the houses must go down in price. This is a benefit to the children, just as lower stock prices with the same future earnings are a benefit to the young.
I call this the Grand Bargain, either we eliminate the entitlements and the asset prices can stay high, or we pay the entitlements and the asset prices fall. I'm not sure which is preferable.
I am basically a doctrinaire Keynesian, although I'm not sure what analytic work such a concept does or does not perform.
I would simply say that the process you outlined in the below is actually quite different than where you began. You seem to argue on the one hand that the businesses wont reinvest because they don't have any cash flow and then in the second that they wont reinvest the surplus cash flow because they are not confident in future X, Y, or Z.
As you can see those are mutually incompatible facts. Keynes believed that because changing expectations of the future largely effect plans reliant on the far future (such as investment), that in times of panic one should create investment to make use of the excess demanded savings, specifically when the excess of demanded savings was sufficient to make lower interest rates incapable of increasing the demand to invest sufficiently to absorb this excess savings.
Expectations of the future are a source of current period aggregate demand. Changing expectations of the future where everyone wants to invest less than he wants to save (which by the way savings is a flow of income as you correctly identify further down in you argument), can only be accomplished by destroying enough income such that the savings is not actually produced. There cannot be more savings than investment. There is no way to store money, there is no flow of savings that is not spent. That is to say, all savings is spent, just some of it is spent on investment.
I suspect you agree with the above and simply doubt that the way to get people to demand greater investment is to do it for them, and that rather we should provide future tax clarity, lower regulation, jump through hoops… fine, and I don't particularly disagree, but you will see that the fundamental insight remains. With no demand to invest, we cannot fulfill the demand to save. Period, end of story.
Mar
9
Speaking of Causality, from Kim Zussman
March 9, 2010 | Leave a Comment
I used unemployment data to calculate the month-to-month change in unemployment:
"chg" = (this month UNRATE%) - (last month UNRATE%)
Partitioned into Dem and Rep presidencies, each compared to zero:
One-Sample T: D chg, R chg
Test of mu = 0 vs not = 0
Variable N Mean StDev SE Mean 95% CI T P
D chg 325 -0.0086 0.2276 0.0126 (-0.0334, 0.0162) -0.68 0.496
R chg 420 0.0216 0.2063 0.0100 ( 0.0018, 0.0414) 2.15 0.032
Under "D", there was no significant change in month-to-month unemployment, but under "R" there was, on average, significant increase from month-to-month (of 0.02%).
Mar
8
Chart of the Day — Blue Sky Ahead, from Kim Zussman
March 8, 2010 | 1 Comment
Multi-year lows in stocks occurred twice in the last decade: Both in March, in 2003 and in 2009.
The attached chart shows log(SPY) daily closes for both the 2003 and 2009 bottoms, aligning the low days exactly (3/11/03 and 3/9/09). Both series look back 608 trading days before the bottom. Following 3/11/03, log(SPY) is shown to +900 days (10/4/06), and we are now beyond the 3/9/09 low by +250 days.
Plotting log(SPY) allows direct comparison of proportional returns (eg, %) going into and coming out of the abysses. What are the differences?
2009 decline was faster/deeper than 2003
2009 post-decline rise was faster than 2003
2003 is prime and 2009 is not
one is red the other yellow

Mar
8
2011: A Prime Year, from Jim Sogi
March 8, 2010 | Leave a Comment
 Locusts tend to swarm in prime number intervals. It reduces the years in which there might be an overlap with other niche competitors.
Following this idea, here is a thought experiment. Any yearly cycle system must peak or trough on a multiple, making a prime a non-peak or trough in any given cycle system. That in turn means under a cycle following analysis that we are between either a peak or a trough. Since we had a trough recently, that would leave that we have not hit the peak.
Ki Zussman notes:
Speaking of prime numbers, here are the DJIA annual returns for years which were prime numbers (1930-present):
Date DOW prime
12/1/2003 0.253
12/1/1999 0.252
12/1/1997 0.226
12/1/1993 0.137
12/1/1987 0.023
12/3/1979 0.042
12/3/1973 -0.166
12/3/1951 0.144
12/1/1949 0.131
12/1/1933 0.637
12/1/1931 -0.527
One notes these years had higher mean returns than non-prime years, but the difference was insignificant:
Two-sample T for DOW prime vs DOW
DOW prime 11 0.105 0.288 0.087 T=0.52
DOW 70 0.058 0.181 0.022
The next prime year is 2011, followed by 2027
Mar
8
Buena Vista Social Club, from Kim Zussman
March 8, 2010 | 1 Comment
 I highly recommend the documentary The Buena Vista Social Club which will appeal to music lovers as well as students of economics, the human condition, questions about the soul and capitalism. Rent it and play on a home theater with good sound. In 1998 American musician Ry Cooder travels to Cuba to re-organize legendary folk musicians — some as old as 90 — and still fantastic.
Mar
7
US Stock Drift is Look-Back Bias, from Kim Zussman
March 7, 2010 | Leave a Comment
 SP500 weekly returns 1/84-present were checked for mean and stdev:
mean 0.001671
stdev 0.023238
Random number generator was used to generate 100 simulated 36-year markets, with the same stdev (0.023238) but with a mean weekly return of zero. The means of all 100 simulated markets were ranked, and the highest one was found to be 0.001663.
So the probability that actual SP500 weekly returns averaged what it did - 0.001671 - by chance alone - was <1%.
Over the same period for Japan's Nikkei 225, the actual mean and stdev for weekly returns was:
mean 0.000455
stdev 0.029022
Using the same method as for SP500 simulation, the random number generator was used to generate 100 simulated 36-year markets, with the same stdev (0.029022) but again a mean weekly return of zero. The means of all 100 simulated markets were ranked, and the highest one was found to be 0.00174. The actual mean of 0.000455 ranked 30th out of 100 simulated weeks. Japanese stock market drift had a 30% probability of occurring by chance alone.
If upward drift was the result of return for risk, why didn't it occur in Japan?
A friend suggested evaluating drift after adjusting for risk-free return (in this case, 30 day t-bill rates available as concurrent alternative to SP500 index investing). Weekly 30-day t-bill yield data from FOMC* (which uses annualized yield) was converted to weekly yield, and SP500 weekly returns were converted to "risk free return" by subtracting the weekly 30 day yield.
SP500 mean weekly returns (1954-present), and SP500 weekly "risk free" were compared to zero with t-test:
One-Sample T: wk ret, "risk free"
Test of mu = 0 vs not = 0
Variable N Mean StDev SE Mean 95% CI T P
wk ret 2929 0.00152 0.0210 0.0003 ( 0.0007, 0.0022) 3.93 0.000
"risk free" 2930 0.00055 0.0210 0.0003 (-0.0002, 0.0013) 1.43 0.152
Subtracting risk free rate of return dropped the return for SP500 by about 2/3, after which drift is no longer significantly different than
zero.
Jordan Low comments:
Are all dividends included? Perhaps it is because Japanese hold stocks for different reasons? I was in Tokyo when JAL went under and some people were happy to pay 1 yen to be a shareholder to get a certain number of tickets for half price a year.
Mar
6
Multiple Conundra, from Kim Zussman
March 6, 2010 | 1 Comment
 Here is the trouble with multiple hypothesis problem:
Say one wants to test "what happens tomorrow if today is down". You take the mean of days after yesterday was up, and compare this to all days. But you could have asked "what happens tomorrow if today is up". So that is a hypothesis you could have thought of too.
what happens tomorrow if today is down, and bonds are up/down?
what happens tomorrow if today is down, and $/eur is up/down?
what happens tomorrow if today is down, and last year was up/down big?
what happens tomorrow if today is down, and there is a Republican in office (or not) what happens tomorrow if today is down, and the US is at war?
i.e., any hypothesis I can come up with might have been a different one (and would have been, in the case of a capable trader), and any hypothesis I come up with can also be conditioned by other concomitant variables.
Ken Drees replies:
This is exactly why I have problems with a lot of these ideas or theories. I am not saying to not explore or to find relationships, but the future is what it is and that random unknown can match, not match, match slightly, or match inversely whatever likely input one is testing. Everyday is different, yet each day is lived and used and imprinted with the similar human behavior from the previous day or a patterned day and the final resulting price changes are the end net result.
We are all fishing. Some have the latest rods and tackle, some use an old pole and gut instinct. Flexibility of techniques is important — sometimes the fish are hitting on blue, some days its green and sometimes the wind is coming from a different direction than normal and they don't bite much on anything.
I had to unlearn a lot from my h**d** broker who had me listen to Peter Eliades every day trying to pick a top in the Dow in 1995 when the market just went up and up and up. I mean every number imaginable was sliced and diced and arranged to show that the market had to go down, every Elliott Wave turned into a triangle and then another triangle and so on.
Even if you get a "go" sign on an idea and you hit, did it really work because your idea said so or was it some other factor and you got lucky? Got a match?
Mar
4
How to Become a Market Asperger, from Kim Zussman
March 4, 2010 | 2 Comments
Dr. Burry's positions are somewhat autistic. The real story:
“Marked impairment in the use of multiple non-verbal behaviors such as eye-to-eye gaze … ” Check.
“Failure to develop peer relationships … ” Check.
“A lack of spontaneous seeking to share enjoyment, interests, or achievements with other people … ” Check.
“Difficulty reading the social/emotional messages in someone’s eyes … ” Check.
“A faulty emotion regulation or control mechanism for expressing anger … ” Check.
“One of the reasons why computers are so appealing is not only that you do not have to talk or socialize with them, but that they are logical, consistent and not prone to moods. Thus they are an ideal interest for the person with Asperger’s Syndrome … ” Check.
“Many people have a hobby.… The difference between the normal range and the eccentricity observed in Asperger’s Syndrome is that these pursuits are often solitary, idiosyncratic and dominate the person’s time and conversation.” Check … Check …Check.
Profitable book idea: "How to Become a Market Asperger"
- Embrace your inner obsessions
- Men and women are economical
- Pain free without drugs or alcohol
- Learn to stare down a cobra
- Ride your shorts with a smile through hell to new highs
- Leverage the leverage of your conviction
- You win, your investors lose - Darwin lives
- Numerology porcine lipstick
Mar
1
The Selfish Price, from Victor Niederhoffer
March 1, 2010 | Leave a Comment
 The variations in prices during the day is a source of wonderment to all who study them. For example the price of 1 comes up so frequently as to excite the admiration for its fortitude and staying power. Of 26 markets on my screen with a total of 81 digits among them, 30 of them have/are the digit one. Indeed, the proverbial battle during the day between the ensemble of markets and the bulls and the bears might well be considered as a battle among the prices themselves for replication and survivability.
From similar observations in the field of evolution Richard Dawkins came up with the theory of Selfish Genes. He pointed out that evolution works by copying genes. The genes themselves, without any motivation on their part, are in a battle to be passed on. They don't care about the interests of the organism that they are part of. His book based on this theory is considered one of the two most influential books of science of the last 50 years, and has sold more than 1 million copies. It explains and illuminates many phenomena that the traditional view of organisms competing at the level of the phenotype in a struggle for survival of the fittest find hard to explain — particularly altruism, deception, kinship, acting against interest, vivid and startling coloration (green beards).
The time has come to apply this theory to prices themselves. They are the units of variation that try to reproduce that control markets, not the other way around as is so frequently posited. Let's start with the battle of the price 0 to extend itself. Using daily prices, we see the Dow crossing from above 10000 to below 10000 three times during the last two years and crossing from below 10000 to above 10000 on two occasions. The 0 in 10000 gets to express itself four times while in all other prices of recent vintage it is only expressed three times so that 10000 is a particularly noteworthy price to achieve.
In addition, it's a green beard that attracts other prices at 0. When the Dow hits 10000 every financial media is likely to have a headline that the magic number has been broken. Other zeroes in other markets such as the Nikkei at 10000, gold at 10000, oil at 100, the yen at 1000, and the S&P at 1000, soybeans at $10.00 are sure to note the price and copy it. The zeroes in 10000 while acting essentially selfishly benefit other zeroes in other market that have the intellect to recognize what is happening in the Dow. The transmission of these effects in the media magnifies what has been called "green bearding" by Dawkins in the concept of the selfish gene.
 Of course, if recognition plays a part in the propagation of prices, so does deceit. The same way that butterflies mimic wasps, markets may pretend to be going to a recognized number like 10000 but stop right before it as fast moving operations like the specialists or the high frequency traders step in to beat out those who have been deceived by the path. Such activities lead to the well known phenomena that highs below the round number and lows just above it happen much too frequently to be explained by chance in individual stocks and the major market averages.
As a first crack at systematizing the theory of the selfish price, I calculated the closing 10 digit of the S&P unadjusted futures for the last three years, 743 observations in all.
Battle of selfish opening and closing prices
opening price closing price
0 71 88
1 76 69
2 64 55
3 74 79
4 77 70
5 84 79
6 77 76
7 68 65
8 68 76
9 84 70
One notes that the digit of 2 is losing the investment table, some 5 standard errors away from expectation, while the old faithful of 0 is winning the ultimate battle closing 88 times, 3 standard errors above expectation from its 74 expectancy. There are other wonderful and noteworthy phenomena revealed in this table, and its extensions, and many beautiful aspects of the struggle for existence, the mutualism, and antagonism of the prices for one another, and always their tendency to be in a positive feedback system with the growth of the market organism itself, which I will not gainsay the reader the jubilation of ascertaining for himself.
It is well known that genes often work together with each for the greater good of each other. For example, there could be a gene to make disease less likely under certain circumstances, and a gene for long life. A typical example of a gene that is beneficial to other genes but not to itself is a gene in birds for calling out loudly and clearly in situations of danger. The gene helps all the other genes survive in its kin, but not necessarily itself as it calls attention to itself. Genes tend to work together to make for a greater likelihood that the whole organism and all its genes will survive and reproduce. The cost benefit function of a given gene may be y expressed as pb versus c where b is the benefit a gene gives to another gene, c is the cost, and p is the increase in probability that the other gene will provide to it.
The cost benefit function creates a situation where the genes come to be represented according to their net contribution to their ability to be reproduced in successive generations, including their cumulative impact on all other genes in the genome. The opposite situation which occurs must less frequently is called intragenomic conflict, and the classic example is referred to as segregation distorter genes which act to crowd out other genes that are beneficial to fertility. Egbert Leigh expresses this unlikelihood as follows: The genes act as "a parliament of genes, each acting in its own interests, but if it acts hurt the others, they will combine together to suppress it."
Apparently the price units of selection in markets do not act to suppress their neighbors. During the last 2600 days for example in the S&P, 2530 days in the S&P 24 hour futures, 2412 of them have allowed each of the ten separate 10 digits, 0 to 9 to appear. In other words the 24 hour range has been more than 10 on more than 95% of all days. Apparently it keeps all the individual prices healthy to exercise each of its competitors on almost all days.
Here is a good reference on this Selfish Price theory which I posit in all seriousity.
Rocky Humbert notes:
The paucity of "2" as described by the Chair is a persistent phenomenon. For the 12,143 trading days between 1955 to 2003 (when the S&P first went over 1,000), the digit "2" occurred (as a tens) only 5.1% of the time.
Perhaps some of this may be explained by number theory — i.e. index calculation effects due to stocks trading in eighths and quarters, and that may also explain the increase in the "2" in the Chair's data post decimalization. (He found "2" rose to 8% from the 5.1% over the longer period.)
One further notes that on most QWERTY keyboards, the lowly "@" sits above the "2". Prior to email, the @ was slowly facing extinction– only to be resurrected to prominence contemporaneous with AAPL stock. Hence I believe it's premature to put the "2" in the Peabody Museum diorama that also houses the Dodo Bird and Pig-footed Bandicoot.
Marion Dreyfus comments:
There is apparently a marker gene for how many times a person sneezes when he or she sneezes daily–This might be a signal to alert noticers of the individual patterning of investment thinking or individual behavior. As some people always sneeze thrice, and only thrice, or twice if the gene for twice is embedded in the coding ''parliament'' of the genome sequencing, perhaps we also have an idiosyncratic pattern of investing that has hitherto gone unnoticed. Can this be mapped, one wonders. And if so, can one be thus invested with more knowledge of the other's "hand," as in playing poker with someone whose "tell" you know, so you can conserve bets for when a hand/bet/risk is most propitious…
Pete Earle writes:
 One of the tools used in determining genetic action– or, more aptly, interaction– is the morpholino, a short, targeted nucleotide sequence which blocks ("knocks down") expression of one gene among two or more to see if, or how, the ultimate expression of said genes changes. My partner is involved in exactly this sort of research daily. Once she targets a gene– in this example, trying to determine the interaction of two genes in producing a specified outcome (gene A + gene B = expression C)–she then conducts subsequent experiments in which she varies the amount of the morpholino between 0% (no morpholino, the control group) and increments up to and including full strength (complete knock-down of gene A, 100%). This is to determine which gene, if any, is more important to a given expression than the other; and to see if a gene interaction is of the simply "on/off" type or if expressions take place along a spectrum of outcomes.
I suspect that with respect to Vic's Selfish Price Theory, we might look at morpholino-equivalent testing with a comparison of periods within which a given market approached a certain number-expressing level, and compare those with others, looking for volume superlatives; one would expect the day or week of the arrival of Dow 8888, 10000, and 11111 to be of higher volumes to a statistically more significant extent than, say, those when Dow hit 12345 or 9876. This could be broadened to look at random snapshots of days where, across a number of indices or index-constituting stocks– even, and perhaps especially, in the absence of such aesthetically pleasing prices as 10,000 or 55 and such– we would look for higher-than-expected volumes when and where there noteworthy appearances by a particular number across a spate of closing prices.
Pitt Maner III writes:
My dentist last week mentioned to me that he was studying the latest papers (within one day of publication) on gene "crosstalk" so as to help his daughter in college who is doing an honors thesis on the subject (and how it relates to drug interactions with cancer cells). Cancer cells evidently have a means of (and this is over my head—cell experts please jump in) of dampening the effects of anti-cancer drugs through cellular cross-talk genes. Therefore drug manufacturer have a need to knock out the cancer cells through a series of steps to weaken these defense/signaling channel mechanisms.
Any underlying, as yet undefined, step-like mechanisms and pathways would seem to skew number distributions.
Henrik Andersson comments:
 This seems somewhat related to Benford's law which predicts the probability of digits, for example the probability that a stock index of stock price will start with a '1' is slightly above 30%. A funny side note is that this theory of frequency of numbers in nature can be checked using Google searches.
Victor Niederhoffer responds:
I don't think it applies here, especially for the second, third and fourth digits.
Henrik Andersson replies:
Yes, it probably only over powers other forces in the market for the first digit.
Kim Zussman writes in:
The SP500 is Benfordian:
Using daily closes SP500 1950-present, counted days which closed with the first digit = 1. eg, {1XXX.XX, 1XX.XX, 1X.XX} (there were no 1.XX yet}.
Of 15135 total days, 5514 had 1 as the first digit.
Alston Mabry writes:
And to relate that chart to genetics: If volatility = selection pressure, then when volatility/selection pressure is low, variability in digit frequency/phenotype expression is high; but when volatility/selection pressure is high, variability in digit frequency/phenotype expression is low.
And different species have different time intervals, i.e., lifespans.
Peter Earle responds to Henrik Andersson's comment:
At risk of torturing the analogy a bit– but worth mentioning: "Yes it probably only 'over powers' other forces in the market for the first digit. "Let's discuss those "other powers", as they are germane to Vic's theory. It's appropriate to at this point bring up one of the hot topics that my partner, again, is working on: epigenetics. In short, it's the imposition of hard-coding changes on DNA (via methylation) by environmental effects. While still not fully understood, one example is depicted by rat experiments in which the pups of profoundly overweight mothers (exposed to high levels of interuterine glucose) switched at birth with skinnier rat mothers show a statistically significant greater chance, thereafter, of becoming obese, even setting aside "lifestyle" and dietary settings. (See the "Barker Hypothesis" for another example of this phenomenon.)
With respect to Vic's Selfish Price theory, we might quantitatively express these variations from expected (Benford's Law) vs. actually expressed frequencies of prices/digits as an epigenetic effect: 'environmental' effects whereby the impact of market participants and economic influences -forces and memes - push toward or away from predicted, anticipated baselines.To that end, tracking the ebb and flow in expressed, realized prices from what which the Law predicts over time could provide one way– no doubt an incomplete way, but a way nonetheless - of quantifying the ever-changing cycles.
Alston Mabry says:
Back to the tens digit, this time in the S&P cash. Starting with January, 2004, I calculated a 250-tday rolling total for each digit, e.g., in the past 250 tdays, how many times has the tens digit of the S&P Close been 0 or 1 or 2, etc. Then calculated the gap between the most frequent and least frequent digit, e.g., if 6 was the most frequent in a given 250-tday period, occurring 48 times, and 3 was the least frequent, occurring 21 times, then the max-min gap would be 48-21 = 27.
Then for I calculated the SD for each 250-tday period, too, as a measure of volatility. The attached graph shows the two series. What can be seen is how the max-min gap is higher when volatility is low, but compresses into a narrow range when volatility increases. This seems intuitively sensible if one thinks of a more volatile S&P moving quickly through various values and thus being more "random" at the tens digit. Whereas, when volatility is low, the S&P would be "stickier", hanging around longer at certain tens digits, thus creating a wider max-min gap.
Of course, an underlying factor is the arbitrary nature of choosing a unit of time such as a trading day. If one zoomed in and out, using different lengths of time to create ecah "Close", then one would probably see a clear relationship between volatility and digits on different time scales.

One more take (esoteric, but I really like the chart): For each S&P day from 1990 to present, calculate the distribution of the tens digit in the S&P for the 250-tday period ending that day: 41 zeros, 24 ones, 23 twos, etc. Then get the SD for this distribution. Example:
41 0's
24 1's
23 2's
17 3's
26 4's
20 5's
20 6's
21 7's
19 8's
39 9's
SD: 8.33
Then calculate for the same 250-tday period the SD of the daily change in points of the S&P - points rather than percent because we are relating index point movement to digit distribution.
So, for each 250-tday period, we have a measure of the volatility of the index and the variability of the tens digit. Sort all the 250-tday periods by the S&P volatility value, high to low, and graph the result - see attached graph .
Nice inverse relationship between the S&P point volatility and the variability in the tens digit.
Mar
1
The Impact of the Earthquake, from George Parkanyi
March 1, 2010 | 2 Comments
 One wonders about the impact of this earthquake on copper and basic materials prices. Is the infrastructure (rail, ports, etc.) in Chile damaged to the extent that copper shipments will be impaired for several weeks/months? And what of the demand for basic materials to repair all the other infrastructure? More ominously, is there a trend in increasingly destructive earthquakes (and collateral effects such as the 2004 tsunami disaster?)
Anton Johnson comments:
I found the paper "Measuring the Impact of Natural Disasters on Capital Markets" by Worthington and Valadkhani of Queensland University of Technology to be interesting.
George Parkanyi adds:
On vacation in Hilo last summer, we went to the tidal wave museum. There have been many major earthquakes around the Pacific rim in the past 100 years, yet only two generated killer tsunamis in Hilo Bay. The profile of an earthquake is very important to how much and how the energy propagates. The ones that tend to spawn dangerous tsunamis are the ones that cause a shearing and shift up or down of one side of the ocean floor, like the 2004 one in Indonesia. It is always correct to take the precaution of evacuating low-lying areas, because you can never know if any given earthquake will be one to generate a killer, but I don't think it is something to be overly feared, because of the relative infrequency, and the fact that there is usually plenty of time to evacuate. When you don't have a lot of time, and need to move really fast, is when you feel the earthquake, because that means it happened nearby, and is its own warning.
The risk of anyone's being hurt, in Hilo at least, is also lessened by the fact that Hilo was smart and didn't allow any re-building of residential buildings in the low-lying mapped out flooding zone. There are commercial buildings, but the chances of anyone being surprised at night in their beds is near 0. I'm pretty sure that Japan has similar measures in place along its coasts.
Kim Zussman writes:
Thanks to Big Al for the link, which produced the following academic study:
Looking just at earthquakes >7 magnitude, since 1900 has the death/year increased over time?
Running two regressions, one (death count) vs year, and the other (death count) vs year only for deaths>10, the slope coefficient was not statistically significant. Here for the second regression:
The regression equation is
deaths10+ = - 121592 + 66.3 Year
Predictor Coef SE Coef T P
Constant -121592 131916 -0.92 0.358
Year 66.27 67.36 0.98 0.326
S = 30633.2 R-Sq = 0.4% R-Sq(adj) = 0.0%
Note however the "Year" coefficient of 66 is positive (ie, rate increasing by 66 per year), so perhaps it will become significant sometime before Nasdaq 5000.
Jim Sogi comments:
There are interesting google results on earthquake and full moons. The theory is that gravity and tides contribute to geological pressures. We've discussed the full moon effect before on markets. Similar result for geological phenomena, but anecdotally very compelling.
Mar
1
Non-Practicing Snakes, from Kim Zussman
March 1, 2010 | Leave a Comment
 The other evening I noticed a small snake huddling in a corner of the garage. It had a reddish-brown color with black spotted pattern. I moved it with a stick to see there was no rattle on the tail, then picked him up (in California the only snakes poisonous to humans have rattles. Ringnecks and Lyre snakes are mildly poisonous but not dangerous).
He was friendly (didn't try to bite), about 10" long, and looked a bit like a gopher bullsnake. But he was different; retruded mandible, vertical pupils, and a black spot on the side of the head. Turns out he was a nocturnal snake rare to this area (adjacent to Santa Monica mountains), a glossy snake (Arizona Elegans Occidentalis).
I was holding him during a discussion with some people in the kitchen, one of whom was describing her boss as "Jewish but not practicing". They asked me about the snake, and I explained he was a practicing Glossy snake.
Feb
26
Euroshort Cover? from Kim Zussman
February 26, 2010 | 2 Comments
 Today on page 1 of the WSJ there is an article about big hedge funds piling onto the short Euro trade, including Einhorn, Soros, Cohen. It describes a meeting where they selling this idea to each other (sprachen sie buch?), which is not collusion or inside. Evidently Paulson Co are now on the other side.
1. Short cover rally in Euro appropriately ironic now
2. Or not, as who wants to take the other side of with masters of the universe?
Feb
22
The Holy Grail of Diversification, from Kim Zussman
February 22, 2010 | Leave a Comment
Japan stock index etf EWJ weekly returns were compared with contemporaneous weekly returns for SPY, 1996-present. Correlation between the two returns series were noted at the end of each non-overlapping 10-week period, and this was regressed against date:
The regression equation is corr 10 = - 3.53 + 0.000107 Date
Predictor Coef SE Coef T P
Constant -3.5324 0.8395 -4.21 0.000
Date 0.000107 0.00002223 4.79 0.000
S = 0.274960 R-Sq = 24.7% R-Sq(adj) = 23.6%
The highly significant positive slope coefficient shows the correlation increasing over the past 14 year period.
Relatedly, cartoons have become less correlated with reality over time.
Feb
18
Westminster Kennel Club Stock Market, from Rocky Humbert
February 18, 2010 | 6 Comments
 The "Superbowl Indicator" has earned a dubious place in stock market forecasting lore. Much less known, but statistically more persuasive is my proprietary Westminster Kennel Club Scottish Terrier Indicator "WKCSTI."
The WKCSTI is triggered when a Scottish Terrier wins "Best of Show," and over the past 103 years, it has correlated with bullish stock markets.
Year that a Scotty Won/Stock Market Return:
1911: 3.52%
1945: 39.35%
1950: 34.2%
1965: 12.45%
1967: 24.4%
1985: 32%
1995: 38%
2010: ?
Note: The study did not include West Highland Terriers despite their genetic similarities to the Scottish Terrier. That is left as an exercise for the reader.
Sources: A list of the Westminster Best of Show Winners can be found here.
The stock market returns can be found here.
Kim Zussman replies:
Using two sample t-test to compare mean returns for "Scotty" vs All, Scotty is significantly higher than all years in the series (SP500 or
facsimile, per linked site):
Two-sample T for Scotty vs All years
N Mean StDev SE Mean
Scotty 7 26.3 13.6 5.2
All years 103 11.4 20.3 2.0
Difference = mu (Scotty) - mu (All years)
Estimate for difference: 14.8962
95% CI for difference: (1.8206, 27.9719)
T-Test of difference = 0 (vs not =): T-Value = 2.69 P-Value = 0.031 DF = 7
Rocky discovered yet another market anomaly. Beam us up, Scotty!
Feb
17
Hubris, Hope, and Luck, from Jeff Watson
February 17, 2010 | 9 Comments
 I cannot count the number of times my trading was going along really well, then all of the sudden, wham… all my profits were erased in one fell swoop, one bad trade. In retrospect, I got arrogant, and decided, because of my invulnerability, to assume extra risk which became my undoing.
Despite many decades of trading, I still occasionally get a b**ch-slap from the mistress of the market when I get excessively confident. In my own case, this seems to happen when I have many trades on and all are solidly in the black, or I've had a real good run. I get a sense of invulnerability, hubris, and that's my own personal kryptonite. At least I can recognize this flaw, and it hasn't reared its ugly head in a few months. Usually when my normal balance between my offensive and defensive game goes out of whack is when I get killed. Now I have a system in place that identifies when I'm about ready to go on tilt. The system hasn't kicked in yet, so maybe I'm learning something.
When I was coming up, an old grain trader told me that "Hope" is for losers. I used to get stuck in a position, and hope it would come back, and it usually would not. In fact, my friends saw me hoping for an improvement and were fading me all the way down. It took awhile, but I learned that hope won't bring the market to your favor, but hope will make you go bankrupt. Finding people full of hope can be a gold mine for you, provided you play it right. Seeing a person "Hope" for his position to improve enables another person to get additional clarity on what the market is going to do….at least in my case…..but I like fading losers. The converse is that I don't mind or take it personally when people fade me when I'm wrong.
Luck is just wrong. I don't believe in luck, and if it were to exist it would be a zero sum game. Is a person who wins the lottery lucky, or is he just part of the statistical distribution? I like to think of luck as an offspring of statistics and probabilities. There is a probability for every possible occurrence in the universe, and things just happen without any mysticism involved..Some gamblers like to have lucky rabbit's feet, or other talismans. I like to sit in position to those guys in table games. Some guys like to brag about their lucky streaks and I listen carefully. I like to observe their streak, and at some point, start to fade them, a little at first before I really press. Sometimes this works, sometimes I get my butt handed to me on a silver platter, it depends.
My favorite are the superstitious, as they believe that some mystic power controls their destiny. Evidence of any kind of lucky charm raises my curiosity and I try to observe that person for any fade clue. It's tough enough to pull money out of the markets. The emotions of hubris, hope, and luck make it near impossible to make money. These emotions are akin to having a horse player bet the his idea of an overlay, only to lose, and hear the lament, "Boy, I wish there were just one more furlong." In horses, as in the market, and life, there is not one more furlong and do-overs aren't allowed.
Kim Zussman replies:
How about this definition of luck:
From Merriam-Webster:
1 a : a force that brings good fortune or adversity b : the events or circumstances that operate for or against an individual
2 : favoring chance
3. Favorable or unfavorable outcome which was not caused by skill, effort, or actions taken.
I purposely left out "ability", since some large fraction of ability is genetic, and one can only obtain good parents by luck.
Janice Dorn writes:
Self attribution bias applied to trading posits that traders attribute good results to skill and bad results to bad luck. This is a common bias that underlies the inability of many to admit they made a mistake.
Rudolf Hauser writes:
Kim's definition of luck is a good one but I disagree when he writes "I don't believe in luck, and if it were to exist it would be a zero sum game." There is no question that ability, persistence, preparation and work in general are needed to take advantage of opportunity, but luck also plays a part. So much of what we do involves interaction with other people and some depends on being in the right place at the right time. The geologist or anthropologist who is traveling somewhere and happens to notice some clues that will lead to a significant discovery is the beneficiary of both his or her skill and good the good fortune of being alert (not luck –or is it if you were just doing something else at that time and so missed what you otherwise would have notice so you had bad luck) and the luck of being in the right place at a time they had the experience to take advantage of the opportunity.
Or what about the person who takes a job in a local company that just has a product about to take off and ends up making a super salary and seeing the stock he purchased in the company rise and make him rich whereas if he had done the same in another town with the same skills and hard work doing much less well because the people running the company in and industry with no such product line and whom he had never meet were bad managers and ran the company into the ground? Sure he or she did not have perfect foresight and the ability to evaluate the thousands of people one interact with and predict how will interact with them over a lifetime–but then who does?
There is no question in my mind that a person who does not fully apply themselves is not likely to be able to take advantage of what good fortune of opportunity presents itself but there is also no question that luck plays a major part in life. And it's not just genetic– if you were born in a country in perpetual war and poverty your changes of a good life are much less than if you were born in the U.S.A. Or what about the Jewish children born in the 1930's in Germany or central Europe rather than the U.S.A. or being born in either place in the 1960's? Was that there bad luck or a failure of keen judgment and hard work on their part if they died in Hitler's gas chamber? What about the person who contracts a disease and dies from it when a cure would have been available had he gotten the disease a decade later? Was that something he or she could have prevented or just bad luck?
Kim Zussman adds:
I know a guy who is a retired contractor/developer, who "came from Germany with $20 in his pocket" and is now very wealthy. He developed a number of commercial and residential properties.
Why so successful?
1. He happened to like to work outdoors, was good with building, and good at commanding laborers
2. Was born charming
3. Was lucky to have lived through three decades of atypically high appreciation in real estate
Had any of the above three been missing, especially #3, he would not been as successful — maybe even a failure. I call that luck.
You can say the same about stock bulls in the 90s, oils and railroads in the past — all kinds of bull markets and bubbles, without which the great moguls and flops would not be. Not to mention war heroes who survived to tell the story, as opposed to those who took equal action but were silenced.
Economic society is pretty much zero sum over short periods, if you add all the give and take together.
Russ Sears writes:
Much of what we call luck is really the skill, effort and actions taken by others and given to us by the generosity of those most successful.
This would include living in a free country.
Further, much of this skill, is willingness to take actions and give effort where the difference between success and failure often hinges on the smallest thread. A thread so small, that even the most skilled, those putting the most effort can not be assured that any fruit will be borne. But one where the skill lies only in putting the edge in their favor.
This would include parenting and trading.
Finally, much of what looks like incredible luck is compounding of these skills over time and history.
However, to anecdotal throw a wrench into the "no such thing as luck" I have a relative by marriage, that won 2 lotteries. One a $4.3 million jackpot in MO state lottery, by entering one ticket a week. The other a half million Reader Digest sweep-stake, by answering the junk mailer. But she would like to remain anonymous.
The untold story however, is how the money tore apart her family. Luck or curse, I leave it to the reader.
Jim Sogi writes:
 Chinese proverb
Good Luck Bad Luck!
There is a Chinese story of a farmer who used an old horse to till his fields. One day, the horse escaped into the hills and when the farmer's neighbors sympathized with the old man over his bad luck, the farmer replied, "Bad luck? Good luck? Who knows?" A week later, the horse returned with a herd of horses from the hills and this time the neighbors congratulated the farmer on his good luck. His reply was, "Good luck? Bad luck? Who knows?"
Then, when the farmer's son was attempting to tame one of the wild horses, he fell off its back and broke his leg. Everyone thought this very bad luck. Not the farmer, whose only reaction was, "Bad luck? Good luck? Who knows?"
Some weeks later, the army marched into the village and conscripted every able-bodied youth they found there. When they saw the farmer's son with his broken leg, they let him off. Now was that good luck or bad luck?
Who knows?
Feb
11
No One Ever Went Bankrupt Taking a Profit, from Rocky Humbert
February 11, 2010 | 2 Comments
Mr. Galen Cawley kindly provided a link to a dated, but still interesting article entitled, "An analysis of the profiles and motivations of habitual commodity speculators". This comment was on William Weaver's post: "Study shows why it is so scary to lose money". I found this article provocative because when I was younger, some of my innate instincts were similar to the habitually losing commodity speculators'. I suspect everyone who reads this article will see some foibles he has overcome (or needs to overcome) for self-improvement. To summarize the article:
1) Most speculators use too much leverage.
2) Most speculators don't hold their positions for sufficient time.
3) Most speculators don't use stop loss orders. (However, the authors didn't differentiate between actual stop-loss orders and mental stops. The point was they don't cut their losses.)
4) Most speculators prefer a serious of "modest" short-term profits versus slowly accumulating long-term gains in a single position.
Bottom line: They found that the average speculator had a win/loss percentage of 51.3% and the best speculator in the study had a win/loss percentage of 80%. However, he still lost money because of his low profit factor. Despite great win/loss ratios, the average trader in the study is a career net loser. It's a Wall Street platitude that "no one ever went bankrupt taking a profit." This study shows that the platitude is false.
Kim Zussman comments:
"Most speculators don't hold their positions for sufficient time."
"Most speculators don't use stop loss orders… The point was they don't cut their losses."
Which is contradictory because many deep losses reverse eventually ("every price is hit twice")*, and often the correct trade is to wait for losses to reverse (and often it is not). Taken together, this means "ride your winners and ditch your losers." Isn't that trendfollowing, and if so, what if the (currently traded) market is not trendy?
*except Nasdaq 5000 in our lifetimes.
Victor Niederhoffer comments:
One has not read the article, but would wonder whether speculators would lose as much if they showed opposite traits. However, the characteristics noted all would lead to greater vigorish and this is where most of profits from the market makers occur. Everything that happens is guaranteed to increase the profitability of that vigorish to the house or top feeders.
Rocky Humbert responds:
If one attributes the speculator's losses entirely to transaction costs, then one's performance can be improved by simply having fewer transactions. One wonders whether there is an a priori relationship between all of w/l ratio, profit factor and quantity of transactions? Splitting hairs, I quarrel with your choice of the word "guaranteed." A much wiser man taught me that the only things guaranteed in life are "death and taxes."
Jordan Low comments:
Macro traders should be long gamma as markets can stay irrational, while value traders should be short gamma especially if they are positive carry and see no devaluation/fraud risks. I think it all depends on your style of trading.
Victor Niederhoffer writes:
One would say this is perfect as one trader should always be one way and the other trader should always be the other way. that is guaranteed to make the top feeders a perfect guaranteed profit. I say the above in all seriousness and respect to the high thinking Mr. Low.
Rocky Humbert comments:
Mr. Low articulately differentiates between arbitrage/positive carry, mean-reversion (providing liqudity) and trend-following (taking liquidity). Arguably every single trade or investment fits into one of these categories. But I'm confused and intrigued by Vic's comment about "top feeding".
Specifically:
1. Who exactly are the "top feeders" and should we buy their stock?
2. Are the top feeders always the same participants? If they always make a "perfect guaranteed profit" then how can they ever slip from their perch of being a top feeder? (Were EF Hutton, SW Strauss, Shearson, SmithBarney, Dillon, Kidder, Drexel, Revco, Bear, Lehman, Merrill once top-feeders?)
3. And if they do eventually slip off their perch of "top feeder" — then how does one argue that they ever had any advantage? As opposed to being just another opportunistic profit-seeking participant?
Theoretical questions of course — but they challenge the hypothesis.
Yishen Kuik comments:
Seems to me there is some kind of law of conservation going on. Usually if win-loss is very favorable, avg win > avg loss, then frequency of trades is low. If win-loss is very favorable, avg win < avg loss, then frequency of trades is moderate. If win-loss is only very slightly favorable, avg win > avg loss, then frequency of trades is high.
etc. etc. …. all solving for a reasonable profit factor.
But if you are doing something quite different or if you are early in a wave, you can have an unreasonably high profit factor. Then again, there is always the argument that low profit factor strategies with low capacity are the ones with the longest half lives.
Jordan Low replies:
I appreciate the response.
My view is that the trades do not always net out. While the macro traders are attracted to events such as subprime, china, commodities or Greece, value traders avoid those trades rather than taking the opposite view. Buffet did not invest in dotcoms for example. Each has his own reasons, from only trading what he understands, to seeking or avoiding volume/volatility, to seeking catalysts.
Aside from trades, there might also be a timing mismatch. Traders with most skill in my view know when to sit on their hands. Others might be lucky or unlucky. Eg penny stock momentum strategies might only work in the dotcom era but not after. On the other hand, value did well in the great moderation of 2004-2006 but not during the quant meltdown of 2007. Given the tendancy to chase performance, the dollars in each camp may not net out exactly.
I hope this clarifies my view, but I do think there are top feeders that make good returns off their franchise. ETF providers make money both by providing access to hot markets and by lending stock to short, for example.
Call me Jordan…
Feb
11
Another Round, by Kim Zussman
February 11, 2010 | Leave a Comment
DJIA has recently been near the 10,000 level again (first time in 1999). Checking DJIA closes +/-1% from "round numbers" (ie, 8000,9000,10000,..), I found the most frequent near-round closes were at 11,000, followed by 10,000 (data not shown). In a way, 10,000 is more round than 11,000, but that is more a problem for numerologists.
Another check on possible trading effects related to round numbers was done by looking at days (c-c) which transitioned from below 10,000 to above (and from above to below). And a good control for comparison is the adjacent, non-roundish transition from below 10,500 to above 10,500 (and from above to below).
First is comparison of below to above for 10K and 10.5K:
Two-sample T for XUP10 vs XUP105

N     Mean    StDev  SE Mean
XUP10   30  0.01418  0.00761   0.0014  T- 0.69
XUP105  59  0.01279  0.00951   0.0012

>> the mean moves from below to above 10,000 are bigger than those from below to
above 10,500, but the difference is N.S.

Now the same for down moves:

Two-Sample T-Test and CI: XDN10, XDN105

Two-sample T for XDN10 vs XDN105

N      Mean    StDev  SE Mean
XDN10   29  -0.01419  0.00837   0.0016  T=0.18
XDN105  59   -0.0146   0.0121   0.0016
about the same
///////////
So the size of moves up through the round and down through the round are not different from similar moves through an adjacent non-round.
Is there more variation? The same data was used to compare variance for up moves through 10,000 with up moves through 10,500:
Test for Equal Variances: XUP10, XUP105

95% Bonferroni confidence intervals for standard deviations

N      Lower      StDev      Upper
XUP10  30  0.0058  0.0076  0.0107
XUP105  59  0.0078  0.0095  0.0119

F-Test (normal distribution)
Test statistic = 0.64, p-value = 0.194

The variance was a little less for up moves through 10,000 than
10,500, but the difference was N.S.  Here is the check on variance of
down-moves:

Test for Equal Variances: XDN10, XDN105

95% Bonferroni confidence intervals for standard deviations

N      Lower      StDev      Upper
XDN10  29  0.00643  0.00836  0.01185
XDN105  59  0.00997  0.01205  0.01518


F-Test (normal distribution)
Test statistic = 0.48, p-value = 0.037


>> Assuming a normal distribution, the variance associated with down moves
across 10,500 was significantly greater than those going below 10,000.

///////////////

What about days after crossing above/below 10,000 vs 10,500?

Two-Sample T-Test and CI: XUP10N, XUP105N

Two-sample T for XUP10N vs XUP105N

N     Mean    StDev  SE Mean
XUP10N   30  -0.0002   0.0127   0.0023  T=0.23
XUP105N  59  0.00040  0.00845   0.0011

Two-Sample T-Test and CI: XDN10N, XDN105N

Two-sample T for XDN10N vs XDN105N

N    Mean   StDev  SE Mean
XDN10N   29  0.0002  0.0148   0.0028  T=-0.43
XDN105N  59  0.0015  0.0131   0.0017
Feb
10
Counting Laughs, by Pitt T. Maner III
February 10, 2010 | 2 Comments
No laughing matter. Looks like there is a need for better material…. could this be a contrarian indicator? "Back in May, POLITICO analyzed the press briefings and found that the instances of laughter — as indicated by "(Laughter)" being noted in the official transcript — occurred more than 10 times per day during press secretary Robert Gibbs's briefings. But the laughter has been reduced by half in recent months: In the first six months of the Obama administration, briefings produced an average of 179 laughs per month. Over the past six months, the average has dropped down to 89. " Press Room Laughter Dies Down .
Kim Zussman responds:
Similarly, stocks reversed around the time of the Massachusetts senate regime-change, as attention was moved from center-stage healthcare change and diverted toward the "deficit we need".
Feb
9
Study Shows Why It is So Scary to Lose Money | Reuters, by William Weaver
February 9, 2010 | 6 Comments
Brain Basics: Brain Damaged Investor from Inside the Investor's Brain by Richard L. Peterson
According to a 2005 Wall Street Journal article, "Lessons from the Brain-Damaged Investor," brain-damaged traders may have an advantage in the markets (1). Study participants who had a brain lesion that eliminated their ability to emotionally "feel" were compared against "normals" in an investment game. The chief researcher, Professor Baba Shiv (now at Stanford University), used a mixed sample of patients with damage in emotional centers including either the orbitofrontal cortex, the amygdala, or the insula.
In Shiv's experiment, each participant was given $20 to start. Participants were told that they would be making 20 rounds of investment decisions. In each round, they could decide to "invest" or "not invest." If they chose not to invest then they kept their dollar and proceeded to the next round. If they chose to invest, then the experimenter would first take the dollar bill from their hand and then flip a coin in plain view. If the coin landed heads, then the subject lost the dollar, but if it were tails, then $2.50 was awarded. On each round, participants had to decide first whether to invest. The expected gain of each dollar "investment" was $1.25 (average of $0 and $2.50), while each "not invest" decision led to a guaranteed $1. The expected value of the gamble being higher, it was always the most rational choice. Thus, one might assume that subjects always "invested" in order to make more money.
In fact, the results are not uniform. Normals (without brain damage) invested in 57.6 percent of the total rounds, while brain-damaged subjects invested 83.7 percent of the time. Many normal subjects (42.4 percent) were "irrationally" avoiding the investment option. Following an investment loss in the prior round, 40.7 percent of the normals and 85.2 percent of the patients invested in the subsequent round. After recent losses, normals invested 27 percent less often. They became even more "irrationally risk avoidant" after a loss.
Of the patients with different brain lesions, the insula-lesion patients showed the leas sensitivity to risk, investing in 91.3 percent of all the rounds and in 96.8 percent of the rounds following a loss. As a result, it appears that the insula is one of the most important drivers of risk aversion. Without an insula, brain-damaged patients were more likely to "invest."
On the lighter side, neurologist Antoine Bechara ventured that investors must be like "functional psychopaths" to avoid emotional influences in the markets. These individuals are either much better at controlling their emotions or perhaps don't experience emotions with the same intensity as others. According to Professor Shiv, many CEOs and top lawyers might also share this trait: "Being less emotional can help you in certain situations." (2)
1. "Lessons from the Brain-Damaged Investor" Wall Street Journal, July 21, 2005.
2. Chang, H.K. 2005. "Emotions can Negatively Impact Investment Decisions" (September). Stanford GSB.
Newton Linchen replies:
Larry Williams teaches that we shouldn't try to "improve" our personality regarding trading and emotions. There are "emotional guys" and there are "cold guys". Being an emotional type and trying to become cooler is another problem to solve, and the markets gives us already much trouble to work with. So, he says in his books that we should only recognize "what type" of people we are, and develop our trading style accordingly.
Pitt T. Maner III comments:
With the availability of more and more powerful software programs for the average Joe, will the human element eventually be less of a factor? One for instance can play a very mean game of chess without being a grandmaster by using a powerful program to suggest moves. There are tournaments where this is allowed—man/computer chess. http://en.wikipedia.org/wiki/Advanced_Chess So could it be that there will be a move towards very advanced "cyborgian" arrangements in the future. Not necessarily more profitable but less emotional–more algorithmic. It seems the younger generations are more trusting of technology to solve all problems, and as costs come down on the technology and software, will there be a pull to use methods similar to those now employed by professionals? Can one become competitive by using a "crutch"? Mr. Schnytzer noted a couple of years ago, " My guess is that with Deep Blue at your disposal, you'll beat Nigel easily at chess, but won't improve on your options trading profitability." Of course there is a company, however, using the Cyborg name that promises (for a small fee) to bring all this to the common investor…but does it work, or with increasingly advanced software can it work in the future? http://www.businessinsider.com/cyborg-trading-promises-hft-solutions-for-joe-trader-2009-11
Kim Zussman comments:
'We should only recognize "what type" of people we are, and develop our trading style accordingly.' Up to and including not trading. The idea that anyone can learn to trade successfully can be checked by asking yourself:
1. Could you learn to play competitively right now in the NBA , NFL, or national league?
2. How long could you stay conscious in the boxing ring for your weight class, or with an opponent twice your size (SEC says no guns allowed)?
3. If trading can be taught, why do most fail?
4. If a scientist, by definition shouldn't you be too quick to abandon convictions, and therefore vig-out with overly-tight stops?
Rocky Humbert responds:
The answer to Kim's question #1 and #2, as posed, is self-evident.But there may be flaws in the question. No one can just walk onto a field and play pro ball. Likewise, no one can walk into an operating room and perform open heart surgery. However, must people can (assuming they are able-bodied and mentally capable) invest thousands of hours and achieve some reasonable level of proficiency in most activities. A reasonable level of proficiency, does not mean being Derek Jeter, Tiger Woods, Christian Barnard, Buffett, Soros, Steinhardt and Robertson. Fortunately, one does not have to be in the 99.999999% percentile to be deemed a non-failure — or almost every reader (myself included) of this email would be over-dosing on anti-depressants! On #3, Why is there any reason to think that the percentage of traders who fail is any more than the percentage of entrepreneurs who fail (90%), or the number of people who drop out of the 36-week Navy SEAL class (70+%)? Competitive, high-risk activities always have a high drop-out rate. But, most of these people find their calling and are productive members of society…even if they can't throw a 100mph fast ball.
Jeff Watson comments:
I've often wondered where that meme of a 90% failure rate in trading originated. I see it in the literature, and hear it repeated all the time, accepted as gospel. Has anyone actually done a study to quantify this, or is the number just one of those numbers like Mitch Snyder pulled out when he quipped that "10,000 homeless people die a day".. And, what constitutes success in trading, what time parameter. Is success measured by return, by amount made, or by the ability of someone to grind out a small profit for 30-40 years, solidly in the black but never making a fortune?
Rocky Humbert replies:
Jeff's statement: "Is success measured by return, by amount made, or by the ability of someone to grind out a small profit for 30-40 years, solidly in the black but never making a fortune?" are great first questions. Regarding traders "failing," one should also consider a related data point: According to the BLS, the "average" baby boomer held 10.8 jobs from ages 18 to 42. 23 percent held 15+ jobs, and only 14% held fewer than 4 jobs. So, the "average" person changes jobs every 2 years. If one defines trading as a "job," then someone who does this, sitting in the same chair, for a long time is quite unusual compared with the population. see : http://www.bls.gov/nls/y79r22jobsbyedu.pdf
Kim Zussman comments:
No one can just walk onto a field and play pro ball. Likewise, no one can walk into an operating room and perform open heart surgery. However, must people can (assuming they are able-bodied and mentally capable) invest thousands of hours and achieve some reasonable level of proficiency in most activities.> My question is based on evidence like the article; supporting geneticaspects to behaviour, ability, gifts, and handicaps. Not everyone canbe trained to reasonable proficiency in the big leagues - and marketsare by definition among the biggest. Shouldn't traders ask themselves whether the reward/risk compensates the opportunity cost of thousands of hours of (potentially pointless)learning, if one may be (unknowingly) missing abilities needed toexceed results of buy and hold?
Peter C. Earle comments:
I am quite sure that this particular figure - 90%, sometimes shifted to 95%or even 99% - originated firmly in the late 1990s, when the SEC went afterthe SOES shops. They took, as their core example of the dangers, the exampleof one office of a particular firm which in a short amount of time morphedinto a general representation of the daytrading business (e.g., even the'prop shops' which were less focused on commissions than profitable trading)and was ultimately extended through word of mouth and the nascentblogosphere (e.g. message board jabbering) to cover any intraday tradingdone (online brokerage accounts, the occasional one day open/close, etc),and has since grasped the received wisdom of the collective mind at thispoint to an extent that it goes unquestioned. The fact is, the SOES traders/daytraders (as my man Lack will no doubtattest to) were mostly undercapitalized, out-of-work accountants andconstruction workers being sold 'maps to the gold mine', as it were. A better statistic, to start with, would be: with an $X account, after twelve months, how many remained?
Kim Zussman comments:
Interestingly, the author was as irrational as his subjects byfollowing the academic herd, making a low-risk, incorrect conclusion: "This study is especially relevant because of a concept called the"equity premium puzzle" that has long bemused financial experts. Theterm refers to the large number of individuals who prefer to invest inbonds rather than stocks, even though stocks have historicallyprovided a much higher rate of return. According to Shiv, there iswidespread evidence that when the stock market starts to decline,people shift their retirement savings—that is, their long-term, notshort-term, investments—from stocks to bonds. "Whereas all researchsuggests that, even after taking into account fluctuations in themarket, overall people are better off investing in stocks in the longterm," said Shiv. "Investors are not behaving in their own bestfinancial interest. Something is going on that can't be explainedlogically." This study, 2005, was in the middle of a decade where bondsout-performed stocks, and the irrationally risk-averse were punishedby missing out on ruin.
Feb
2
Volume, from Jim Sogi
February 2, 2010 | 2 Comments
Interesting drop in volume on today's up move in ES:
2010-02-01, 1896011
2010-01-29, 3068079
2010-01-28, 3052088
2010-01-27, 2634603
2010-01-26, 2449263
2010-01-25, 2080292
The old TA theory is that an up move on low volume is weak, and a down move on increasing volume is strong, but it doesn't prove out scientifically.
Sushil Kedia comments:
A homegrown theory I developed borrowing on the Chair's applications of the concept of struggle to markets interprets volume as a struggle for price discovery. Extending this with memetics, a higher volume indicating a higher struggle for price discovery meme implies an ongoing persistence of the meme. So, within any time frames or patterns or noise, if you perceive a meme then interpreting lower volume as lesser struggle tilting towards consonance and thus implying a fading meme comes by. This way of looking at price and volume relationships does lead to several testable ideas getting the gut feel closer to science.
Bill Rafter writes:
The only use we have found for volume is as a surrogate metric for volatility. Indeed S&P volume and VIX have very interesting relationships. However the standard TA mantras that (a) volume “confirms” price and (b) volume-weighting indicators makes them better, have not been confirmable.
Here is an excellent graphic I prepared relevant to volume.
Dr. Rafter is President of Mathematical Investment Decisions, a quantitative research consultancy
Kim Zussman writes:
Here's another check. SPY daily returns (c-c), with volume traded, 1993-present, were used to check for big up days = >+1% (0.01). Then calculated relative volume (RV) as:
(today's volume) / (average volume prior 5 days)
Then compared next day's return for two cases; if it followed a big up day which had low RV (RV<0.8) or a big up with high RV (RV>1.3):
t-Test: Two-Sample Assuming Equal Variances
low RV hi RV
Mean 0.0010 -0.0015
Variance 0.0002 0.0002
Observations 151 146
Pooled Variance 0.0002
Hypothesized Mean Difference 0.0000
df 295
t Stat 1.5263
P(T<=t) one-tail 0.0640
t Critical one-tail 1.6500
P(T<=t) two-tail 0.1280
t Critical two-tail 1.9680
Feb
1
The Forbidden Fruit: Technical Analysis, from Kim Zussman
February 1, 2010 | 1 Comment
SPY's Friday close was the second consecutive below the simple 100DMA, after a long period above the moving average.
Going back to 1993, checked for instances when SPY closed < 100DMA two consecutive days, following at least 20 consecutive closes > 100DMA. Here are the mean returns for the next 5d, 10d, and 20d:
One-Sample T: 5d, 10d, 20d
Test of mu = 0 vs not = 0
Variable N Mean StDev SE Mean 95% CI T P
5d 18 0.010 0.021 0.005 (-0.00057, 0.02114) 2.00 0.062
10d 18 0.007 0.023 0.005 (-0.00447, 0.01933) 1.32 0.205
20d 18 0.004 0.040 0.009 (-0.01570, 0.02430) 0.45 0.656
All up, if not significantly. If only it were that easy…
Jan
31
Nobody Asked Me, But… from Victor Niederhoffer
January 31, 2010 | 8 Comments
 The reaction to recent events where something devoutly to be wished actually happened and sadness and disappointment and revulsion occurs is part of a general syndrome related to the dissipation of the sex cells. Time and time again, a company reports good earnings above expectations and a terrible decline ensues. Time and time, an important link in the totality is confirmed a la Bernanke today, and the market drops an immediate 1%. Time and time, a bill that everbody wants, like the stimulus bill, or the Massachusetts election results, occurs, and the market drops an immediate 1% the way it did last Tuesday. What is the reason for this? Is it a variant of 'buy the rumor, sell the news', or is it insiders selling on the news? Or is it related to the general apathy that results when the discharge has occurred? Can it be predicted, and acted upon?
A friend writes in that the ensenble of comovements between bonds and stocks posted on our web site always reminds him of Leo Goodman's classic article "Movements and Comovements between M Dependent Time Series" that Doc Castaldo has kindly sent hundreds of copies out to far sighted researchers in previous glory days. It is good to honor and create a visual model and real life exampe of such important dependcies. And perhaps this will be a prelude to providing statistics on this site that will be at least as informative by half as the average sports statistics contained in such fine publications as The Post or Sporting News under "Stat City". The desire to provide a league standings tabulation is keen.
I am reading several books on animal partnerships and the partnership between the ostrich, which has good eyes, and the zebra, which has good hearing, reminds me of the partnership between many markets. One or the other, whether it's silver or the omniscient one, are there to alert to possible danger. One feels the pain of the CEOs who were at a dinner at the Oval last Wednesday, and learned about the Volcker plan only at 9 pm that night an hour after the dinner and just 12 hours before the 6% decline started. "That's not squash," as my friend from New Zealand used to say when I mixed in a volley or two. Heard at the Olympic Club at 10 pm: "You might want to play an all court game tomorrow, mate."
Of course there is a higher purpose to the recent decline of 6%. First the move must shake out all the weak longs who were buying it based on their hopes for the January baromoter. Next, it has to set all the public behind the form so that they will sell out in disgust at the three-month lows. Finally, it must engender a Dow below 10000 to create the kind of newspaper headlines and fear that will shake out the remaining weak longs before a rally occurs.
Paolo Pezzutti comments:
After you have finished your succulent second plate of spaghetti "all'amatriciana" and you are offered one more, can you eat it? After a long uptrend when earnings have beaten repeatedly expectations for a year, can you really expect more surprises? Some take profits, others go short. It seems that the news release is the trigger to execute actions that were long planned.
I found on CXOAG this post that addresses the issues raised: Earnings Surprises and Future Stock Market Returns. The post reports about the study Aggregate Market Reaction to Earnings Announcements.
The authors investigate the relationship between earnings announcement surprises and market returns on the days surrounding earnings news. The analysis identifies a negative relation between earnings news and market return that persists beyond the immediate announcement period, suggesting that market participants do not immediately fully impound these future market return implications of aggregate earnings news. There may be a considerable degree of inefficiency in the market’s processing of aggregate earnings information. Consistent with this interpretation they find that Treasury bond rates and implied future inflation expectations respond directly to earnings news.
George Parkanyi writes:
Definitely, the same type of news after a few months loses its power to move the market (true for both the down side and the up). At a certain point you stop listening, you’re on auto-pilot. Markets respond to surprises –- the something new, the something different, or the something possible. This is very much a human characteristic.
A related example was the Internet bubble. Everyone was buying the companies that had no earnings – because while they had no earnings the potential for earnings was unlimited. As soon as companies started to report any kind of a profit, they were crushed. For now someone had put a limitation on all that “potential”. I was highly amused at the time how earnings for an Internet company was the kiss of death.
Kim Zussman writes:
If it were as simple as "up on good news", Galleon and others trading on inside information would immediately overtake the solar system –like a hadron-collider black hole. This evidences supernatural laws which prevent even cheating determinists from commandeering supreme mating rights.
Years ago at a Stephen Hawking lecture on time travel, he "discussed" (the lecture spun from his laptop) various paradoxes produced if one could go back in time. For example, if you killed your parents in the past how could you have been born in the future to go back to kill them? One theory was that when you pulled the trigger, the bullet would "diffract"; somehow splitting before hitting it's target — in compliance with rules keeping the universe in logical order. (whose logic?)
Another theory was parallel universes — one in which your parents died, another they lived and you were allowed to develop.
The questioners were kind to Stephen, because of his illness, but after the show he sat helpless in his wheel-chair in a van outside with the dome light shining on his contorted face like an involuntary spot light. A crowd hovered outside to see the great man, like at the zoo.
On a different note, Pfizer's run-up to the Massachusetts Miracle is typical. Removal of near-certain health care reform and promised payoff by pharma met with big decline. Would you have sold knowing the election results before hand? The upside is that if you can be at peace with the way market treats your logic, you will understand how to be a ladies man.
Duncan Coker writes:
 I would like to pick up on Messr Parkanyi's comment regarding "the markets respond to surprises, something new, somthing different or the something possible…this is a human characteristic." I agree. Related to this, I attended a showing of the film Poliwood last night where the director Barry Levinson was there for a Q and A session. It is a documentary about the triangle of media, celebrity and politics and how the lines between reality and theater, entertainment and substance, are becoming more and more blurred. Politicians become celebrities and celebrities become politicians. Media fosters celebrity and celebrity feeds the media. Politicians need the media for promotion and the media needs them for content. One of the ways to get high ratings in news television is to present conflict in a dialogue. That is why guests are always at the extremes of a position. It allows for more yelling, arguing and better entertainment for the viewers. Polarization is more interesting television. Informed and moderate discussions is just boring to watch.
I wonder if this carries over into the market. Stagnant markets are boring, wild swings make for better entertainment. Also, who benefits from wilder markets, financial media has something to write about, brokers and exchanges have more commissions and fees, money managers can justify their services. It allows politicians something to regulate, gives floor trades movement to scalp, hedge funds can fire up the algorithms. The causality works in both directions as well. Last week the politicians spiced up the boring upward move of the past 2 weeks. When a fund is rumored to be weak or going under another spike. The media does all it can to create excitement and volatility around the market. When traders over-trade and the line between entertainment and substance can get blurred. Also, like the television example, conflict is more interesting. In the case of the bulls and bears it is most interesting at the extremes, so the market follow this type of cycle.
Ken Drees adds:
This fits here with financial television as of late. The big question or overall theme being is this just another dip for the market or something more? Hopefully capturing viewers by keeping this nail biting question front and center–having two view points and the ensuing debates roll on out.
Off the bottom it was "is this a sucker's rally or a setup for another drop?"; now its "is this just a little dip and the start of a sideways consolidation, or the start of a substantial 5 -10 % correction?"
It seems like these times of opposing question of market direction after extreme linear moves should be watched closely for reversal. I find it interesting that the choice not talked about much off the march low was this: Or is this the start of a nice 50% multi month rally from oversold conditions not witnessed since 2001?
Today the choice missing would be this: Or is this the start of a 50 to 70% drop, retracing most of the gains of 2009?
TV — usually it's what they don't say or its the opposite of what they scream into your face — making great TV but bad advice.
Jan
25
Payoff to Avoiding Both Up and Down Volatility, from Kim Zussman
January 25, 2010 | 1 Comment
(Caveat: easier said than done)
SPY monthly returns (1993-present, with div) were checked for a normalized proxy of intra-month range = (H-L)/C. The series was then ranked by range, along with corresponding monthly returns. These monthly returns were multiplied for the entire 17 year period, which gives a total return of 3.35 ($100 became $335). This was then repeated after successively skipping first the highest range month, then second, all the way to skipping the highest 100 range months. This allowed evaluation of the effect of being "out of market" on final compounded return - whether or not the high range months were up or down.
The graph below shows the effect. Cpd return is the green line, which rapidly increases by skipping (and investing in "cash" = multiplicative return of 1.00) the highest range several months, and continues to outperform B/H up to 100 months skipped. Range of skipped months is plotted in red; for scale on this graph multiplied X10 (eg, range of 0.34 shows as 3.4).
Here are the compound returns, successively skipping the top 20 range months, with dates:
Date ret H-L/C CPD
10/01/08 0.83 0.34 3.35
11/03/08 0.93 0.29 4.01
07/01/02 0.92 0.24 4.31
09/04/01 0.92 0.21 4.68
03/02/09 1.08 0.20 5.10
02/02/09 0.89 0.19 4.70
08/03/98 0.86 0.18 5.27
09/02/08 0.91 0.17 6.14
01/02/09 0.92 0.17 6.77
10/01/98 1.08 0.17 7.38
03/01/01 0.94 0.17 6.83
10/01/02 1.08 0.16 7.23
10/01/97 0.98 0.15 6.68
01/02/08 0.94 0.15 6.85
09/03/02 0.90 0.15 7.29
08/01/02 1.01 0.15 8.14
04/02/01 1.09 0.14 8.09
03/01/00 1.10 0.14 7.45
04/03/00 0.96 0.14 6.79
In fitting with decline = volatility, only 6/20 biggest range months were up.

Steve Ellison writes:
Using Dr. Zussman's results as a starting point, since I am not very good at determining the monthly range before the month begins, I checked what would happen if one skipped the month after a month with a high range. SPY total return including dividends from the end of 1993 to the end of 2009 was 3.14, for an average monthly return of 1.0060. If one held cash in all months following a month in the top 10% of ranges to date, and held SPY in all other months, total return would have been 1.98, with 140 months in the market and 52 months out. Average monthly return would have been 1.0049.
Since the end of August 2007, however, the average monthly return following a month with a range in the top 10% of historical values has been 0.9707, while the average monthly return of other months has been 0.9992. Thus, substantially all the losses of the last two years occurred in months following months of very high ranges.
Example:
90th
pctile
Month ending H-L/C H-L/C Position Return
9/30/2008 0.18 0.13 in 0.9058
10/31/2008 0.35 0.13 out 0.8349
11/28/2008 0.30 0.14 out 0.9303
12/31/2008 0.12 0.14 out 1.0098
1/30/2009 0.18 0.14 in 0.9179
2/27/2009 0.19 0.14 out 0.8925
3/31/2009 0.21 0.14 out 1.0833
4/30/2009 0.12 0.14 out 1.0993
5/29/2009 0.08 0.13 in 1.0585
6/30/2009 0.08 0.13 in 0.9993
7/31/2009 0.13 0.14 in 1.0746
8/31/2009 0.06 0.14 in 1.0370
9/30/2009 0.08 0.15 in 1.0354
10/30/2009 0.08 0.14 in 0.9809
11/30/2009 0.08 0.15 in 1.0615
12/31/2009 0.04 0.16 in 1.0191
Rocky Humbert asks:
Is this study and its results more than a reflection that (historically) a higher VIX → lower return?
Bill Rafter comments:
VIX is simply one form of volatility. It is logical to assume that some of the other forms may lead VIX, and that those may be causative and have predictive value. If they have predictive value for VIX and VIX is coincidental with declining equities, then you have something on which to build.
Dr. Rafter is President of Mathematical Investment Decisions, a quantitative research consultancy
Jan
20
The Sage of Omaha, from Jeff Watson
January 20, 2010 | 5 Comments
 The Sage of Omaha has always been on record of never splitting shares, giving a multitude of reasons, (which I personally agree with). That's one reason BRK.A is so expensive. Now, BRK wants to split their B shares 50 for 1. That's hypocrisy. It also might be a tell, but my crystal ball is a little cloudy these days. Buffett purportedly wants to greatly expand the investor base. This whole thing smells like something out of the play book of Vanderbilt or Gould.
Stefan Jovanovich writes:
The comparison might be with Merrill Lynch in the 1950s. "Throughout the bull market of the postwar period and the 1950s, Merrill Lynch continued to be an innovator and a popularizer of financial information. The firm erected a permanent Investment Information Center in Grand Central Station, distributed educational brochures, ran ads with titles like "What Everybody Ought to Know About This Stock and Bond Business," and even sponsored investment seminars for women. These new ideas made Merrill Lynch the best-known investment firm of the day. Charles Merrill's reputation soared to such heights that shortly before his death in 1956 one Wall Street historian referred to him as "the first authentically great man produced by the financial markets in 50 years." Berkshire is being structured to become the stock that all "good" people should own and keep forever.
Kim Zussman shares:
Jeff Watson adds:
In the 1800s, consuls and other forms of gilts were considered safe investments that all "good" people should hold forever.
Jan
14
Round Number Symbols, from Phil McDonnell
January 14, 2010 | Leave a Comment
 A recurring topic on this list is the study of market anomalies surrounding round numbers. Perhaps this idea can be extended to interesting ticker symbols. In the US ticker symbols are formed from letters and thus whether a symbol is 'round' or interesting is largely a subjective matter.
However in Hong Kong the symbols are numbers. So could there be an attraction to round numbered easy to remember symbols? A simple way to look at this is to take all the even hundred symbols and compare them to the Hang Seng index. The following study looked at 0100, 0200, … through 0900 but some symbols were not associated with a stock. Performance for the last twelve months was as follows:
Hang Seng +51.27%
Stocks with Round symbols
Avg. +172.61%
Std 108.77
t-stat 3.89
n 6
Kim zussman comments:
Round is Feng Shui, and Feng Shui is lucky.
Easan Katir writes:
It seems all too common that a number, whether a price, or an account value, approaches or touches a round number, then retreats slightly. Pure chance would suggest it would be over the round number or under equally, but it seems to be slightly under more often. Is this just my wishful thinking, or is there some corollary to Benford's Law?
Jan
14
My Checklist, from Victor Niederhoffer
January 14, 2010 | 8 Comments
 Checklists have been shown to reduce errors, improve accuracy, and increase profits in many fields. Most recently, a study in the New England Journal by Atul Gawande shows that use of a 19 point check by surgeons could reduce deaths by 30% and save billions. Such simple things as knowing all the names of your colleagues and being sure that an adequate supply of blood and respiratory equipment is available are useful.
When it was suggested to me that a checklist for my own trading might be useful, I originally had the same reaction as the doctors. "I've flown with the eagles, climbed the highest mountain, captured the mountain lion, been a member of all the exchanges, played 12,000 refereed matches, went to Harvard." But then I read the reaction of the Drs. "I'm from Harvard. I don't need such a list. But if I was operated on, I'd like such a list."
Here's a list I came up with for the forgotten man, the hundreds of thousands of traders in stocks, futures and options.
Before the Trade
1. Do you know the name and numbers of all your counterparts, especially if your equipment breaks down?
2. When does your market close, especially on holidays?
3. Do you have all the equipment you'll need to make the trade, including pens, computers, notebooks, order slips, in the normal course and in the event of a breakdown?
4. Did you write down your trade and check it to see for example that you didn't enter 400 contracts instead of the four that you meant to trade?
5. Why did you get into the trade?
6. Did you do a workout?
7. Was it statistically significant taking into account multiple comparisons and lookbacks?
8. Is there a prospective relation between statistical significance and predictivity?
9. Did you consider everchanging cycles?
10. And if you deigned to do a workout the way all turf handicappers do, did you take into account the within-day variability of prices, especially how this might affect your margin and being stopped out by your broker?
11. If a trade is based on information, was the information known to others before you?
12. Was there enough time for the market to adjust to that information?
13. What's your entry and exit point?
14. Are you going to use market, limit or stop orders?
15. If you don't get a fill how far will you go? And what is your quantity if you get filled on all your limits?
16. How much vig will you be paying if you use market or limit orders and how does that affect the workouts you did knowing that if you use stops you are likely to get the worst price of the day and all your workouts will be worthless because they didn't take into account the changing price action when you use stops, to say nothing of everchanging cycles?
17. Are you sure your equipment is as good and as fast as the big firms that take out 100 million a day with equipment that takes into account the difference between being 100 yards away from an exchange and the time it takes the speed of light to reach you?
18. Are you going to exit at a time or based on a goal? And did you take into account what Jack Aubrey always did which is to have an escape route in case all else fails?
19. What important announcements are scheduled? and how does this affect when and what kind of order to use? For example, a limit before employment is likely to be down a percent or two in a second. Or else you won't get filled and you'll be chasing it all day.
20. Did you test how to change your size and types of orders based on announcements?
21. What's the money management on this trade?
22. Are you in over your head?
23. Did you consider the changing margin requirements when the market gets testy or the rules committee with a position against you increases the margins against you?
24. How will a decline in price affect your margin and did you take into account what will happen when you get stopped out because of margin?
25. What will happen if you need some money for living expense or family matters during the trade? Or if you have to buy a house or lend money to a friend?
During and After the Trade
1. What's your game plan if it goes against you and threatens your survival?
2. Will you be able to get out? Did you take that into account in your workout?
3. More typically, what will you do if it goes way against you and then meanders back to give you a breakeven? Or if it immediately goes for you or aginst you?
4. Would you be willing to take a ½% profit if you get it in the first 10 minutes?
5. Did you test whether taking small opportunistic profits turns a winning system into a bad one?
6. How will unexpected cardinal events affect you like the "regrettably," or the pre-annnouncement of something you expected for the next open? And what happens if you're trading an individual stock and the market goes up or down a few percent during the day, or what's the impact of a related move in oil or interest rates?
7. Are you sure that you have to monitor the trade during the day? If you're using stops, then you probably don't have to but then your position size would have to be reduced so much that your chances of a reasonable profit taking account of vig are close to zero. If you're using 10% of your capital on a trade, they you'll have to monitor it for survival. But, but, but. Are you sure you won't be called away by phone calls, or the others?
8. Are you at equilibrium in your personal life? You're not as talented as Tiger Woods, and you probably won't be able to handle distressed calls for money or leaks on the home front. Are you sure that if you're losing you won't get hit on the head with a 7-iron, or berated until you have to give up at the worst possible time?
9. After the trade did you learn anything from the trade?
10. Are you organized sufficiently to have a record of all your trades for your accounting and learning?
11. Should you modify your existing systems based on it?
12. How does recency and frequency and value affect your future?
13. Did you fit your after activities to your mojo?
14. If you made a good profit, did you take some capital out of the fray for a rainy day?
15. Have you learned to say "fair" whenevever anyone asks you how you're doing and are you sure that you don't spend a fortune after a good trade, and dissipate your profits with non-economic activities?
16. Is there a better use for your time than monitoring the ticks or the market every minute of the day if you do, and if you don't, do those who do so and have much faster and better equipment than you have an insurmountable advantage against you?
Well, specs, that's what I come up with off the top. How would you improve or augment it?
Nick White comments:
If a position begins moving against beyond what was anticipated in the workout can one, through either contacts or acquired counting skills, figure out as fast as possible why the move against is occurring? With that information, can one then discern whether or not such a move needs to be heeded, faded, or left alone?
What legitimate information sources can one leverage to better understand a particular trade? A buddy who is a floor trader, a mentor, a high ranking friend of a friend in a central bank?
Are one's current skills commensurate with one's trading goals and ideas? Perhaps, more importantly, are one's trading skills of the same league and caliber as those one is competing gainst in a particular market? If not, surely best to wait and keep capital safe until one is sure of one's edge. This strongly accords with Chair's admonition to never get in over one's head, and to not spend inordinate amounts of time watching each tick when that time could be more profitably invested in training and developing new and existing skills — counting, programming, etc.
Make the strongest effort possible to find out whether the tail wags the dog in a particular instrument that you're trading. If it turns out that it does, does it happen with significance at a particular time, such as expiry? Or after a particular event? Can it be exploited after costs or is it better to fade it after the fact?
If one asks these questions and takes note of them in the essential lab notebook that ought to be at one's fingertips during all trading and researching activities, have those questions subsequently been answered by oneself? I have found this to be the most fertile soil for developing new insights and ideas. If you observe it, note it and question it — hypothesize about it and answer it.
Alston Mabry comments:
Here's one: Don't fool/confuse/tire yourself by making your execution more precise than your analysis. If your target is 2% within the next five trading days, then chasing two bps on the entry isn't going to make or break the trade.
Easan Katir adds:
- If you trade odd hours, get enough sleep and appropriate caffeine dosage.
- One well-known S&P pit trader advised two bowel movements in the morning before setting foot on the floor.
- Start the day with a centering routine — affirmations and goals. Remind oneself of one's larger purpose.
- List important times and dates on an online calendar with appropriate alerts: government numbers, earnings, ex-dividend dates.
- Rehearse successful behaviors and outcomes. And disaster recovery.
- Minimize other life stressors: long commutes, family arguments, risky vices, debt.
- Test backup equipment and systems regularly. I test my diesel backup power generator weekly.
Victor Niederhoffer responds:
I would add a small point. Trading foreign markets always seems much more difficult than domestic ones. For one, you never know what the important announcements are. For two, you get killed on the spread on your foreign exchange prices. For three, it seems to be 100 times more time-consuming to get into the queue than even the 1/100 of a second that's enough to give the domestic high frequency traders an insurmountable edge on you. For four, you have to go without sleep for at least one night, and then on the second night when you can't stay up the required 48 hours without sleep the move you expected and closed out is sure to happen.
Alan Millhone writes:
Checker master Tom Wiswell said to always keep the draw (escape) in sight.
Scott Brooks adds:
I have to disagree with Easan on the caffeine. I know there are many people that have to have their morning cup(s) of coffee to get their day going, and without it, don't feel/function right.
I do not want to go through life being so dependent on something that I have to have it to make myself feel right, let alone function right. I know this will be anathema to most (everyone?) that reads this, but I have to say it.
When I removed the caffeine addiction from my life (and don't fool yourself, it is an addiction…..if you have to have it everyday and then quit it, you will go through withdrawals……it is an addiction), my life changed so much for the better. I can think clearly. I can process information more quickly, and I can see solutions with greater clarity.
And your sleep will improve immensely. I suffered from severe insomnia for years. Kicking caffeine out of my life has lead to my being able to fall asleep, usually within minutes and being able to get up earlier and feel more refreshed!
You will find a level of "mental processing" that you never thought possible when you replace coffee and caffeine with purified water (I drink around a gallon a day) and a glass or two day of the organic juice of your choice.
But be prepared, you will likely have around two weeks of headaches when you go through caffeine withdrawals (you know, from the caffeine that you're not addicted too).
Nick White agrees:
Ditching caffeine is a good move. Best to save it for when may really need it on an overnight (or two) session. As mentioned in the past, Dr. Shinya is fervently anti-caffeine. Like many others, I found Dr. Shinya's principles promoted many positive health benefits for my wife and me.
On that note, i find that the Shinya nutritional principles — when moderated by the ideas behind the paleo diet — are a real winner; the increased "good" protein from the Paleo program does much to mitigate weight gain from increased carbohydrate consumption when kicking off on the Shinya program. There is a Paleo program for those involved in elite endurance sports.
George Parkanyi writes:
On any project or major activity, the first question I ask is how much time I have. That frames everything that is to come.
The very next thing is to build a contact list with names, phone numbers (backup phone numbers) and email addresses (and account numbers and passwords). This is also true in Scouts, where we need to have that information at our fingertips for safety reasons — in fact for every camp we have to draft an emergency plan — police, hospitals, parents, primary first aid responsibilities, etc. In a trading operation this is critical. If you have key support resources who have to act on your behalf at a moment's notice, then they need to be available, you need to able to access them, and if not, there must be a ready backup contact and plan B, even C. Chair's point about having a pen available can even be a critical detail — what if, in the heat of battle, you have to write down, say, a wire transfer number? In my case, reading glasses would be another.
Kim Zussman comments:
As a periodontal surgeon, I have found it much easier to stay composed and rational during difficult surgery than unruly trades. Chair's excellent list hints at why, in the form of the question "how do you know?".
Surgical complications follow rules of biology, and mistakes usually come when overlooking something or miscalculating the compounded risk of several factors. One can and should practice with a large margin of safety, which in almost every case is easy to determine. Biology is almost immutable, but markets morph wildly in real-time. It is very difficult to stick with a position if you are honest about your cluelessness and unwilling to go down with the ship. When the trade goes bad:
1. What was your hypothesis? How many others had your idea too? Or the opposite one? Are they right? What do they know that you don't? What is the source of your confidence that you can out-smart (or out-run) the million-mind-march?
2. Did you test properly beforehand? Did you miss something; a signal from another market, a subtle backdrop to your traded market? What is the chance this time is different, and should this doubt change your mental stop?
3. How heavily is your market being manipulated? By government? Big banks? Goldman's trading desk? Does persistent manipulation / insider trading change your hypothesis or render hypothesis formation useless?
4. How do you know whether the move is merely noise of your correct hypothesis, or part of a regime change you have not noticed?
5. Deep and abiding doubt is essential to science, but how do you incorporate doubt into market prediction when most of the movement is random?
6. Does the non-linear, mostly random reward system of trading corrupt your judgment (sleep, personal life, etc)? Do some people lead a happy, well-rested life with long periods of gut-wrenching loss alternating with gain, and are you one of them?
7. What unalterable beliefs are necessary to trade successfully? If you hold them, are you sure they are the right ones? Should some beliefs be discarded as a result of a changing world? Are there new ones you should know, and are you confident you will see them when they develop?
Steve Ellison adds:
Margin of safety is a key concept in many fields. While skiing, I put on the brakes a bit earlier than I absolutely must so that if I miss my footing or hit a patch of ice, I have another chance to avoid the hazard (e.g., other skier, tree, out of control speed). Graham and Dodd wrote about margin of safety in investing. Rather than buy a stock that is below book value, a value investor might wait for an opportunity to buy a stock below 80% of book value.
If I ski 10 times a year, even on the same mountain I am likely to encounter 10 different sets of conditions — temperature, wind, length of time since last snowfall, etc. One day last year, the fog was so thick I could not see the trees on either side of the trail. Some conditions dictate caution; others are more forgiving and allow me to be more aggressive. A warmup run is an excellent way to get a feel for conditions.
Nigel Davies proposes:
Checklists are very good whilst learning, but I believe that one should ultimately aspire to be able to do without them because everything has been internalised. In my own field I tend to believe that conscious thought of any kind can be a distraction, which is why I don't like the old Blumenfeld Rule (a checklist used before playing a move).
Ken Drees writes:
I just did an experiment with my son with one of his Christmas presents, an electronic learning kit. We have learned so far the basics of how electricity works. Resistors (series and parallel), Capacitors, etc. Each lesson has a page explaining the experiment, a schematic, a drawing of the circuit in relationship to how water moves through pipes — the water analogy for electrical flow resonates with my son. And each experiment has an electronic "wiring checklist'.
The checklist comes in handy since its easy to forget a connection, misrun a wire, or leave an extra connection from a previous experiment in the lab circuit.
I associate checklists with "must have"–high accuracy functions. Like programming, wiring, piloting, fixing a car, cooking –its all routine, but items can be omitted, done wrong and can be forgotten due to human error. The checklist is a tool, an aide that removes ego from the scenario. Used in trading it helps set the trade up, helps initiate or close the trade, and removes emotion from what needs to be done automatically. A checklist in the grey area of a trade like the middle game in chess, or an operation where the patient is being worked on really doesn't help much–you need to make gut-inferred decisions, unless your trade is so automated that you remove yourself from the trade entirely and rely upon a program.
Using trading checklists help bring focus and energy towards the trading exercise. Using checklists of some sort during the "live–life of its own phase of the trade" must be explored further. Maybe there are ways to check off your decisions, check your options, use your skills with the pressure of time taken into consideration–during this live phase.
But when your hand is on a hot stove, trade going wrong, does one need to look at a post-it-note do determine if one should remove hand from stovetop?
FYI: a 9 year old boy is understanding electricity –public school may teach a child these ideas in 7th grade. I am amazed at what can be taught to children that most think is way over their heads.
Alan Millhone adds his two cents:
I will add my two cents. Some years ago I bought an International dump truck and it has air brakes. My late father and myself drove it for use in our construction projects. Because it has air brakes you need your class B driver's license to be legal. We drove it several years without the proper license. Finally my father got the book and studied and took the written part for class B. After he took that part he gave me the book and I studied and took the test and passed. Quite a book to study.
Now the second part was an over the road test with the instructor in the truck with each of us. He said he had never given a back to back test to a father and son. Dad and myself had to back the truck then drive to the right close as we could to an orange cone– without touching the cone. Then each of us had to do a 50 point check list of our truck that we earned (I still remember the list ) and still check my truck before taking it onto the road. So checklists are valuable in many applications ranging from dump trucks to the Market.
On a side note, dad and I rode to the test center in our dump truck without the proper license. The instructor said he was not going to ask how we got there.
David Brooks comments:
All very good ideas. I wish there were some good way to test Atul's theory historically. Why? Because I am convinced that poorer outcomes in the last decade come from fragmentation of the system - shift work, decreased work-hours by house staff, the high volume being forced through the system and de-professionalation of nurses.
Alas, we can't measure the past, but I am convinced that the hospital I started in (The Peter Bent Brigham of the early to mid 70's) was a safer, more humane place with better (allowing for technological changes) outcomes.
All the same, the reason we have embraced checklists a la airlines has to do more with the aeronautical outcomes than medical outcomes. The amount of information that a pilot has to process is order of magnitudes more than what a surgeon has to process. Furthermore, when a pilot fails completely 300 lives are lost, and when a surgeon completely fails, 1 life is lost. The former is far more dramatic, of course.
It's nice to know the anesthesiologist's and scrub tech's name, but it's hard to believe that that is going to affect the outcome of a significant number of operations.
That said, I have the greatest admiration for Atul. He sits a short distance from me, and I am proud to have had even a small role in training him. He is a remarkable young man and we will being hearing from him for many years to come.
Newton Linchen comments:
Once I took an airplane pilot course, and I was amazed how everything was done with checklists. Actually, the first time I heard the word 'checklist' was there. (Even here in Brazil they keep all the terminology in English, for standard procedure). I realized how checklists can keep you out of trouble and save your life. In markets, perhaps a great deal of losses could be avoided if I followed my own trading checklists.
Russ Sears writes:
Checklists can be very useful in an emergency. I have found that a simple checklist was valuable in a race. When the going gets tough it is easy to panic. The list It went something like this 1. relax 2. pump the arms smoothly 3. breath in normal rhythm (One hard puff out, relax in). It is easy to panic on the edge of your limits. These 3 things are the first signs that you are starting to panicking, subconsciously without knowing it.
Runner, use checklist often as part of their diary. Each day you check your weight, evaluate your nights sleep and your overall mental state. You check your diet and fluid intake .
Before a race you follow your pre-race checklist from what to pack, to when and what to eat, and when and how you should be warming-up and stretching.
Then after the race you check how well you followed the plan, where the plan worked and where if failed.
Finally at the end of the year you check the philosophical underpinnings of your training. Your goals, why you are doing it all, what are the cost that you are willing pay and what is the best path to get there.
So checklist have there place, but you need to 1. put them in the right point of time in the process, 2. not let them lose their relevance and meaning . 3. keep them simple at critical points, simple enough that they are potent.
Easan Katir adds:
Thinking about checklists, and watching the Haiti disaster coverage, made me think about a checklist for emergencies. Then thought about a list of the various types of emergencies one might encounter, big and small. What came to mind:
earthquake
tsunami
meteor
fire
invasion
home invasion
looting
mistaken id
false accusation
suit
accident
disability
death
audit
missing person
interment
currency replacement/devaluation
market crash
partner deceit
embezzlement
power outage
plague
pandemic
mugging
i suppose each needs its own checklist, though some may overlap. What did I miss?
Scott Brooks adds:
The best checklist you can have is to either be a great leader or be around a great leader.
It's been my experience that average and ordinary people need checklists (which they rarely if ever have or use…which is one of the reasons why they are average and ordinary), but smart people with leadership skills don't need a checklist when it comes time for a disaster.
Most disasters/problems rarely follow a fixed pattern. It takes a leader who is capable of thinking on his/her feet who can stand up, take charge and direct people as to what they need to do.
And this doesn't have to be right all the time, he just needs to make decisions and get people moving and be willing to take responsibility and shrug of criticism of the naysayers…..while listening to them to extract the wisdom that might be contained in their "naying" (I think I have just made up a word).
A leader has to have insight and the ability to see several moves ahead. A leader has to be able to see correlations and connections between seemingly disparate pieces of information.
A leader has to then take this data and formulate a solution and then direct people to execute the solution….and if possible, get people to see the vision of the completed project so that they can begin to work towards that goal with minimal supervision.
But most importantly, a leader has to be willing to make a decision when it comes time to make a decision even when the solution is not apparent. A course of action that fails is better than inaction that is guaranteed to fail.
Jan
12
Picking Movies & Picking Stocks, from Rocky Humbert
January 12, 2010 | 3 Comments
 At a recent sleep-over party, my teenage daughter and her friends selected a movie for after-dinner entertainment. The FIOS Movie-on-Demand catalogue had over 16,000 titles, (including new releases) yet the kids selected the old classic, The Wizard of Oz, which they had all viewed previously.
There was no debate, and the decision seemed reflexive; a cultural Rorschach test of sorts. Was their selection rational and utility-maximizing? Or was it an illustration of biases found in behavioral finance literature? What other interpretation(s) can be made about this unexpected choice?
An investor looking for a stock pick faces "only" about 6,000 possible choices. If one is not a quant (screening for factors) — doesn't a similar subconscious decision-making occur? Is this Peter Lynch's "buy what you know?" Or are investment choices irrationally influenced by cultural and/or subliminal factors and/or groupthink?
Keynes' Beauty Contest analogy notwithstanding, an overview of the construction of a stock-picker's Rorschach Test might be a useful first step in identifying one's own subliminal biases…
Tom Marks writes:
Rocky raises interesting questions, but a group of teenage girls selecting a movie is very different from
1. a group of teenage boys selecting a movie (in which the emphasis is likely to be less on consensus building, and more on establishing authority, status), or
2. a single teenage girl selecting a movie (in which she is not subject to the perils of groupthink), or
3. a single teenage girl selecting something where some serious stakes (i.e., risks) were involved (say, in the selecting of a prom dress, or to which college she wished to apply early-decision).
Kim Zussman comments:
Keynes may have got it wrong for a change: stock picking should not be judging what the consensus thinks is beauty, because that is already priced. Stock picking is more like a prospective beauty contest between the teenage girls, and mimics what "seriously" dating boys should be doing — correctly predicting which one will be most beautiful (in all ways) as a grown woman.
Of course most boys that age are day-trading, and not looking at long-term investments. Whether heavily traded girls will ultimately be shown as value or growth is an exercise left to single readers.
Jan
6
Welcome to Orwell’s World 2010, from Kim Zussman
January 6, 2010 | 2 Comments
 Smash hit Cameron film "Avatar" fits well with current Laureate apologia:
"John Podhoretz, writing a critique for the Weekly Standard, goes so far as to call the movie "anti-American."
"The conclusion does ask the audience to root for the defeat of American soldiers at the hands of an insurgency. So it is a deep expression of anti-Americanism-kind of," Podhoretz writes." (ABC news)
Not surprisingly the film is setting records in Russia, where the mafiacracy foments resentment against the US imperialist military-industrial complex. Expect louder cheering from those quarters as we become layered with increasing taxes, bureaucracy, and official corruption, evening the playing field.
Janice Dorn writes;
In 1984, George Orwell described a superstate called Oceania, whose language of war inverted lies that "passed into history and became truth. 'Who controls the past', ran the Party slogan, 'controls the future: who controls the present controls the past'."
Barack Obama is the leader of a contemporary Oceania. In two speeches at the close of the decade, the Nobel Peace Prize winner affirmed that peace was no longer peace, but rather a permanent war that "extends well beyond Afghanistan and Pakistan" to "disorderly regions and diffuse enemies". He called this "global security" and invited our gratitude. To the people of Afghanistan, which America has invaded and occupied, he said wittily: "We have no interest in occupying your country."In Oceania, truth and lies are indivisible.
Stefan Jovanovich comments:
I don't think Orwell would have agreed with Dr. Dorn. He wrote 1984 after working for the BBC during WW II when private letters were read by government censors; food, petrol and housing were all under government control; the currency had, within very recent memory, ceased to be exchangeable for gold; And –most important of all– all the citizens of a common law state were subject to impressment at will. That is hardly the situation now.
Measured by Orwell's standards, the glorious good old days of the 1960s were a great deal closer to 1984. The Tet offensive debacle of the NVA was a "success" because Walter Cronkite said it was; the New York Times knew best; and we had a draft. Over the past half century the tyrannies of academia have become far worse, and the civil servant class has expanded to the point that the U.S. and Europe are now equally oppressed by bureaucracies and airport security is truly a tyranny invented by the telephone sanitizers; but freedom of thought has never been greater. It becomes less and less possible to say "everybody knows".
As for perpetual war, there has been one going on in Africa for the past decade and a half. No one has done a census of the casualties, just as no one did a census of the deaths from Mao's Great Leap Forward or Stalin's rationalization of Soviet agriculture, but reasonable people agree that the scale of all 3 atrocities is comparable - somewhere between 15 and 30 million deaths beyond what would have occurred from normal aging and disease and ordinary mayhem. Thank God that perpetual war, which surely dwarfs our own petty struggles against Islamofascists, is coming to an end. Those who decline to believe in Almighty Providence can attribute the onset of peace to other causes: simple exhaustion and the decline in the supply of Kalashnikovs and other implements of less than mass destruction. Whatever the cause, someone much closer to peace has broken out in Africa. In the world of Oceania that would not have been allowed.
Jan
5
No One Asked Me, But…, from Victor Niederhoffer
January 5, 2010 | 3 Comments
 No one asked me but the relative movement of the S&P and bonds this year of -40 percentage points, +22% for stocks and -18% for bonds, appears to be the second greatest divergence in favor of stocks in history by a long shot, rivaled only by 1999 when stocks were up 17% and bonds down 30%. 2000 was not a good year for stocks. And the Fed Model has worsened considerably to say the least.
The Call of the Wild by Jack London is full of market insight. London starts out by pointing out that Buck was kidnapped because the workman relied too much on a system and all systems end up going broke and leading to such things as kidnapping. He also says that a miner's trial was held for Buck when he defended his master and ripped the throat of a drunk bum who threatened the master. One would like to hold a miner's trial for those who profited from the forgotten man's contributions to their wherewithals in recent times, and others seem to share the sentiment.
The problems of musical notation on computers are similar to the problems of using computers to predict market movements. It is twice as fast as hand notation apparently. the musicals no longer can show a few persons singing and get the audience to suspend disbelief so they have to make fun of the singers these days. When will the market people suspend disbelief in the ability of the earmarks?
The scholarly market starts the year in fine fashion up 1% to 1080, a 15 month high, within 5% of an all time high, thus leading the way. The respect that the chair of the Central Bank there receives should be captured in a story by Sholem Aleichem and be followed by all who wish to see the likely course of interest rate policy around the world.
The energy stocks have performed the best over the last 10 years. Insights concerning their likely future performance will be gained by watching the subsequent scoring figures of Nate Robinson of the Knicks after his 45 points last Tuesday. A reading of Statistics on the Table by Steve Stigler is always helpful in this regard also.
Kim Zussman adds:
I ran yearly change of TNX (10y rate) and SPX, 1962-present, and when ranked by chg TNX found 2009 and 2008 were at the extremes of the series:
The top 5 are biggest yearly increase TNX (and same-year chg SPX), and the bottom 5 are biggest yearly drops in TNX:
chg chg
year TNX SPX
2009 0.71 0.23
1999 0.39 0.20
1994 0.35 -0.02
1969 0.28 -0.11
1967 0.23 0.20
1985 -0.22 0.26
2002 -0.24 -0.23
1982 -0.26 0.15
1995 -0.29 0.34
2008 -0.44 -0.38
Stands to reason that an outliar (sic) year is followed by another.
Jan
1
Price Discovery in the Used Vehicle, from Jeff Watson
January 1, 2010 | 1 Comment
 I've noticed that every time I have sold a car, the dealer told me how flooded the market is with my make and model, and that the prices are much lower than I would expect. I take the dealer's words with a grain of salt, but am still not going to beat him in his own market. The equities and futures markets are much the same (and although this is anecdotal), it seems whenever I need to pitch out a position, there is a lot of whatever I own offered for sale at that moment. Conversely, whenever I wish to buy something, there is never enough around. I usually end up paying too much and selling too cheap.
Jeff Watson, surfer, speculator, poker player and art connoisseur, blogs as MasterOfTheUniverse.
Bill Egan writes:
You need a new van. A large one. By the end of February.
Ford E-350 Super Duty 12-passenger vans look good.
Prices for 2009 models
new MSRP: $36,325
new Invoice: $32,184
new Edmund's "What Others are Paying": $30,459
Yuck
Edmunds used retail price: $25,808
Kelley Blue Book used retail price: $24,710
Better
What is the distribution of true prices? Attached is the histogram of prices of 168 used 2009 Ford E-350 vans listed on cars.com within 500 miles of my house. Yes, the same basic vehicle is selling for $16,477 to $32,995. This took about ten minutes for me to make. (Yes, some options did vary, and there were a few misclassified vehicles, but overall this is really useful)
It is even faster to look at the most useful percentiles. Just sort by price on cars.com. Then go to the last page to get the total number of vehicles that actually have a price. In this case there were 168 vans with prices. Scrolling through the four web pages and quickly counting allows you to figure out the percentiles. For example, the midpoint or median is at the 84th van (168/2). That price is $21,495. The 25th percentile is at the 42nd van (168/4) priced at $19,998.
Used list price at the closest Ford dealer: $21,695 (just over 50th percentile)
Used "best price" at closest Ford dealer after we had a chat about other dealers' prices: $19,495 (18th percentile).
For a fleet vehicle manufactured in March, 2009, auctioned in October, 2009, clean CarFax, with 13,200 miles and almost all the options.
Kim Zussman replies:
Don't you think the distribution of prices attributes less to mispricing than +/- valuation factors estimated by sellers — mileage, condition, options? They ought to know the going prices, and attempt to price theirs competitively modified by their knowledge of condition.
As with romance, if condition is held constant then price should vary based on ignorance and desperation.
Gordon Haave writes:
Car selling is all about one thing: price discrimination. The good salespeople do one thing: size up the maximum that you are willing to pay and make sure that is how much you pay. They do this through a number of techniques but most notably the questions about what you do for a living, how much your current car payment is, etc.
All the confusion around pricing and monthly payments and such is just to give them wiggle room to be able to charge you the most you are willing to pay.
Alan Millhone adds:
I pass a used car lot daily in Belpre and have been noticing the strategy this fellow uses to push his lot vehicles. He calls 89,000 miles LOW mileage ! One car he lists on window as a LOCALLY owned car — So? Occasionally he puts a HOLD sign on the windshield — who cares? Across the street is a strip plaza that a man owns that I know. On the front that is not used you can set your vehicle or boat or trailer and pay him 20.00 a month for that parking spot. Lots of traffic flows by each day. You list details on your vehicle and make your own deal. One new car dealer of KIA has his own clunker program and will give you 5,000.00 on your trade. My best friend traded in his car and a van he had towed in and the dealer allowed him 4,000.00 each towards a new KIA auto. I note gas in my area creeping up again so the economy cars are selling well.
Dec
31
A New Base of Operations for Sam Eisenstadt? from John Bollinger
December 31, 2009 | 2 Comments
Here is his most recent article:
An above average 2010, from Sam Eisenstadt
Perhaps now that he has left Value Line we'll learn a bit about what really went on with that ranking system?
Kim Zussman replies:
Similar results [to what Sam Eisenstadt reported regarding "rally from recession lows"] when isolating on major declines in DJIA (1929-09, weekly closes), defined as:
This weeks close = low for prior and future 20 weeks (major low) + This weeks close = low for prior 255 weeks (5 year low)
Using this definition, here is the size of the decline (from max prior 5 years to the major low), return next 40 weeks, and return for 20 weeks following the first 40:
Date decline nxt 40W nnxt 20W
03/02/09 -0.53 0.59 ?
09/30/02 -0.36 0.22 0.12
12/02/74 -0.45 0.41 0.21
05/18/70 -0.33 0.38 -0.07
04/20/42 -0.50 0.35 0.14
07/05/32 -0.89 0.99 0.15
11/11/29 -0.40 0.05 -0.30
Four out of 6 subsequent 20W returns were positive, with the notable exception of 1929 (whose repetition has been ruled out through close study by the current Fed Chair).
Phil McDonnell writes:
What went wrong with the rankings? Gaming may be part of the answer. Sam Eisenstadt clearly did not know the answer when I asked him a few years ago. In my opinion, the SEC has the best theory but they let the 'monsters' off easily with only a fine and no admission of wrongdoing. According to the SEC they were funneling money off to an in-house brokerage, in effect skimming the investors.
Dr. McDonnell is the author of Optimal Portfolio Modeling, Wiley, 2008
Sam Eisenstadt replies:
I hope Phil is not implying that I was somehow involved in the SEC case against Value Line. Nowhere in the SEC charges am I mentioned, nor was I aware of the goings-on in the brokerage area. As far as Jim is concerned, I recognize that he has never been a fan of the Value Line Ranking System, even when it was performing well from the late 1960s into the late 1990s. I would recommend he read Fischer Black's "Yes Virginia, There is Hope — Tests of the Value Line Ranking System. " In recent years, the system had problems as "earnings growth," (the major component in the system) was deemphasized in favor of "value" factors. The Niederhoffer Theory of Changing Cycles. Perhaps we're approaching another change, in which event we may not hear from Jim for a while.
Victor Niederhoffer explains:
What everyone associated with, or knowing of, Sam Eisenstadt, certainly all contributors here and those associated with me, has thought about this issue is that Sam is just the finest gentleman anyone has ever had the pleasure of meeting. A beacon of light in our industry. The Osborne of fundamentals. The Balder of our field. What a joy to have him swinging and gliding again unfettered from the River Styx.
« go back — keep looking »Archives
- July 2026
- June 2026
- May 2026
- April 2026
- March 2026
- February 2026
- January 2026
- December 2025
- November 2025
- October 2025
- September 2025
- August 2025
- July 2025
- June 2025
- May 2025
- April 2025
- March 2025
- February 2025
- January 2025
- December 2024
- November 2024
- October 2024
- September 2024
- August 2024
- July 2024
- June 2024
- May 2024
- April 2024
- March 2024
- February 2024
- January 2024
- December 2023
- November 2023
- October 2023
- September 2023
- August 2023
- July 2023
- June 2023
- May 2023
- April 2023
- March 2023
- February 2023
- January 2023
- December 2022
- November 2022
- October 2022
- September 2022
- August 2022
- July 2022
- June 2022
- May 2022
- April 2022
- March 2022
- February 2022
- January 2022
- December 2021
- November 2021
- October 2021
- September 2021
- August 2021
- July 2021
- June 2021
- May 2021
- April 2021
- March 2021
- February 2021
- January 2021
- December 2020
- November 2020
- October 2020
- September 2020
- August 2020
- July 2020
- June 2020
- May 2020
- April 2020
- March 2020
- February 2020
- January 2020
- December 2019
- November 2019
- October 2019
- September 2019
- August 2019
- July 2019
- June 2019
- May 2019
- April 2019
- March 2019
- February 2019
- January 2019
- December 2018
- November 2018
- October 2018
- September 2018
- August 2018
- July 2018
- June 2018
- May 2018
- April 2018
- March 2018
- February 2018
- January 2018
- December 2017
- November 2017
- October 2017
- September 2017
- August 2017
- July 2017
- June 2017
- May 2017
- April 2017
- March 2017
- February 2017
- January 2017
- December 2016
- November 2016
- October 2016
- September 2016
- August 2016
- July 2016
- June 2016
- May 2016
- April 2016
- March 2016
- February 2016
- January 2016
- December 2015
- November 2015
- October 2015
- September 2015
- August 2015
- July 2015
- June 2015
- May 2015
- April 2015
- March 2015
- February 2015
- January 2015
- December 2014
- November 2014
- October 2014
- September 2014
- August 2014
- July 2014
- June 2014
- May 2014
- April 2014
- March 2014
- February 2014
- January 2014
- December 2013
- November 2013
- October 2013
- September 2013
- August 2013
- July 2013
- June 2013
- May 2013
- April 2013
- March 2013
- February 2013
- January 2013
- December 2012
- November 2012
- October 2012
- September 2012
- August 2012
- July 2012
- June 2012
- May 2012
- April 2012
- March 2012
- February 2012
- January 2012
- December 2011
- November 2011
- October 2011
- September 2011
- August 2011
- July 2011
- June 2011
- May 2011
- April 2011
- March 2011
- February 2011
- January 2011
- December 2010
- November 2010
- October 2010
- September 2010
- August 2010
- July 2010
- June 2010
- May 2010
- April 2010
- March 2010
- February 2010
- January 2010
- December 2009
- November 2009
- October 2009
- September 2009
- August 2009
- July 2009
- June 2009
- May 2009
- April 2009
- March 2009
- February 2009
- January 2009
- December 2008
- November 2008
- October 2008
- September 2008
- August 2008
- July 2008
- June 2008
- May 2008
- April 2008
- March 2008
- February 2008
- January 2008
- December 2007
- November 2007
- October 2007
- September 2007
- August 2007
- July 2007
- June 2007
- May 2007
- April 2007
- March 2007
- February 2007
- January 2007
- December 2006
- November 2006
- October 2006
- September 2006
- August 2006
- Older Archives
Resources & Links
- The Letters Prize
- Pre-2007 Victor Niederhoffer Posts
- Vic’s NYC Junto
- Reading List
- Programming in 60 Seconds
- The Objectivist Center
- Foundation for Economic Education
- Tigerchess
- Dick Sears' G.T. Index
- Pre-2007 Daily Speculations
- Laurel & Vics' Worldly Investor Articles