Dec
30
Correspondence With Steve Stigler, from Victor Niederhoffer
December 30, 2009 | Leave a Comment
 An article with highly defective statistical reasoning appears in the WSJ purporting to show there is a tremendous turnover in the top 25 companies from 10 years ago to today. It is best to consider this by noting how many of the top 25 baseball players by batting average in 1999 are still there today. That's the best way to get a handle on the regression bias implicit in such studies. The following correspondence between Vic and Steve Stigler puts it in perspective:
Dear Steve,
Hope you and family well. Merry Christmas. Here's an unusal aspect of the regresson bias. Wonder to what extent this consistent with properties of random numbers and to what extent it represents a change in the level of skill or in this case price change. It would be an interesting study. I was pleased that my daughter Kira got into Columbia Engineering School on early admission and another daughter had a grandson Wilder Niederhoffer named after a Libertarian. Best, Vic
Dear Vic,
This is the same as Horace Secrist "Triumph of Mediocrity in Business" 1933, in Chapter 8 of my book Statistics on the Table.
Congrats to all your successful avoidance of and tendency towards mediocrity in your descendents!
I attach my remarks from a memorial for Rose Friedman Dec 12.
Have a happy new year! Steve
Ken Drees adds:
Market cap 10 year free market survivors: old fashioned energy (big oil), food (Walmart), and technology (human invention) lead the list and boring consumer Gillette (razor blades for everyman). Things the human race needs for survival and to thrive will always be investments that will endure.
Big government wants to bleed big oil, keep food out of banking (probably best that Walmart was denied a key to the club after all), litigate tech for the halibut. And what can be done to Gillette? Maybe the healthcare bill can attach itself to some personal care products and bleed a little off. Also, energy, food, and the stuff everyone buys is what the government tries to melt out of the inflation indexes. So what we need is what they attack and thus make more expensive to us and then they tell us that its not more expensive and to just substitute chicken for meat.
GE? what do they do other than derivatives and green initiatives which are starting to turn a little brown.
Kim Zussman replies:
From the "getting little things right but big ones wrong" department:
What were dinosaurs long at KT boundary?
Prior decade's math/science PhDs lemming into finance.
New decade definition: "lemming": The process of best/brightest young people flowing en mass to the latest promising nascent bubble.
Dec
28
Stock Monthly Return Autocorrelation, from Kim Zussman
December 28, 2009 | Leave a Comment
Using DJIA monthly returns, at the end of each December and end of decade (i.e., 12/ XXX9), checked correlation of this month's return with prior month's. Here are the correlations along with the mean return for months within each decade:
Date correl 120 av 120
12/1/1999 -0.120 0.013
12/1/1959 -0.022 0.011
12/3/1979 0.012 0.001
12/1/1949 0.019 0.003
12/1/1969 0.020 0.002
12/1/1989 0.054 0.011
11/2/2009 0.111 0.000
12/1/1939 0.119 0.001
12/1/1999 -0.120 0.013
12/1/1959 -0.022 0.011
12/3/1979 0.012 0.001
12/1/1949 0.019 0.003
12/1/1969 0.020 0.002
12/1/1989 0.054 0.011
11/2/2009 0.111 0.000
12/1/1939 0.119 0.001
Looks like returns were higher for decades with monthly correlation more negative, which is verified by regression:
Regression Analysis: av 120 versus correl 120
The regression equation is av 120 = 0.00647 - 0.0481 correl 120
Predictor Coef SE Coef T P
Constant 0.0065 0.00153 4.23 0.006
correl 120 -0.048 0.02036 -2.36 0.056
S = 0.00409714 R-Sq = 48.2% R-Sq(adj) = 39.6%
////////
Note the recent decade most resembled the one ending in 1940. In honor thereof, here is some good stuff by a former neighbor.
Jordan Low comments:
Could this be due to positive downside autocorrelation during a crisis? I am speculating…
Dec
26
Lady Gaga: 10 Things We Can Learn, from Victor Niederhoffer
December 26, 2009 | Leave a Comment
 The great ascent of Lady Gaga from an also-ran performer in the Lower East Side techno-rock clubs a few years ago to number one selling recording artist in five countries, four million albums sold, and 20 million singles, rivals nothing so much as the ascent of Killmanjaro in 5½ hours or Apple's 4000% rise from 5 to 210 and the fourth largest market cap company in four years. Here are some of the things we can learn from her about how to be successful in the markets.
1. The Lady has a core of admirers she can always count on: the gay community. "I've got so many gay fans and they're loyal to me. They'll always stand by me and I"ll always stand by them." Apple's loyal fans are those that started out with them making music on their first computers and the minority group that liked the Apple operating system over and above the mainstream Microsoft one.
2. The prouct must be packaged and designed with great care and verve. Gaga has a special team, the Haus of Gaga, that designs all her clothes and stage performances. "When I'm writing music I'm thinking about what I'm going to wear on stage." Apple's packaging, its vivid colors, its compactness, directness, ease of use is crucial to its success.
3. You have to be technical to be a success. Gaga was playing by ear at the age of four, planning to go to Juilliard at 13. She writes her own music and her voice was good enough to attract Akon to sign her. The companies that have had the highest returns are people by engineers and computer scientistis with technical degrees.
4. You need a vision to be successful. Gaga didn't try to be the world's #1 singer or its most profitable. But she had a vision to combine glam rock with simple melodies. The best performing companies, Apple or Cisco or Whole Foods, have a product that makes life better for their customers, and they aim to be the best at it, and stick to their knitting.
5. She gets great reviews from the critics and this filters to the masses. All the best-performing companies reach out to the idea that has the world in its grip. They are all huge supporters of the current administration and reach out to unisex and redisbrituive policies so that the critics who share their persuasion will be sure to nominate them for awards. The most popular song of Gaga makes fun of rich kids that want material goods. When will she be invited to the Oval?
6. She has a simple product and a simple name. It's four letters and two syllables. And she combines simple movements, simple melodies, and simple rock rhythms in her songs. The price to weight ratio of Apple products is comparable to her own.
7. She stands on the shoulders of giants. She has borrowed from all the most popular idols that preceded her including Michael Jackson, Madonna, Blondie, and Andy Warhol. To be successful you need the base of fans that your predeceessors have accummulated.
8. She is shocking and exuberant in the things she does. The bubbles that she wore in Rolling Stone remind me of the glass houses Apple sells their products in, and her performances on stage are reminiscent of the conventions where Apple unleashes its products.
9. She has a completely integrated operation, writing her own songs, dancing them, designing her own clothes, and distributing them through a company she owns. The control of product from start to finish a la Apple's designed marketing and then retailing their own products is crucial nowadays to the most successful companies.
10. She is always ready to seek the limelight. She strives to have the best product, is proud of it, and will stop at nothing to popularize her brand. If it requires appearing nude, why that's just more publicity that her critics and core fans will love.
Kim Zussman comments:
This wonderful analysis also convincingly articulates the ugly, banal, cynical, pandering con of capitalism in general and investing in particular. Presumably the patina of beauty derives from the knowledge that it is facade.
Add to AAPL's list recruitment of the left, which targets Wintel for viruses but leaves MacAlone - encouraging climate coolers to take the path of least resistance.
Relatedly, Madam Gaga also evidences survivor-bias: How many thousands of performers try different angles but don't make it, then with the benefit of hindsight we ascribe causality to the at least partly accidental qualities of the successful?
Vince Fulco adds:
 I would venture Lady Gag Gag's actions, as I like to call her, is bleeding into other artists' styles. Forced to watch Shakira's latest DVD by my significant other yesterday, it was obvious she's leaning much more risque in movements, outfits and dance routines. She certainly doesn't need to given her voice, lyrics and natural beauty. Beyonce seems to be doing the same. Although I catch these performers infrequently, who passes up an undulating set of hips that the wife gives free pass on viewing?
Dec
23
Whup ‘em With the Yield Curve, from Kim Zussman
December 23, 2009 | Leave a Comment
The attached chart shows weekly historical 10Y-2Y Treasury yields* (which is a measure of the yield curve slope) alongside log SP500 weekly closes, 6/76-present.
After the whip-inflation Volcker period (late 70's-early 80's), the yield curve looks like a tool to reverse recessions and bear markets in stocks. The recent peak 10Y-2Y of 2.69 is the highest since another 2.69 in 8/2003, and the prior maximum was 2.62 in 7/1992. Too little N for inference, but stocks rose for a long time after these peaks, and if nothing else it shows what the FED is trying to whip up.
*(Market yield on U.S. Treasury securities at 2-year, 10-year, constant maturity, quoted on investment basis, Fed data).

Steve Ellison comments:
I ran regressions of the yield curve, which I defined as the difference between the interest rates on the 10-year bond and the 3-month T-Bill, and the subsequent 4-month change in the S&P 500.
From 1962 to 1982, there was a strong positive correlation between the yield curve and the subsequent change in the S&P 500.
ANOVA
df SS MS F Significance F
Regression 1 0.043 0.043 6.76 0.012
Residual 61 0.387 0.006
Total 62 0.430
However, from 1983 to 2009, not only was the correlation non-significant, but the sign changed.
ANOVA
df SS MS F Significance F
Regression 1 0.004 0.004 0.54 0.463
Residual 76 0.618 0.008
Total 77 0.623
Dec
23
Imagine If, from Kim Zussman
December 23, 2009 | 1 Comment
Imagine the drift in US stocks had world wars been on US soil.
undestruction look-back bias
Dec
14
Waiting for Volo, from Kim Zussman
December 14, 2009 | 2 Comments
One definition of volatility is stdev of daily returns over a period. Using DJIA daily closes since 1929, partitioned the series into non-overlapping 10 trading-day periods. At the end of each 10D, calculated stdev of that period.
The attached graph plots 10D stdev over the whole series, with the familiar spikes corresponding to other volatility measures such as VIX and VXO. Note historically there are relatively few spikes with SD10 0.03, but when in the past they occurred (late 1920s/early 30s, late 30s, and early 2000s), there were other large spikes which followed. The notable exception is 1987, and of course the present because:
1. The future hasn't happened yet
2. The late Dr. Samuelson won the debate with the late Dr. Friedman, at least within our current Keynesian government
In attempt to quantify waits to next volatility spike after large spikes, defined a large spike as: (a maximum at the center of 17 - 10D periods) AND (>0.03). (a major spike which was the highest for 80 days in the past and 80 days in the future). The recent large volatility spike which peaked Oct 2008 was 0.057, 29 10D periods ago.
Once spikes >0.03 were identified, checked wait time until another spike >0.02 occurred. Here are the instances and the waits:
Date >0.03 nxt spike
10/17/08 0.057 ??
09/24/01 0.031 21
09/14/98 0.034 38
10/28/97 0.031 22
10/27/87 0.089 50
09/08/39 0.030 18
10/22/37 0.034 11
07/28/33 0.045 25
03/21/33 0.060 9
08/16/32 0.051 14
02/25/32 0.047 12
10/14/31 0.071 9
06/23/30 0.036 13
11/14/29 0.075 15
mean 19.8
Note the current wait of 29 10D periods is third longest, after 38 (1998) and 50 (1987).
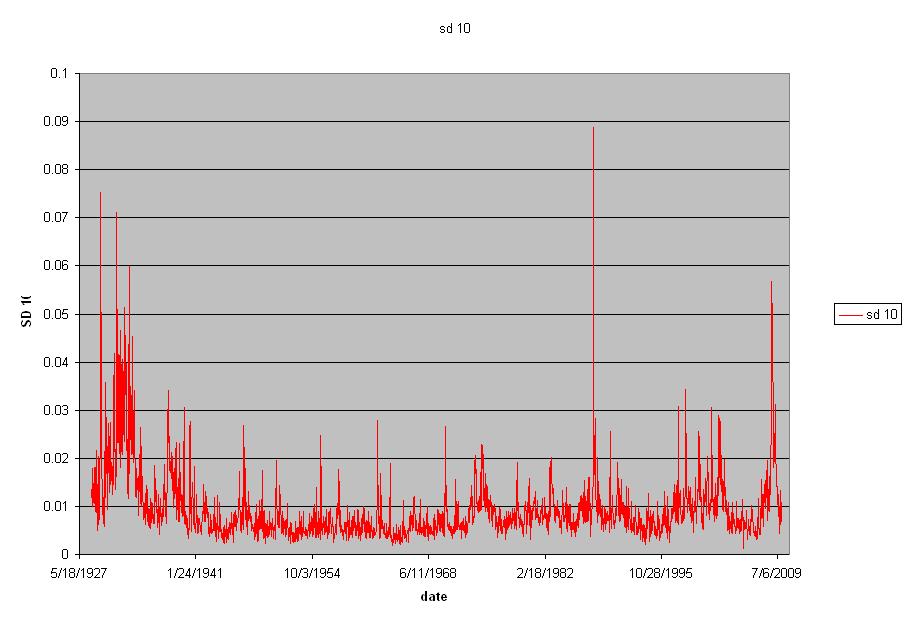
So here we are, waiting for Godot.
Dec
14
Aristotle, from John Watson
December 14, 2009 | Leave a Comment
 Aristotle once said, "All paid jobs absorb and degrade the mind" Is there any way of quantifying this, and are there any implications in the markets, life, and trade?
Aristotle also said, "We are what we repeatedly do. Excellence then, is not an act, but a habit." Does this extol the virtue of practicing until we get it right? How does one know if they are getting it right, and if they have the proper tutor.
Aristotle wrote in his Nicomachean Ethics "It is not always the same thing to be a good man and a good citizen." I've been wringing my head trying to figure out all of the different philosophers who have borrowed this idea, and have come up with a list of at least 20. Any help in compiling a complete list would be appreciated.
He also wrote in Nichomachean Ethics, "It is possible to fail in many ways…while to succeed is possible only in one way." I would like to disprove this as there are more than one path to success.
Kim Zussman replies:
Do a twin study:
Find pairs of identical twins (same genes) with different employment histories. Best would be congressman vs. doctor. Failing that, find pairs with large differences in total hours worked to date.
Perform intelligence testing on the pairs, and use paired t-test to check for difference as a function of high vs low prior work/brain wear.
A related study could be done on the productivity effects of wearing robes and fondness for little boys.
Jim Sogi writes:
At the risk of disagreeing with Aristotle, excellence is a constant struggle. At least for me it is. Habit implies some sort of easy continuation. Constant vigilance is very very difficult. Excellence also connotes superiority over others. Thus there is a the constant pushing and straining to excel over others who try even harder.
J.T. Holley replies:
I don't think Mankind or Aristotle (all thought is a mere footnote to him in Philosophy circles) should be given a break at their points in time now that we've evolved Capitalism to the point it is today. Seems to me that the most important principle here is that what was shared by Susan Niederhoffer the other day "everyday seek out knowledge". In the agrarian society that was around in Ari's time we can certainly understand that doing some "meaningless paid job" took away from the devotion, persistence, focus and the ability that Ari had at driving forward to thought and knowledge. He is reluctant to realize though that the underlying power of Capitalism and his own mind freed him up to pursue his own thoughts and not degrade his mind.
"We are what we repeatedly do."
I happen to agree with this but not in totality. His teacher Plato spoke of to paraphrase "to know the good is to be the good". Much more objective than Aristotle's "do do the good is to know the good" of which leans towards being subjective. I think both are acceptable in "being". Case in point is Plato's "Allegory of the Cave". Being tied to the post the man competed and "repeatedly" learned to beat his peers at guessing at the shadows, but once freed and outside the cave he saw the light! The objective in this allegory trumped the subjective that was thought to be the truth. The objective with the subjective seems to be balanced though if we apply Aristotle's "golden mean" that he also mentions in Nich. Ethics. A wonderful balance of both instead of just one or the other.
"Nicomachean Ethics," he said, "It is not always the same thing to be a good man and a good citizen."
Kierkegaard found and wrote of this as well. He found great power, strength, and lessons in the paradox and hypocrisies of life. His three stages of life's way is a good example of this with the movement from aesthete to ethical to final religious. In the final stage of religious for Kierkegaard he used the Paradox of Abraham to find his strength. Being told by Gawd to go to the mountain and sacrifice his son what thoughts must have been in his mind and that of his town or family? He was either a lunatic by most or the most devout believer in Gawd's word. Kierkegaard spoke of the "fear and trembling" that must've been going on as the knife was thrust to the air to the point to where it was almost at apex to come down into his young son's chest. "good man" or "good citizen"? "religious" or "crazy"? Of course as the passage goes he didn't have to ultimately sacrifice his son but the lamb. The paradox was there though when thought and decision was made to be true to himself.
He also wrote in"Nichomachean Ethics," "It is possible to fail in many ways…while to succeed is possible only in one way"
to quote the Chair "The best way to achieve victory is to master all the rules for disaster, and then concentrate on avoiding them." Trial and error is important in life and speculation. The pain from failing can often lead us to being better individuals and profit takers.
Nigel Davies writes:
 I think there are a number of problems in discussing 'ancient wisdom', for example culture, language and context. One might ask what defined paid and unpaid work in Aristotle's time? I'd argue that to really understand what he was saying one would have to be a several thousand year old Greek.
As for the internalization of excellence (i.e. habits), the valuation of such may depend on whether one prefers 'reason' to 'intuition born of vast experience (ie habits)'. Taking a different angle on this, does an inexperienced but opinionated newcomer deserve to win against an old hand? Humans value their reason, but maybe this is just vanity talking.
Peter Grieve adds:
I bow to no man in my admiration for the literature of classical Attica, but Nigel has put his finger on a weakness. The surviving philosophical writers did tend to value reason over experience. This may be why they made tremendous progress in mathematics, but were dreadful scientists and mediocre engineers (Archimedes came later, and was a Syracusean). Their mathematics was largely intended to support astrology, for heavens sake. This is in line with their feeling that people who actually produced anything were of a lower order. Apparently people were amazed when Socrates spoke to artisans in an attempt to find answers. Aristotle's attitudes about paid work may reflect this bias.
Dec
12
Laffer Curve? from Kim Zussman
December 12, 2009 | 1 Comment
Here is a quick look at 2008 per-capita GDP and income taxes.
Country data on "all-in" income tax rate (income tax plus employee social security contributions):
Calculated average % tax for single (no child, two children), married single earner (no child, two children), and compared to per-capita GDP from Wikipedia/IMF, by country for major countries:
Country Tax GDP pc
Australia 21.7% 36918
Austria 32.8% 39887
Belgium 36.6% 36416
Canada 19.2% 39098
Czech Republ 15.1% 25118
Denmark 38.2% 37304
Finland 30.0% 36320
France 24.0% 34205
Germany 33.0% 35539
Greece 26.4% 30681
Hungary 38.3% 19553
Iceland 19.5% 40471
Ireland 10.0% 42110
Italy 25.6% 30631
Japan 18.3% 34116
Korea 11.2% 27692
Luxembourg 21.5% 82441
Mexico 5.1% 14534
Netherlands 32.6% 40558
New Zealand 21.2% 27083
Norway 27.9% 53738
Poland 24.6% 17537
Portugal 18.7% 22232
Slovak Republic 16.8% 22097
Spain 14.5% 30589
Sweden 26.7% 37334
Switzerland 18.3% 43196
Turkey 26.8% 13139
United Kingdom 24.8% 36358
United States 17.7% 40440
Ignoring that the Laffer Curve is supposed to be an inverted parabola, here is regression showing no relationship:
Regression Analysis: GDP versus all in tax
The regression equation is
GDP = 30035 + 18111 all in tax
Predictor Coef SE Coef T P
Constant 30035 7250 4.14 0.000
all in tax 18111 29442 0.62 0.543
S = 13134.8 R-Sq = 1.3% R-Sq(adj) = 0.0%
An exercise left to the reader would be effect of within-country change in all-in personal tax vs per-capita GDP.
Dec
11
Whither Japan? from Dan Grossman
December 11, 2009 | 4 Comments
 I used to do a lot of business in Japan and I think very highly of Japanese businessmen (unfortunately they rarely include women at high levels). They have an industrious, highly intelligent population, are very interested in business, and a good base as the second largest economy in the world.
It is a great mystery to me why they (and their stock market) have not done better in recent years and I have never seen any good explanation of it. Okay, they had a bubble that burst, government policies that were not great, and they have an aging population. But so what? They had plenty of opportunity to recover on their own in spite of whatever the government has been doing. (BTW their government policies could not be any worse than our current ones, so if government policies are the test, we're in big trouble.)
Has anyone seen or can anyone give a decent explanation of why Japan has lagged?
Ken Drees writes:
1. LDP party out of power after 55 years.
2. Exports and profits slumping via USA trade like others Asian exporters.
3. Big(gest) holder of USD denominated debt.
4. Aging populaton (nothing new), but 81 billion spending package just announced, more internal stimulus to follow?
5. Need to diversify their surplus holdings like others (China, Brazil, Russia, et. al.)?
6. New party administration playing a little differently with USA — recent Obama trip no real results, prior to that some grumblings about USA debt, etc.
7. Japan equities — bottoms in 1998, 2003, 2009 — skewed symetric reverse head & shoulders – or just bumping along the bottom?
8. Will need to strengthen export markets everywhere and keep USA markets open and profitable. Japan's growth lies with its neighbors if USA doesn't fix itself.
9. Yen carry trade over, yen rising — conflicts with strategic direction that exports and export profits need to be robust.
10. Zugszwang-lite Japan — any small move doesn't change game for the better. Are there any good moves available?
How will the new party lead? If they cannot rope in the yen to improve exports can they stimulate spending via QE and weaken yen at same time? Or is this approach too slow and meandering? There seems no real strong moves available unless global imbalances happen first and allow Japan countermove possibilties. Japan seems still to be unable to escape via its own power.
Is Japan getting tired of being tired?
Charles Pennington adds:
 A broad-brush explanation is that the Nikkei got way out of line with other world markets and has spent the past 20 years returning to normalcy.
The Japanese price to earnings ratio was "well over 100" in the late 80s, and now it's 33 (reported by today's Financial Times), still higher than the US at 22. Earnings for the S&P are up about 2-3 times over their level in 1989, and perhaps the Nikkei's are as well, but if the P/E fell from, say, 200 down to more normal value of 33, a value much more in-line with other world markets, well, that explains a lot.
The Chair will rightly point out that this is retrospective, descriptive, and not predictive, that Japan's interest rates are (or at least were) lower, that the accounting may be different. Also, Mr. Grossman doubtless already knows all these figures, so he is looking for a better explanation, which I don't have.
Kim Zussman adds:
Country-stock could be like "best company" studies, showing admired firms under-performing the rest. Presumably established/successful companies/economies have less upside than currently dire situations. And more downside?
Vince Fulco replies:
To the list I would add traditional factors such as:
1. Shareholders — very far down the societal list of all stakeholders in the corporate world. The stock market is generally considered more for gambling (no jokes Dr. Z!)
2. Much heavier reliance on debt financing (too much) due to roots in maibatsu/keiretsu structure whereby a conglomerate's banking branch handles all the financing needs
3. No Carl Icahn or Guy Wyser Pratte influence to shake up entrenched mgmts and unlock under-utilized assets. The quote is 'the nail which sticks up gets pounded down'. A few have tried over the years but are usually labeled degenerates or cowboys and run out of town one way or another.
4. Years of very low ROI, white elephant projects by the government, to keep happy important constituents of the LDP (the old group in power) such as construction and the mob — i.e. the bridge to an island with 50 people on it, which we almost got in Alaska a few years back.
5. Legacy obligations which haven't been addressed but simply kicked down the road as we've emulated so well in the last 12 months.
Ken Drees responds:
 Vince, Kevin, Kim and Charles have all provided excellent observations as to Japan's inbred entrenched-ness, inabilities to move, and relative over valuations. Also, the idea that is was the once high flyer status albatross, so all these past behaviors are in the rear view mirror, yet they continue to taint the view of Japan as an old has-been power country. But change agents may now be inside this yesterday/today paradigm. So far Palindrome's reflexive reinforcement of trend is still in force. The malaise continues. Will some new change agent surface? Will the reflexive reinforcement finally be breached.
The early elements for a change exist. To bet on a new bullish Japan is a long shot. But how much money can be made betting the field? Tax policy can be repealed, monopoly/hands in hands can be abolished, small investors can be made more ownership level. All the levers to lift the old dead stump and turn it over are at the ready. Or is this a dead end due to lack of will? Is Japan a stunted growth, never ever to leave off-broadway? If a global imbalance rises up, will Japan change tack and ride out on a new wind? I am watching Japan, if only since they since they are shackled to the USD. Maybe the impetus for change is at hand. This new administration in Japan — what do they owe the US?
Stefan Jovanovich replies:
The Japanese are certainly not hidebound where their Navy is concerned. They are the dominant sea power in their part of the world. From the folks at StrategyPage.com:
"Japan is currently the second largest naval power in the Pacific (after the United States), with a total of 32 destroyers, nine guided-missile destroyers, and nine frigates. The older Tachikaze-class guided-missile destroyers are being replaced by the new Atago-class destroyers. Japan also has 16 modern diesel-electric submarines. The Chinese navy is larger in terms of ships. They have 25 destroyers and 45 frigates. However, of these 25 destroyers, 16 are the much older (than Japanese equivalent) Luda class. Most of the frigates are the obsolete Jianghu class ships. China has 60 diesel-electric submarines, but most of them are elderly Romeo and Ming class boats. China's Han class SSNs (nuclear attack subs) are old and noisy. In terms of modern vessels, China is not only outnumbered, but the Japanese ships spend more time at sea and the crews are better trained. The Chinese are also at a disadvantage when it comes to naval air power. Most of China's naval fighters are old. They have a growing number of modern J-11s (a copy of the Russian Su-27) and the Su-30MKK. Japan is almost at parity in terms of numbers (187 F-15J/DJs and 140 F-2s to 400 Chinese J-11/Su-30MKKs). Japan has better trained pilots, although China is trying to close that gap as well."
Yishen Kuik adds:
 The attention to detail and sense of duty of their workforce is amazing, and the public infrastructure in Tokyo is of a very high quality — certainly better than Boston, DC, New York or the Bay Area. Tokyo is much bigger than all these four areas. It makes New York seem small.
It's not entirely clear to me why their equity markets haven't done better, but the "obvious" explanations of long term multiple contraction and shrinking internal aggregate demand seem to be correct.
I believe GDP per capita in Japan has been rising all along at the same pace as in the US since 1989, so it isn't as if quality of living in Japan has been frozen at 1989 levels. From what I can tell walking around the streets, they still enjoy a comparable standard of living to anywhere in the OECD, and have an unemployment rate (whatever that means in Japan) of 5.0%
Henrik Andersson replies:
Some investors are expressing great fear about the debt given the large amount maturing in the coming 12 months that is held by citizens, as Yishen writes, and given it has "no foreign demand, no domestic savings, structurally declining tax receipts and savings due to demographics, etc." Any views on this?
The top line numbers for the country are stagnant, but the per capita numbers don't look so bad. Japan might have a ton of public debt, but most of it is yen denominated and some 3/4 of it is held domestically by its own citizens.
Dan Grossman writes:
 Two thoughts perhaps follow from the helpful comments of Prof. Pennington and Mr. Kuik:
1. Based on the two-decade decline in average Japanese stock PEs from 200 to 33, why shouldn't average US stock PEs decline further from the current 22 if government policies following bursting of the bubble are equally ineffective in the US as they have been in Japan?
2. If since 1990 the U.S had avoided illegal and legal immigration anywhere near the extent to which Japan has, the US unemployment rate would probably also be 5%.
Vitaliy Katsenelson adds:
Please look at slide 14. Japanese valuations at the of 1989 were incredibly high, add to that a lengthy deleveraging process on the corporate side and leveraging (debt to GDP has tripled) on the government side and you also have anemic economic growth.
Vince Fulco writes:
Here is fascinating article in the WSJ re: a foreigner helping a small japanese village manage the downside of the demographic slowdown. One wonders how much more pervasive this sclerotic 'no change' attitude really is…
Charles Pennington adds:
There's a nice column by Lisa W. Hess in the Dec. 28 Forbes about investing in Japan.
She claims that small cap companies are even more undervalued than large cap, and recommends buying the Topix rather than the Nikkei.
Dec
9
Name That Fund! from William Weaver
December 9, 2009 | 2 Comments
 Hypothetical:
You wake up this morning and have an extra $10 million dollars in your bank account. You call your banker and find out that your broker overcharged you for commissions and that the money is yours without taxes. Throughout the day you proceed to spend as much as you can; a new car… two new cars, an addition to the house that includes an indoor pool and of course gifts for your family.
You check your statement and find you still have $5 million left so you decide to invest in another hedge fund (you've managed to spend much more than $10 million in broker commissions so you've got a lot of investments). You are presented with the following list. Assuming you know nothing of the investment style or past performance of the funds, which fund would you invest in?
Intercept Capital Management
Alexander Hamilton Capital Management
Federalist Capital Management
Trafalgar Capital Management
Barkentine Capital Management
Bearing Capital Management
Royal Sovereign Capital Management
White Knight Capital Management
Rittenhouse Capital Management
VectorPoint Capital Management
Thank you so much! Any input you have is greatly appreciated.
Kim Zussman adds:
Tiger's Wood Decapitation Management
Tom Marks asks:
Is Prof. Sharpe involved with that outfit?
Dec
9
The Shadow Knows, from Kim Zussman
December 9, 2009 | Leave a Comment
 Many will recall Ross Miller's study of Fidelity Magellan fund under Robert Stansky, in which he shows the fund to have been essentially indexing — without adding manager value (however you define that).
This paper appeared circa Feb 2007; shortly after which Mr. Stansky was dismissed.
Here is a check on whether Fidelity Magellan's new manager is real or just a shadow. FMAGX daily returns (cls-cls) were regressed against big-cap SP500 index ETF, SPY. First for an equal 704 day period prior to Ross' study:
Regression Analysis: FMAGX- versus SPY-
The regression equation is
FMAGX- = - 0.000106 + 1.06 SPY-
Predictor Coef SE Coef T P
Constant -0.00011 0.00011 -1.01 0.313
SPY- 1.064 0.01640 64.88 0.000
S = 0.00278542 R-Sq = 85.7% R-Sq(adj) = 85.7%
FMAGX slightly underperformed SPY (NS), with high correlation.
Here is the same regression for the 704 days since the study:
Regression Analysis: FMAGX+ versus SPY+
The regression equation is
FMAGX+ = 0.000011 + 1.07 SPY+
Predictor Coef SE Coef T P
Constant 0.0000111 0.00023 0.05 0.961
SPY+ 1.075 0.01152 93.22 0.000
S = 0.00594187 R-Sq = 92.5% R-Sq(adj) = 92.5%
Basically identical to SPY, with same beta as before, now with even more correlation.
Eclipsing the shadow.
Alston Mabry continues:
However if one invests in 200+ large cap stocks stocks among 60 subgroups, they are going to likely going to correlate closely with the S&P 500. For example, over the past two years, an equal investment in each the nine stocks he listed would have had a 95% daily correlation with SPY.
Following a similar path, one calculates correlations for the daily log% changes of a few stocks vs SPY, over a 120-day period:
MCD by SPY: +0.36
MSFT by SPY: +0.52
PG by SPY: +0.54
Then, simply add the daily log% changes of one or more stocks together, day by day, and run the correlation against the SPY:
MCD+MSFT by SPY: +0.58
MCD+PG by SPY: +0.55
MCD+MSFT+PG by SPY: +0.67
It doesn't seem surprising that for any combination of components of SPY, one gets a higher R than any of the individual components in the combination.This is just a "back of the envelope" test, and I don't know how it would look for all possible combinations, or taking cap-weighting into account.
Phil McDonnell adds:
If one were to re-do Big Al's study it would be better to use simple percentage changes not logs. Logs are for compounding and are needed for one time period following another if reinvestment is allowed. But since step two in this process is to average the stocks into small 2 & 3 stock portfolios a simple average would be better.
In general building portfolios of positively correlated stocks will tend to move the portfolio toward the average return. However if one searches for negatively correlated investments with positive expectation returns can be achieved with less risk.
Dr. McDonnell is the author of Optimal Portfolio Modeling, Wiley, 2008
Kim Zussman writes:
MSFT is 2.4% of SP500/SPY; MCD is 0.7%
Dec
6
From the Deception Reading List, from Kim Zussman
December 6, 2009 | 1 Comment
 From Against the Gods, Peter Bernstein, 1996 printing, chapter 15, paragraph 1:
"..quantification of risk is alive, well, and regularly practiced by professionals in today's world of globalized investing. Charles Tschampion, a managing director of the $50 billion General Motors pension fund, recently remarked, "Investment management is not art, not science, it's engineering… We are in the business of managing and engineering financial investment risk." The challenge for GM, according to Tschampion, "is to first not take more risk than we need to generate the return offered." A high degree of philosophical and mathematical sophistication lies behind Tschampion's words."
Dec
5
Buying the S&P, from Ken Drees
December 5, 2009 | 3 Comments
 Buying the S&P today [2009/12/04] after the run up since March, throwing in the towel because this employment news means the economy is turning around, is akin to buying that stout, fat blood bay gelding team hitched to the most beautiful painted wagon ever seen. Arsenic fortified fiends, a la Ben Green. As soon as you buy them, they start losing weight, losing pep, losing beauty, losing power — powder on a knife, turn your back and walk away.
Kim Zussman questions:
How would you participate as a market Asperger if the market:
- Became a vehicle of change for the powers of evil
- Cheers only the flaws and mistakes of capitalism and human nature
- Makes you money only when your bets are cynical, or in the opposite direction of your beliefs
- Moves are 100% random, with an occasional bone thrown to keep you paying vig and (especially now) taxes
Dec
4
Productivity, from Jeff Watson
December 4, 2009 | 2 Comments
U.S. nonfarm worker productivity jumped at an annual rate of 8.1% in the third quarter, the biggest rise in productivity since 2003.– News Report.
 I own a couple of businesses and am constantly trying to increase productivity. One benchmark for productivity is the study of Items Sold per Labor Hour (IPLH). In my mind, this is the ultimate measure, as it's non-inflationary, and cannot be massaged. I also pay attention to Items per Customer and Sales per SQ Foot. I set goals and hold the managers' feet to the fire if the IPLH suddenly dips. I don't mind paying overtime if it is used to generate extra business, and not used to finish work due to slacking. Being retail oriented, when there is downtime, the employees are expected to clean and front the inventory. We pay our employees a little over the market rate and give quarterly bonuses, yet remind them that they are only as good as their last numbers. Still, our turnover is well below the industry standards. Turnover will kill you as it costs me $1600 to train a new employee and get him up to speed.
Jeff Watson, surfer, speculator, poker player and art connoisseur, blogs as MasterOfTheUniverse.
Kim Zussman adds:
Possible ways to increase productivity:
Produce more with less
Produce more with the same
Produce a lot more with a little more
Produce the same with less
Produce less with a lot less
For those still employed, fear would seem to be a good motivator to work harder/more efficiently. Especially those making less than the Holy Ceiling of $250,000 per year.
Dec
2
Day of Week and Mood, from Ken Drees
December 2, 2009 | Leave a Comment
 If Fridays are the best day of the week (mood wise) and traders are happy and prone to take chances, but lock in profits to be safe. And Mondays are the worst day of the week (mood wise), back to work, the grind–but some energized from the weekend all studied up and ready to go–would not Wednesday morning then be the mid point in terms of mood? Facing the long tiring day–won't be over the hump till next morning, knee deep in the work week, probably surly or strained.
Tired, stressed and stuck in the middle–how to take advantage?
Victor Niederhoffer writes:
One would count.
Kim Zussman adds:
The weekly cycle in happiness appears to suggest livejournal bloggers don't like work or school. Wednesday is the maximum distance from the weekend, and happiness peaks on Saturday.
I would argue lots of adults are TGIM'ers.
Even without looking at the market, in the old days you could often tell if it's up or down by looking at spec-posts:
Permabull/permabear post ratio and tone.
Adam Robinson comments:
A lot, a lotta work has been done quantifying moods using corpus linguistics. Here's one interesting paper on time of day/day of week mood cycles.
Phil McDonnell replies:
Gallup Daily Poll has done a decent start to confirm that the phenomenon of weekly mood swings is quite real. The linked daily graph of US mood makes it quite clear that there is a weekly cycle. The next step is counting in the market as the Chair suggests.
J.P Highland writes:
My Friday attitude toward trading depends on how the previous 4 days were. If justice was found I play it safe looking not to finish in foul mood and have a sour weekend. If things went bad I become overly aggressive looking to bring my PnL back to green but usually the outcome is bad.
Victor Niederhoffer comments:
This is right out of Bacon I believe with the 8th and 9th race in those days, now the 17th and 18th on the card, being people like us trying to get even by playing the long shots.
Dec
2
An Exercise for the Reader, from Phil McDonnell
December 2, 2009 | Leave a Comment
Most say this rally started on Mar. 9th at the ominous level of 666 on the S&P. It seems to have stalled at about 1110. What number does one get when 1110 is divided by 666?
Kim Zussman writes:
It's 666 raised by 66.6%. Evidencing the Antimistress.
Nov
30
Allocation of Capital, from Dan Grossman
November 30, 2009 | 3 Comments
 Allocation of capital on a macro, national scale is an important but under-studied subject, relevant to analysis of the cureent economic situation.
While the collapse of the Soviet economy seems multi-determined and very difficult to analyze, misallocation of capital (MAC) was a key, if not the key, ingredient. From the outset Soviet Communism was famous for its Five-Year Plans for investment and capital allocation. In the beginning the Plans emphasized catching up in major industrial areas where Western countries had obviously been successful — steel, machine tools, electric power — and the growth of the Soviet economy did well. There was even talk among US experts of the higher-growth-rate Soviet economy eventually surpassing that of the US.
But by the latter 20th century, US and other Western economies had become more subtle and technologically-oriented. Economic growth depended on research and fast-moving investment into high tech areas — inventions and products that initially seemed minor or almost invisible, discoverable only by haphazard groups of large corporate and tiny individual entrepreneurs, totally unpredictable to government bureaucrats.
In this environment Soviet Communism was hopelessly outclassed. Its top-down planning and traditional love of Five-Year Plans and machine tools could not keep up with Silicon Valley. Billions of dollars of Soviet capital were being allocated to projects with marginal or even negative returns, while growing billions of dollars of American capital were being allocated to the then unusually high returns of Silicon Valley and the like. Compounded over 30 or 40 years, this makes for an incredible difference in result, collapse for one and tremendous prosperity for the other.
What are the implications of this for present times?
First, we have a situation in the US where major portions of our very large economy are being shifted from allocation by entrepreneurs, who in the aggregate know where to allocate capital (not because they are so smart but because they are governed by highly diverse market forces), to allocation by Congress and government bureaucrats, who don't. (And "don't know" is charitable, since their political incentives of pork and saving failing constituencies make the government allocations even less economic.) That has to be far less favorable for long-term US economic growth.
Second, we have China. While the Chinese are probably smarter, or more uptodate, than the Soviets were in their allocations, and are dealing with an economy much more open to market forces (particularly in having to cater to US purchasing allocations), can the Chinese in their government-directed investment and capital allocations continue to escape the defects of the Soviet allocations?
And with the likelihood of the Chinese misallocations being covered up by phony statistics over many years (the same type of phony statistics that misled not only the Soviets themselves but sophisticated outside observers such as the CIA), isn't this a situation that will sometime lead to a pretty dramatic day of reckoning?
By the way, I have not read any academic or investment research on capital allocation/misallocation and the above is pretty much off the top of my head. Thus I would be grateful for good citations or sources to contradict or modify my views, or to better educate myself in this area.
Stefan Jovanovich comments:
I think Mr. Grossman exaggerates the extent to which American "capital" has been allocated by entrepreneurs in the years since 1925. Wealth has certainly been created by enterprising individuals; but the extent to which the national wealth has been allocated by the government should not be ignored. One statistic always comes to mind when I read praise for American "capitalism" — the amount of money spent on the Manhattan Project alone was more than the entire historical investment in the U.S. auto industry. Silicon Valley — which looks a good deal like Detroit in the mid-1930s these days — was very much the product of the military-industrial complex Eisenhower questioned. Mr. Hewlett and Mr. Packard got their start by selling oscilloscopes to the Army, and but for the need for control devices for ICBMs, they would still be growing fruit in the orchards around San Jose.
What defeated Soviet communism was the absence of private money, the inability of individuals to save their own wealth in a form that could be spent by them. Everything in the Soviet Union was rationed; it was the ultimate single payer system. The question for which none of us has an answer is will private money continue to exist in China when that country has its banking and credit crisis? (Of course, the cynics I know are asking the same question about the present banking system in the United States: "What do you think of the American system of private money, Mr. Gandhi?" "A most excellent idea.")
P.S. For the first 60 years the Soviets' allocation of capital was not greatly inferior to our own where military technology was concerned. Their ability to literally move their entire industrial base 500 to 1000 miles east while defending themselves against the Wehrmacht is a miracle of raw production that more than equals anything done by Kaiser's shipyards and Boeing's B-29 factories in Kansas. Imagine the German Army invading the United States through the Champlain valley and capturing Boston, Pittsburgh, Cleveland, Philadelphia and New York and the United States' moving its entire steel and auto industries by rail to Nebraska in the midst of winter.
P.P.S. The B-29 was built in Kansas because of the assumption that the United States might be subject to the same kind of sustained bomber offensive that the Allies had been conducting against Germany. The failure of the Germans to develop the significant heavy lift capacity for bombing and transport is probably the single top down command decision that doomed them; if they had invested the effort into development of a 4-engine bomber that they put into rocketry, they would have won. Instead, the Allies did, which allowed them to discover after the fact — thank you, Professor Galbraith — that bombing was a complete failure.
Kim Zussman replies:
One could make the case that the tech bubble was partially the result of the collapse of USSR:
- The political stability risk-premium in the US went down post-Soviet threat (markets move in reverse to risk premium change)
- Defense spending went from 6% to 4% of GDP from 1990-2000 (see attached chart from this site). Some of that went toward tech investment (Note that defense spending went up post 911, and stocks/ROC 00-10 was not as good as 90-00).
- Check out what happened to Japan and Germany stocks post-defeat, and St. Petersburg post-Bolshevik.
Nov
23
Speaking of Value Line, from Kim Zussman
November 23, 2009 | Leave a Comment
Here is a description of the studies I am doing on Value Line. FVL is an ETF which uses the Value Line timeliness system. Instead of using VL service to pick stocks individually, you can own FVL and obtain VL returns (of course other screens could be applied).
Using daily closes of FVL and SP500 ETF SPY, I did a linear regression:
For each day's change in SPY (X), what is the same day's change in FVL (Y). The actual equation for this line is:
FVL = - 0.000109 + 0.791 SPY (Y = alpha + beta*X)
The regression does a least-squares fit of a line to the data (minimizing the sum of squares of errors in Y direction), and the slope and Y-intercept of this line describes how FVL's daily change is related to SPY's.
The slope ("beta") of 0.8 means that when SPY goes up 1%, on average FVL went up 0.8%, etc. The intercept alpha) shows, on average, whether FVL gives higher or lower daily return than SPY, by checking where the line crosses when SPY is zero.
Both slope and intercept are tested for statistical significance (assuming error residuals are normally distributed), that is whether they were likely to have occurred by chance alone.
(Better descriptions welcomed)
Here is the study:
FVL; Value Line timeliness ETF.
From inception in 2003, regressed daily return of FVL vs SPY:
Regression Analysis: FVL versus SPY
The regression equation is
FVL = - 0.000109 + 0.791 SPY
Predictor Coef SE Coef T P
Constant -0.00011 0.00023 -0.48 0.630
SPY 0.79111 0.01640 48.24 0.000
S = 0.00906282 R-Sq = 59.3% R-Sq(adj) = 59.2%
>> Conclusion: alpha (with respect to SPY) for FVL is negative, though N.S. Beta is 0.8, and highly significant.
A scatter diagram is also available.
Charles Pennington writes:
For my curiosity, could you (if convenient) try reversing it and regressing SPY vs the VL fund, for comparison?
Kim Zussman replies:
No problem, Charles. Here's what happens when you reverse the independent and dependent:
Regression Analysis: SPY versus FVL
The regression equation is
SPY = 0.000173 + 0.749 FVL
Predictor Coef SE Coef T P
Constant 0.0001734 0.0002204 0.79 0.432
FVL 0.74920 0.01553 48.24 0.000
S = 0.00881953 R-Sq = 59.3% R-Sq(adj) = 59.2%
Analysis of Variance
Source DF SS MS F P
Regression 1 0.18099 0.18099 2326.84 0.000
Residual Error 1599 0.12438 0.00008
Total 1600 0.30537
Nov
22
Deception, from Victor Niederhoffer
November 22, 2009 | Leave a Comment
 The best books on deception are the best books about the market. The best book about the market according to Martin Shubik is Ben Green's Horse Trading. I would add that there is a good section on deception in EdSpec. And I would point out that a systematic categorization of deception is essential and this is available in the ecology literature following J.R. Krebs's citations on deception in various species, especially monkeys.
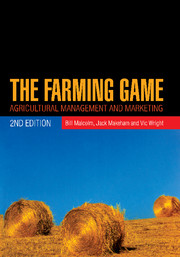
Adam Robinson says:
Of course, as I've eulogized no end, The Farming Game by Bryan Jones also has much to say on deception in the buying and selling of livestock, and does so with wit and insight.
Alston Mabry recommends:
I like A Treasury of Deception: Liars, Misleaders, Hoodwinkers, and the Extraordinary True Stories of History's Greatest Hoaxes, Fakes and Frauds by Michael Farquhar.
Russ Herrold re: The Farming Game:
I purchased The Farming Game on your recommendation and enjoyed it. It was a bit dated as to price examples (they look like a series from the mid 1960s to the mid 1970s), but the underlying principles remain sound. The book starts a bit slowly, setting up some stereotype character sketches, and then strings them together a bit, a bit later in the book.
Kim Zussman writes:
Here is my Deception reading list:
Stocks for the Long Run, Siegel
Irrational Exuberance, Shiller
A Random Walk Down Wall St., Malkiel (efficient markets)
Beating the Street, Lynch (inefficient markets)
Trade Like a Hedge Fund: 20 Successful Uncorrelated Strategies & Techniques to Winning Profits, Altucher
The Intelligent Investor, Benjamin Graham (value)
Common Stocks and Uncommon Profits and Other Writings, Fisher (growth)
Futures: Fundamental Analysis, Schwager
Technical Analysis of the Financial Markets: A Comprehensive Guide to Trading Methods and Applications, Murphy
Contrarian Investment Strategies - The Next Generation, Dreyman
Trend Following: How Great Traders Make Millions in Up or Down Markets, Covel
Momentum Stock Selection: Using The Momentum Method For Maximum Profits, Bernstein
(eigenvector = deception)
Vince Fulco adds:
To Dr. Zussman's excellent list, I would add another one very much off the radar screen. In Hostile Territory by Gerald Westerby is purported to be written by a former Mossad agent and profiles his adventures in Africa, the ME and Europe. I consider it of the best books written on the manipulation of human perceptions, mental flaws and frailties. I try to read it once a year to condition myself to avoid the traps. It is right up there with Cialdini, but the dynamic and life threatening challenges faced by the author are much more entertaining while providing extraordinary lessons on the subtleties of behavior.
I found the walk through on structuring a diversified [here: agri-]business very approachable, and anticipate lending it out to give context for further discussions to some I work with and mentor.
Jeff Watson comments:
 The best book I ever read on deception was called The Game by Neil Strauss. This book is the holy grail for pickup artists, but the lessons easily translate into all areas of life from sports to trading to games. It was very entertaining and well written, znd Strauss gives point by point instructions on how to manipulate, deceive, obfuscate, hypnotize, and control your opponent or object of desire. Strauss takes time to delve into the science of how to pick up women, and believes in rigorous testing and the book surprisingly isn't as misogynistic as one would expect.
Bruno Ombreux writes:
One absolute classic is Arthur Schopenhauer's The Art of Controversy. It also goes by a different title: "The Art of Being Right". Here is a Wikipedia article with the full list of stratagems. And it is available for free at Gutenberg.
Kim Zussman writes:
The most respected investment books of the 20th century all have eigenproblem of hidden utility. Even when authors are intellectually honest, it's hard to understand how they could escape distortion induced by rewards.
Some are selling their strategy (read my book but invest with me), talking their book (I'm deep into growth or value, so please buy these), pandering the academy (status as published professor), making a career of teaching how to trade, increasing status, creating a legacy, etc. This is similar to the more general, "how many friends do you have who don't profit from you?"
Bruno Ombreux responds:
I haven't read all the books in Dr. Zussman's list, but among those I've read, I think two are not deceptions:
A Random Walk Down Wall St., Malkiel (efficient markets)
Most investors would be better off reading this book and stopping there. Also:
The Intelligent Investor, Benjamin Graham (value)
I haven't finished this book because after the first two chapters I realized it was just a watered down version of the first edition of Security Analysis, from the same author + Dodd.
Security Analysis is an excellent book that makes excellent points for the era it was written in. Their technique of looking into detail at companies accounts is similar to detective work, which itself is an application of the scientific method. In my opinion, this kind of financial analysis is a valid way to proceed.
Nigel Davies comments:
The nature of deception may be much deeper than many authors make out. I would say that the origin of all deception is in fact self-deception and that the supposed 'deceiver' is doing nothing more than moving into the vacant space within our understanding.
George Parkanyi writes:
 There is a saying. "Fool me once, shame on you. Fool me twice, shame on me." To me it's just a given that traders, particularly those trading in size, use techniques to mask their intentions. And sure, those that have knowledge of them, run stops. That's just one of many influences that make financial instruments wiggle on a day-to-day basis, and you would not only have to sort out what is "deceptive" behaviour vs stupid vs herd behaviour, but whether the deception was or was not in your favour. Unless you have a large network of people you can call on the inside that can give you information that helps you take the temperature of a given market, I don't see the point of trying to personify this market move or that market move as "deception", especially in a big liquid market that is essentially a non-linear system subject to multiple influences. If there's a pattern that you detect and can exploit then so be it. But does it matter if it is "deception" vs. sentiment or just a big whale moving through?
Don't get me wrong. Reading about deception is certainly interesting. As a Scout leader, Arthur Baden-Powell's role in the Battle of Mafeking during the Boer War is an excellent example. In fact, BP's entire early career was based on deception. But I personally don't see the value in getting overly concerned about deception in the markets, though I understand that others do.
I think if you have a general sense of the day-to-day character of a market that you have researched and trade regularly, and do some research to try to anticipate macro influences on that market that might cause it to trend, the rest can be handled with money management.
Stefan Jovanovich replies:
Baden Powell's energy as a commander was probably the decisive factor in having the deception succeed:
From British Battles:
Baden-Powell conducted the defence of the town with great energy and resource, leading the Boers to believe there was a larger garrison than was the case. In November 1899 Baden-Powell launched a series of raids on the Boers lines that caused him some casualties but made the Boers wary of the garrison.
Initially the Mafeking garrison had no artillery. Baden-Powell improvised various items to look like real guns and trains, while engineers manufactured a gun, known as the "Wolf", from a length of steel pipe. The Boers used the 2 two inch guns they had captured from Dr Jamieson to bombard the town. Dud shells fired from these guns were reworked and discharged at the Boer lines from the Wolf. An officer found an old muzzle loading naval gun serving as a gate post. This gun was christened "Lord Nelson" and drafted into service. Dynamite grenades were manufactured and thrown at the Boer lines and a small railway line was built across the town.
In sharp contrast to the indolent Ladysmith garrison, Baden-Powell kept his men constantly on the move, raiding the Boer lines and keeping the besiegers on their toes.
Scott Brooks adds:
Atlas Shrugged not only speaks of deception, but the deceivers are open about their deception. The deceivers/looters are like gangsters who are in complete control in kick sand in the faces of the producers, daring them to say A is A and damning them if they do, all the while fooling the masses with their A is B pablum. The parallels to our world today are stunning.
Nov
21
Retire With $1 Million in S&P500, from Kim Zussman
November 21, 2009 | 6 Comments
A once popular eigenshibboleth is the need for stocks to finance retirement. There are lots of graphs of historical compounding of the SP500 over various periods, but I was curious about account balances over periods of retirement consumption. This is a simple (* see note) study of hypothetical $1M retirement accounts invested in the SP500, for 5 different individuals each retiring at the beginning of a decade: 1950, 1960, 1970, 1980, and 1990.
For everyone (except Goldman Sachs employees), they say one needs about 80% of their pre-retirement income to retire comfortably. $8,000 per month is 80% of $120,000 annual income (average government employee). Each of the 5 retirees puts $1M into the SP500 at the beginning of his retirement (his because a woman's work is never done), and each month sells stock and draws out $8,000 - leaving the balance in stocks. The balance of each retirement portfolio varies due to monthly drawdown + stock exposure, and the running account-balances are graphed in the attachment to compare balance variability and time to depletion for the different periods.
1950 did very well, with his account varying about $1.5M from 1955-69, and he didn't run out of money until 1989. Men didn't live so long then, so his widow must have been smart. The money lasted 39 years.
1960 wasn't so lucky: his account dropped rapidly in value, and was gone by 1974. Hopefully his wife was a professor too, and for the rest of their days they read books from the library together. Money lasted 14 years.
1970 unfortunately had to go back to work after 10 years, when his $1M was gone. Fortunately he got a job as a photographer for Playboy.
1980 made Einstein look like a Troglodyte. His account is still nearly $1M in 2009, and at times approached $3M. 1980 is a widower, and is friends with 1970, who set him up and he is now happily wed to a centerfold. Has been spending for 29 years and no end in sight.
1990 got off to a great start, but the last decade put him into Cymbalta, Cialis, and Metamucil. His account, which was worth $1.6M in 2000, is worth only $280,000 now, and he is calling the Senate today to make sure his meds will be free. 19+years and looking precarious; money may be gone in 3 years.
Note: *(study is very simple: inflation not factored, ignore effects of taxes, SP without dividends, earlier periods hard to index, no one has 100% in stocks, etc).

Anton Johnson comments:
An excellent study that demonstrates the perils of excessive withdrawal rates and underfunded retirement savings.
If we account for dividends and inflation which are not trivial, add government retirement benefits, and the modeled retiree varies withdrawal rates to the widely recommended annual 4-5% of gross account value, certainly a rosier picture emerges.
Kim Zussman adds:
There are many ways the retardees [Ed.: spelling?] could or should have allocated/withdrawn, but here I was trying to elucidate the effect of luck: when you retire vs the market then. The graphs are reverse of often shown compounding up to retirement — adding X per month to stock account (Famous example Mr. Hill, the engineer who used Value Line to compound millions).
One notes the effect here of changing cycles: 1977-00 worked for all stocks, not just growth. And since then, well, it's been more difficult. Even difficult for Value Line:
"November 10th, 2009
Last week the SEC charged Value Line Inc., an affiliated broker-dealer Value Line Securities (VLS), and two of Value Line’s senior officers with defrauding the firm’s family of mutual funds. Value Line’s CEO Jean Buttner and its former Chief Compliance Officer David Henigson have both settled the charged by consenting to the entry of a cease-and-desist order, though they have neither admitted to nor denied the SEC’s charges.
The Commission found that Value Line had been redirecting portions of the funds’ securities trades to VLS from 1986 until 2004 and that Buttner and Henigson overall received “over $24 million in bogus brokerage commissions from the funds pursuant to this scheme, as VLS did not perform any bona fide brokerage services for the funds on these trades.”
According to the SEC’s press release, Value Line, Buttner and Henigson further misrepresented VLS’s “phantom brokerage services” to Value Line’s shareholders, the Independent Directors/Trustees, and the SEC."
What if you invest in something other than the stock market? In the interest of ethnic diversity, attached is chart of $1M retirement accounts, each drawing $8000 per month, and compounding 1, 2,3,4,5% interest monthly on the remaining balances. I left off the current 0% interest environment, as an exercise for the reader.

Alston Mabry replies:
That's funny, because one of the authors of one of the investment books you listed previously, recently penned a journalistic piece about how maybe it didn't make sense to go to college, because if you put the college money instead into a savings account earning "just 5%", then you would get a better lifetime return.
The whereabouts of this magical savings account was not given.
Jason Ruspini writes in:
The effects of demographics on the underlying returns can't be too auspicious for more recent vintages. The parallel the Sage drew between 1954 and today seems very shaky in that respect.
Nov
18
Brooke Is Superficial, She Talks Only About Things, by Kim Zussman
November 18, 2009 | 4 Comments
Brooke [Shields] is superficial, she talks only about things rather than ideas. — Attributed to Andre Agassi.
 Supposedly Brooke graduated Magna from Yale, so she must be a well-reasoned thingophile. I called my college daughter this morning, hoping to give fatherly advice on "how not to be superficial." A simple formula: in speech, increase the ratio (ideas)/(things).
This advice rapidly became convoluted. An idea fundamentally is a thing. Structurally — an arrangement of specific neuronal connections. Money certainly is a thing, but also an idea; an idea which can transmit ideas (e.g. paying a consultant for ideas). A vehicle to facilitate trading of things, often glorified, and vilified, by people with conflicting ideas about the value of things.
Breast implants are things, with an idea behind them (a new tee-shirt logo?). Make-up is a thing — to present an illusory idea; allure, of youth and seduction, and escape from the idea of time, aging, and death.
Brooke may have had ideas about using her things to get things — a very common idea.
The advice was unnecessary as my daughter isn't superficial. But still it's interesting that smart, beautiful women, who never do things by accident, use the idea of things to get things.
Nov
16
Dow in December XXX9, from Ken Drees
November 16, 2009 | Leave a Comment
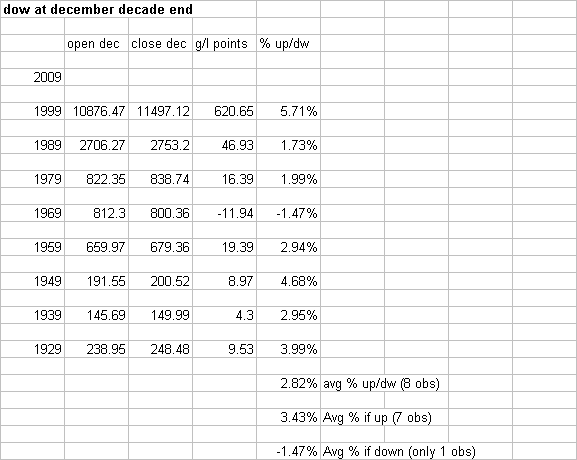
Speaking of decades, if you had to pick one asset to buy for the decade and you had to just hold it, what would that be? For example, these would have been great decade-long holds without trading:
1999—buy gold
1989—buy tech stocks
1979—buy US stocks
My long pull ideas for 2010- 2019:
biotech — (buy a biotech mutual fund and forget it)
tech (robotics, space, warfare)
China (no brainer)
US real estate — (it should recover by 2019, eh?)
commodities — (feed China)
Kim Zussman looks at it differently:
Counting years ending in 9 as end-of decade, if DOW closes near where it is now — this will be the first down decade since the one ending in 1939. Here are decade returns and alongside the subsequent decade:
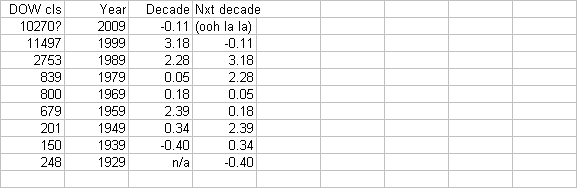
Not related to day-trading, but long (10+yr) period movements of the stock market could affect contemporaneous investors' future outlooks. E.g., those in stocks 1990-2000 experienced something very different from the recent (down?) decade.
Nov
14
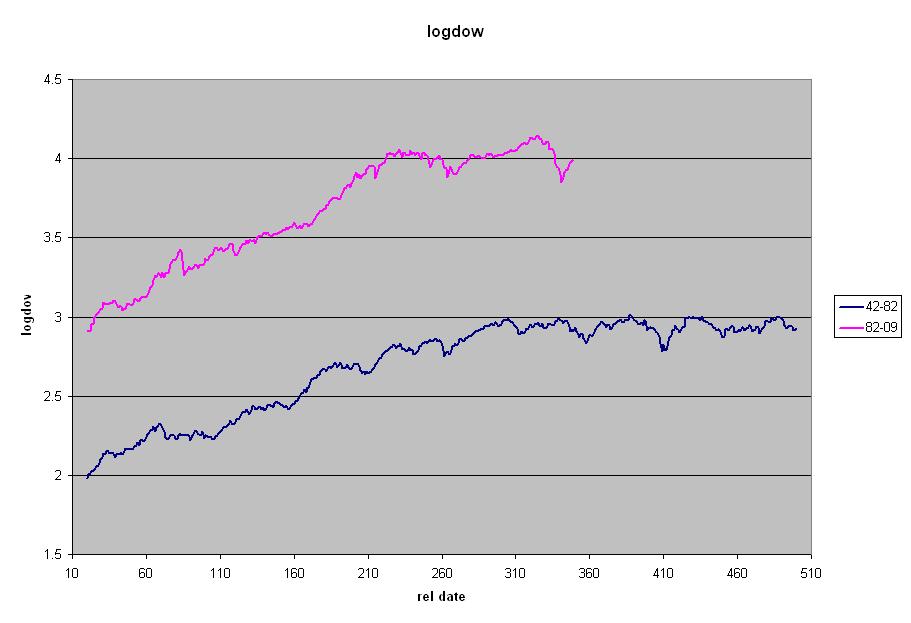
Charting A Previous Era, from Kim Zussman
November 14, 2009 | Leave a Comment
The attached chart compares log(DJIA monthly close) for the periods 1942-1982 and 1982-2009, transposed such that 1942 and 1982 start at the same point in time. "Relative date" axis is in months at the same scale for both periods. The "range-bound" period (and what a range it was) in the older series starts in 1965 and ends in 1982. Why did it end ? Presumably de-torporization via larger than life Paul Volcker, Ronald Reagan, Bill Gates, and Michael Milken.
Why 1942? It was a good starting point, as it was when Bogart made Casablanca. The era 1942-1982 could be called the era before financial engineering ("I am shocked to learn that there is gambling going on here, gambling on the value of mortgage backed securities").
Nov
11
How Now, Mighty Dow? , by Kim Zussman
November 11, 2009 | 1 Comment
Dividing DOW weekly closes into non-overlapping 25 week segments, I checked for large advances similar to now using:
{max close (recent 25W)} / {min close (prior 25W)}
Currently this quantity - the move to the high weekly close of the 25 weeks ending last week, compared to the low weekly close of the prior 25 weeks - is 0.51 (+51%). I checked back to 1929; there has not been a gain over 50% since 1983, then 1974, and in the 1930's (see attached).
Looking only at periods with gains >40%, here are the returns over the subsequent 25 weeks:
Date 25 max/min nxt 25W
02/19/34 0.960 -0.142
08/28/33 0.957 0.024
02/27/33 0.793 0.925
06/27/83 0.584 0.021
12/05/38 0.529 -0.072
10/27/75 0.512 0.197
01/20/36 0.498 0.116
05/05/75 0.454 -0.017
10/19/87 0.446 0.032
03/29/43 0.441 0.033
07/29/35 0.439 0.173
05/12/86 0.418 0.072
10/21/29 0.403 -0.024
. avg 0.103
Anton Johnson comments:
A quick look at all non-overlapping 25-week periods for weekly Dow 1929-Current yields a mean return of 2.73%; using this as the baseline results in a 7.56% excess return for the R>40% periods (10.29-2.73 = 7.56). However the 92.5% return in 1933 significantly skews the small R>40% sample. Median returns are 3.57% and 3.20% respectively, not much different from each other.
Oct
24
Political Science, from Kim Zussman
October 24, 2009 | 5 Comments
In his WSJ article this weekend, Prof. Boudreaux argues that insider trading shouldn't be illegal, as price-movement from such trading transmits better information about company value to the public. Presumably this also extends to legalizing burglary, as burglars perform valuable tests on home penetrability of use to homeowners not yet foreclosed on.
Relatedly, one thought the currently unfolding grand experiment in US socialism would have been considered bad for free-markets and the securities used to capitalize on them. Current and planned government control, confiscation, and regulation appears to be the biggest since the New Deal (bigger not adjusting for inflation). To put a little lip-gloss on this porcine, here is comparison between SP500 (via tradeable SPY, including dividends) weekly returns under Democrat and Republican presidencies since 1993 (Clinton + Obama so far, vs GWBush):
Two-sample T for DEM WK vs REP WK


.         N     Mean   StDev  SE Mean

DEM WK  457   0.0036  0.0228   0.0011  T=2.41 P=0.016

REP WK  415  -0.0005  0.0265   0.0013
Michael Moore would pop a suspender to learn that not only do stocks do better under recent Democrats, but ALL the positive returns since inception of SPY (Jan 1993) occurred under Clinton and Obama. Note, as is often the case, this happened with less volatility:
Test for Equal Variances: DEM WK, REP WK


95% Bonferroni confidence intervals for standard deviations

.          N      Lower  StDev   Upper

DEM WK   457  0.0212  0.022  0.024

REP WK   415  0.0246  0.026  0.028

F-Test (normal distribution)

Test statistic = 0.74, p-value = 0.002
How can this be? Shouldn't high taxes, government spending, socialized medicine, pay controls, huge deficits, and trading restrictions reduce profits and stock returns?
Then on this morning's run, the Homer Simpson (DUH) moment hit in the form of a question: Who does better as government deepens its grip on the means to production, and un-levels the playing field? Not the public - at least not mom and pop 401K. The smart people do better. The ones with the brains and resources to find loopholes in a byzantine regulatory and tax environment. Wall Street firms. Hedge funds. Large banks able to package off bad bets to taxpayers.
OK if that doesn't Liberate you, listen to this while thinking about who gets to pay for political bubble remediation:
Phil Collins: Another Day in Paradise
Springsteen/REM: Man on the moon
Alston Mabry replies:
I always thought it would be interesting to make insider trading legal, within a framework that included real-time reporting of trades made by those registered as "insiders". (And perhaps any employee of a company would be considered an insider.) Then the information contained in the trades would at least get transmitted to the markets quickly and overtly. You could extend it so this system would apply to any trades made by insiders in their industry.
Laurel Kenner notes:
The Loeb Award has been the most prestigious in financial journalism since it began in 1957. It's ironic that the founder's methods are now against the law…
Gerald Loeb, co-founder of E.F. Hutton, created the award to encourage methods that "inform and protect" individual investors. He himself relied almost exclusively on working his contacts for information. He would then publish the information for his clients. It's all there in his book, "The Battle for Investment Survival."
My goodness, how else are you supposed to get tradeable information? Are we all supposed to wait with our hands out for handouts? I guess that is the socialist model: handouts and no work.
Gordon Haave objects:
Legalize insider trading? Sure, in theory — but in reality nobody is going to play in a game where he feels his opponent has an edge on him. All you have to do to see how this works is to look at a place like Mexico [& many other emerging markets], where insider trading is rampant and blatant. The average person doesn't play.
Gregory Rehmke writes:
Some years ago Virginia Postrel argued that "insider trading" rules should be left to companies and to the various exchanges to decide. Exchanges will want to reassure investors and would fine members who broke the rules. I also think it is interesting that we only hear when "insider trades" make money. Such information is usually imperfect, so many trades based on this information lose.
Jul
3
The Professor of Randomness, from Kim Zussman
July 3, 2009 | 1 Comment
Good article in today's Weekend WSJ on randomness, by Caltech professor of randomness Leonard Mlodinow. Starts out relating the story of when Joe Dimaggio and his small eponymous son sneaked into Yankee stadium. When the crowd saw their sluggish hero, they began chants of "Joe! Joe! Dimaggio!", to which the little statistical blip (only four years old) remarked "see, they all know me!"
He then discusses the random aspects of hot-hands in sports, as well as Bill Miller's 15 year SP500-beating streak (which was 75% probable if random). The hard wired ego massage associated with financial success (see Herbivore Men of Japan) makes it hard to keep the genius in the bottle. I recall the thrill as an 18 year old arriving at a party, when unexpectedly greeted by a smiling beauty. Too good to be true, but for a brief moment; she was in fact waving at someone behind me.
The human big bang of money success creates its own space from nothing.
Apr
4
Ayn Refuted? from Kim Zussman
April 4, 2009 | 7 Comments
 Friday ended 4 consecutive up weeks, in DJIA comprising almost 21% gain. This came after a down week (-6% in early March, before super-heroes rescued the world).
Looking for patterns of a down week followed by 4 consecutive up weeks (DUUUU), the recent 21% is the third biggest up-move. Here are similar past moves in DJIA, along with the returns of the following 4 weeks:
Date DUUUU nxt 4 week
08/01/32 0.519 0.226
04/24/33 0.319 0.182
08/30/82 0.180 -0.019
11/19/28 0.146 -0.006
Fiat bail-outs appear to work, once netted against world wealth gain. Ayn refuted?
Mar
14
Do Markets Get More Volatile After Going Up? from Kim Zussman
March 14, 2009 | 2 Comments
One possibility is that markets get more volatile after they go up.
Using SPY (93-present), checked daily close-close returns, as well as range defined as (H-L) / (H+L)/2
Then sorted c-c returns into down or up, and checked the next day's range. Here is the comparison of mean range for days following those
either down or up:
Two-sample T for range nxtD vs range nxt U
N Mean StDev SE Mean
range nxtD 1872 0.0039 0.00309 0.000072 T=8
range nxt U 2187 0.0032 0.00230 0.000049
Indeed volatility after down is larger
To check whether the size of down or up moves has an effect on tomorrow's range, here is a regression of next day's range vs prior
day's return, just for prior days which were down:
Regression Analysis: range nxtD versus c-c D
The regression equation is
range nxtD = 0.00239 - 0.182 c-c D
Predictor Coef SE Coef T P
Constant 0.0024 0.00008 29.69 0.000
c-c D -0.1819 0.00623 -29.17 0.000
S = 0.00256647 R-Sq = 31.3% R-Sq(adj) = 31.2%
As expected, the bigger the down yesterday the bigger today's range. Here is the same regression, only for yesterdays which were up:
Regression Analysis: range nxt U versus c-c U
The regression equation is
range nxt U = 0.00250 + 0.0949 c-c U
Predictor Coef SE Coef T P
Constant 0.002498 0.00006 41.17 0.000
c-c U 0.094886 0.00503 18.85 0.000
S = 0.00213147 R-Sq = 14.0% R-Sq(adj) = 13.9%
So both for up and down yesterdays, the larger moves mean bigger range the following day. However the effect is more pronounced for down
days with 31% of variance explained vs 14% for up days. Of course
this can also be explained by persistence of volatility.
Mar
13
Do Bear Markets Exist? from Kim Zussman
March 13, 2009 | Leave a Comment
 Actually this is a tricky question: Even after defining a bear market, could a given decline have occurred by chance — given a random arrangement of returns? One aspect of a bear market could be down weeks clustering more than would be expected by chance, giving rise either to more frequent or deeper declines.
4194 DJIA weekly closes were partitioned into non-overlapping 40 week periods. At the end of every such period, calculated the maximum decline as:
min(this 40) / max (last 40)
Done this way the maximal decline could have been as long as 80 weeks or as short as 2 weeks; the idea was to capture large drops over various periods of interest to investors.
A simulation was used for comparison: The same 4194 DJIA weekly returns were resampled 100,000 times, and multiplied ("compounded", without dividends) out to produce a 100,000 week series. Like the actual market history, the series was partitioned into non-overlapping 40 week periods, and every 40 weeks min/max was calculated for the current and prior period.
One definition of a bear market is "a decline more than 20%". In the actual series, such declines occurred in (a surprisingly high) 26% of 40 week intervals (27 out of 104 40 week pairs). If this were more often than random, it would have occurred more often than in the simulated series. However in the simulation declines more than 20% actually occurred 32% of the time.
So if anything, declines of 20% or more occurred less often historically than by chance along.
But what if 20% is too arbitrary to capture a bear? In the actual series, here are the 40 week pair declines above the 95th percentile (ie, declines worse than 94.2% of the rest):
Date 40 min/max
06/20/32 -0.751
04/03/33 -0.642
09/14/31 -0.564
12/08/30 -0.542
03/02/09 -0.499
08/15/38 -0.469
The mean of these 6 40 week pairs is -58% (all but 5 from the depression). In the 100,000 week simulation, the 95th percentile is -34%. The actual 95th percentile and above mean of -58% is lower than even the worst simlated 40 week pair decline of -56%, which was the bottom of 2496 pairs (99.96 percentile, like the Obama cabinet SATs).
The worst 5% of actual 40 week pair declines dropped much more than would be expected by chance arrangement of down weeks. This is consistent with "fat tails" (at least on the downside), but you have to go out further than -20% to see it.
Alston Mabry comments:
Great study, Dr. Z. One thing I would want to explore would be whether in the simulation process, one intermixed different volatility regimes. That is, in the actual 4194 weeks, you may have periods of high volatility and periods of low. High volatility periods would have larger moves in absolute terms than would low volatility periods, and if the simulation mixed them together, the simulation might tend to produce lower volatility overall - this might account both for more 20% moves but fewer +50% moves. If this were a problem, one solution might be to normalize all the weeks against some preceding period, say 52 weeks.
Kim Zussman replies:
 Knowing that volatility clusters, if one is resampling a long data series this gets shuffled up. So you'll get 4% days near a bunch of 0.2% days (though the stdev of the whole series should be the same -shuffled or not). But if the question is whether the market has structure which is not random, does it make sense to stipulate whether you are in a volatile regime or not? Relatedly, maybe sticky volatile regimes translate to down markets, which is kind of the point.
Alston Mabry responds:
Exactly. To be precise, what I'm saying is that the fact that the simulated distribution produces more +20% moves but fewer +50% moves is simply an artifact of the shuffling process, especially when you shuffle individual weeks and then use 40-week stretches for calculating results. I'm thinking that the shuffling takes the actual distribution of % moves and increases the kurtosis and pulls in the tails.
This is not arguing against the hypothesis, just questioning that meaningfulness of the % comparisons.
Charles Pennington adds:
 One uncontroversial hypothesis that might unify and explain many of these studies is that "markets get more volatile after they've gone down".
If you compute the skewness of the weekly or monthly returns of the Dow since 1929, it's quite negative. However if you take those same returns and divide them by some measure of the volatility over the following week(s)(*), then you'll find that both the skew and the kurtosis are close to zero, i.e. it's similar to a normal distribution of returns. That means that someone trading backwards in time, i.e. he has next week's newspaper but not last week's, would experience safe, non-Black Swannish returns if he just adjusted his position size for the volatility that he had experienced in his recent future.
* for example, one might use the following week's high/low range, 100*(h/l-1), or the average of that quantity over the following N weeks, where N is "a few".
To illustrate, here is a model.
First, create a series of random normal numbers with standard deviation 1, with one number for each trading day.
Now, use the following rule: "If the average of the last three days' numbers is negative, then today's return is 2 times today's number. Otherwise today's return is 1 times today's number."
I ran 2500 simulated trading days using that rule, and it gave 715 5-day maxes and 622 5-day mins. That's similar to what the Chair reported for the market.
More generally, I suggest that whenever you see one of these apparent anomalies of "market falls faster than it rises", try to see if it can be distinguished from the uncontroversial hypothesis that "volatility rises following down moves".
By the way, over the past 10 years, the standard deviations of daily returns of SPY under two scenarios:
all days 1.39% after up three-day move only: 1.17% after down three-day move only: 1.61%
Kim Zussman replies:
The simulation made the skew and kurtosis go away. Here for the 40 day min/max both from actual series and simulation:
Descriptive Statistics: min/max, sim
Variable Mean StDev Min Median Max Skew
Kurtosis N
min/max -0.1435 0.1463 -0.7506 -0.1134 0.0313 -1.70 3.66
104
sim -0.1604 0.1008 -0.5576 -0.1504 0.0654 -0.53
-0.04 2496
Even accepting there could be non-randomly down markets, this is a different question than whether they can be predicted. So a small decline results in higher volatility, and trading smaller long positions can be on average profitable. But some of the small declines go on to become big ones, and its hard to tell one from another. Using stops (physical or otherwise) is tuchass saving, but it's hard to know whether "cutting your losses and let profits run" is worse in theory or execution. Which doesn't preclude that others can discriminate good from bad dips, or that they found work-arounds using opportunities independent of short term decline-reversal.
Phil McDonnell writes:
It may be helpful to look at the underlying hypothesis a little more closely. When we randomize by individual time periods we are deliberately randomizing any period to period dependencies. I presume that this was Dr. Zussman's point. Thus we are implicitly testing a null and alternate hypothesis something like:
Null: The original distribution or returns is similar to the distribution of a randomly ordered sequence of returns.
Alternate: The original distribution is not similar to a randomly reordered sequence of returns.
One good test of the difference between distributions is the non-parametric Kolmogorov-Smirnov test. Also one can use the more powerful D'Agostino test.
Another way to preserve the known autocorrelation in variance is to perform block resampling. From memory I believe the autocorrelation fades after about 35 days or so. Block resampling of 40 days should keep something like 97% of the variance autocorrelation and even other unknown dependencies even non-linear effects in that range. Comparing the distribution of the original returns to the 40 day resequence might tell us if there is something non-random even beyond the 40 day block level.
Dr. McDonnell is the author of Optimal Portfolio Modeling, Wiley, 2008
Mar
7
Four Down Weeks, from Kim Zussman
March 7, 2009 | 4 Comments
The DJIA has now gone down for four consecutive weeks after an up (UDDDD), and the total decline is about -20%. Looking back 1929-present, this decline of 20% is the 7th worst out of 104 instances of UDDDD.
What usually happens next ? X for UDDDDX was insignificantly negative:
Variable    N     Mean     StDev   SE Mean     95% CI             T      P

nxt wk    103  -0.0028  0.0328  0.0032  (-0.0091, 0.0036)  -0.85  0.398
And regressing next week's return vs return of prior 4 weeks suggests bigger declines do not make for a better return (see scatter diagram ):
Regression Analysis: nxt versus dn 4
The regression equation is
nxt = 0.00799 + 0.142 dn 4
Predictor     Coef   SE Coef     T      P

Constant   0.0079  0.0053  1.50  0.136

dn 4         0.1415   0.0563  2.51  0.014

S = 0.0320660   R-Sq = 5.9%   R-Sq(adj) = 4.9%
Mar
5
Curve Fitting, from Newton Linchen
March 5, 2009 | 9 Comments
 How can we avoid curve fitting when designing a trading strategy? Are there any solid parameters one can use as guide? It seems very easy to adjust the trading signals to the data. This leads to a perfect backtested system - and a tomorrow's crash. What is the line that tells apart perfect trading strategy optimization from curve fitting? The worry is to arrive to a model that explains everything and predicts nothing. (And a further question: What is the NATURE of the predictive value of a system? What - philosophically speaking - confer to a model it's ability to predict future market behavior?)
James Sogi writes:
KISS. Keep parameters simple and robust.
Newton Linchen replies:
You have to agree that it's easier said than done. There is always the desire to "improve" results, to avoid drawdown, to boost profitability…
Is there a "wise speculator's" to-do list on, for example, how many parameters does a system requires/accepts (can handle)?
Nigel Davies offers:
Here's an offbeat view:
Curve fitting isn't the only problem, there's also the issue of whether one takes into account contrary evidence. And there will usually be some kind of contrary evidence, unless and until a feeding frenzy occurs (i.e a segment of market participants start to lose their heads).
So for me the whole thing boils down to inner mental balance and harmony - when someone is under stress or has certain personality issues, they're going to find a way to fit some curves somehow. On the other those who are relaxed (even when the external situation is very difficult) and have stable characters will tend towards objectivity even in the most trying circumstances.
I think this way of seeing things provides a couple of important insights: a) True non randomness will tend to occur when most market participants are highly emotional. b) A good way to avoid curve fitting is to work on someone's ability to withstand stress - if they want to improve they should try green vegetables, good water and maybe some form of yoga, meditation or martial art (tai chi and yiquan are certainly good).
Newton Linchen replies:
The word that I found most important in your e-mail was "objectivity".
I kind of agree with the rest, but, I'm referring most to the curve fitting while developing trading ideas, not when trading them. That's why a scale to measure curve fitting (if it was possible at all) is in order: from what point curve fitting enters the modeling data process?
And, what would be the chess player point of view in this issue?
Nigel Davies replies:
Well what we chess players do is essentially try to destroy our own ideas because if we don't then our opponents will. In the midst of this process 'hope' is the enemy, and unless you're on top of your game he can appear in all sorts of situations. And this despite our best intentions.
Markets don't function in the same way as chess opponents; they act more as a mirror for our own flaws (mainly hope) rather than a malevolent force that's there to do you in. So the requirement to falsify doesn't seem quite so urgent, especially when one is winning game with a particular 'system'.
Out of sample testing can help simulate the process of falsification but not with the same level of paranoia, and also what's built into it is an assumption that the effect is stable.
This brings me to the other difference between chess and markets; the former offers a stable platform on which to experiment and test ones ideas, the latter only has moments of stability. How long will they last? Who knows. But I suspect that subliminal knowledge about the out of sample data may play a part in system construction, not to mention the fact that other people may be doing the same kind of thing and thus competing for the entrees.
An interesting experiment might be to see how the real time application of a system compares to the out of sample test. I hypothesize that it will be worse, much worse.
Kim Zussman adds:
Markets demonstrate repeating patterns over irregularly spaced intervals. It's one thing to find those patterns in the current regime, but how to determine when your precious pattern has failed vs. simply statistical noise?
The answers given here before include money-management and control analysis.
But if you manage your money so carefully as to not go bust when the patterns do, on the whole can you make money (beyond, say, B/H, net of vig, opportunity cost, day job)?
If control analysis and similar quantitative methods work, why aren't engineers rich? (OK some are, but more lawyers are and they don't understand this stuff)
The point will be made that systematic approaches fail, because all patterns get uncovered and you need to be alert to this, and adapt faster and bolder than other agents competing for mating rights. Which should result in certain runners at the top of the distribution (of smarts, guts, determination, etc) far out-distancing the pack.
And it seems there are such, in the infinitesimally small proportion predicted by the curve.
That is curve fitting.
Legacy Daily observes:
"I hypothesize that it will be worse, much worse." If it was so easy, I doubt this discussion would be taking place.
I think human judgment (+ the emotional balance Nigel mentions) are the elements that make multiple regression statistical analysis work. I am skeptical that past price history of a security can predict its future price action but not as skeptical that past relationships between multiple correlated markets (variables) can hold true in the future. The number of independent variables that you use to explain your dependent variable, which variables to choose, how to lag them, and interpretation of the result (why are the numbers saying what they are saying and the historical version of the same) among other decisions are based on so many human decisions that I doubt any system can accurately perpetually predict anything. Even if it could, the force (impact) of the system itself would skew the results rendering the original analysis, premises, and decisions invalid. I have heard of "learning" systems but I haven't had an opportunity to experiment with a model that is able to choose independent variables as the cycles change.
The system has two advantages over us the humans. It takes emotion out of the picture and it can perform many computations quickly. If one gives it any more credit than that, one learns some painful lessons sooner or later. The solution many people implement is "money management" techniques to cut losses short and let the winners take care of themselves (which again are based on judgment). I am sure there are studies out there that try to determine the impact of quantitative models on the markets. Perhaps fading those models by a contra model may yield more positive (dare I say predictable) results…
One last comment, check out how a system generates random numbers (if haven't already looked into this). While the number appears random to us, it is anything but random, unless the generator is based on external random phenomena.
Bill Rafter adds:
Research to identify a universal truth to be used going either forward or backward (out of sample or in-sample) is not curvefitting. An example of that might be the implications of higher levels of implied volatility to future asset price levels.
Research of past data to identify a specific value to be used going forward (out of sample) is not curvefitting, but used backward (in-sample) is curvefitting. If you think of the latter as look-ahead bias it becomes a little more clear. Optimization would clearly count as curvefitting.
Sometimes (usually because of insufficient history) you have no ability to divide your data into two tranches – one for identifying values and the second for testing. In such a case you had best limit your research to identifying universal truths rather than specific values.
Scott Brooks comments:
If the past is not a good measure of today and we only use the present data, then isn't that really just short term trend following? As has been said on this list many times, trend following works great until it doesn't. Therefore, using today's data doesn't really work either.
Phil McDonnell comments:
Curve fitting is one of those things market researchers try NOT to do. But as Mr. Linchen suggests, it is difficult to know when we are approaching the slippery slope of curve fitting. What is curve fitting and what is wrong with it?
A simple example of curve fitting may help. Suppose we had two variables that could not possibly have any predictive value. Call them x1 and x2. They are random numbers. Then let's use them to 'predict' two days worth of market changes m. We have the following table:
m x1 x2
+4 2 1
+20 8 6
Can our random numbers predict the market with a model like this? In fact they can. We know this because we can set up 2 simultaneous equations in two unknowns and solve it. The basic equation is:
m = a * x1 + b * x2
The solution is a = 1 and b = 2. You can check this by back substituting. Multiply x1 by 1 and add two times x2 and each time it appears to give you a correct answer for m. The reason is that it is almost always possible (*) to solve two equations in two unknowns.
So this gives us one rule to consider when we are fitting. The rule is: Never fit n data points with n parameters.
The reason is because you will generally get a 'too good to be true' fit as Larry Williams suggests. This rule generalizes. For example best practices include getting much more data than the number of parameters you are trying to fit. There is a statistical concept called degrees of freedom involved here.
Degrees of freedom is how much wiggle room there is in your model. Each variable you add is a chance for your model to wiggle to better fit the data. The rule of thumb is that you take the number of data points you have and subtract the number of variables. Another way to say this is the number of data points should be MUCH more than the number of fitted parameters.
It is also good to mention that the number of parameters can be tricky to understand. Looking at intraday patterns a parameter could be something like today's high was lower than yesterday's high. Even though it is a true false criteria it is still an independent variable. Choice of the length of a moving average is a parameter. Whether one is above or below is another parameter. Some people use thresholds in moving average systems. Each is a parameter. Adding a second moving average may add four more parameters and the comparison between the two
averages yet another. In a system involving a 200 day and 50 day
average that showed 10 buy sell signals it might have as many as 10 parameters and thus be nearly useless.
Steve Ellison mentioned the two sample data technique. Basically you can fit your model on one data set and then use the same parameters to test out of sample. What you cannot do is refit the model or system parameters to the new data.
Another caveat here is the data mining slippery slope. This means you need to keep track of how many other variables you tried and rejected. This is also called the multiple comparison problem. It can be as insidious as trying to know how many variables someone else tried before coming up with their idea. For example how many parameters did Welles Wilder try before coming up with his 14 day RSI index? There is no way 14 was his first and only guess.
Another bad practice is when you have a system that has picked say 20 profitable trades and you look for rules to weed out those pesky few bad trades to get the perfect system. If you find yourself adding a rule or variable to rule out one or two trades you are well into data mining territory.
Bruno's suggestion to use the BIC or AIC is a good one. If one is doing a multiple regression one should look at the individual t stats for the coefficients AND look at the F test for the overall quality of the fit. Any variables with t-stats that are not above 2 should be tossed. Also an variables which are highly correlated with each other, the weaker one should be tossed.
George Parkanyi reminds us:
Yeah but you guys are forgetting that without curve-fitting we never would have invented the bra.
Say, has anybody got any experience with vertical drop fitting? I just back-tested some oil data and …
Larry Williams writes:
If it looks like it works real well it is curve fitting.
Newton Linchen reiterates:
my point is: what is the degree of system optimization that turns into curve fitting? In other words, how one is able to recognize curve fitting while modeling data? Perhaps returns too good to believe?
What I mean is to get a general rule that would tell: "Hey, man, from THIS point on you are curve fitting, so step back!"
Steve Ellison proffers:
I learned from Dr. McDonnell to divide the data into two halves and do the curve fitting on only the first half of the data, then test a strategy that looks good on the second half of the data.
Yishen Kuik writes:
The usual out of sample testing says, take price series data, break it into 2, optimize on the 1st piece, test on the 2nd piece, see if you still get a good result.
If you get a bad result you know you've curve fitted. If you get a good result, you know you have something that works.
But what if you get a mildly good result? Then what do you "know" ?
Jim Sogi adds:
This reminds me of the three blind men each touching one part of the elephant and describing what the elephant was like. Quants are often like the blind men, each touching say the 90's bull run tranche, others sampling recent data, others sample the whole. Each has their own description of the market, which like the blind men, are all wrong.
The most important data tranche is the most recent as that is what the current cycle is. You want your trades to work there. Don't try make the reality fit the model.
Also, why not break it into 3 pieces and have 2 out of sample pieces to test it on.
We can go further. If each discreet trade is of limited length, then why not slice up the price series into 100 pieces, reassemble all the odd numbered time slices chronologically into sample A, the even ones into sample B.
Then optimize on sample A and test on sample B. This can address to some degree concerns about regime shifts that might differently characterize your two samples in a simple break of the data.
Mar
5
Quotes for Quants, from Kim Zussman
March 5, 2009 | 1 Comment
 John Von Neumann:
"With four parameters I can fit an elephant, and with five I can make him wiggle his trunk"
"You wake me up early in the morning to tell me that I'm right? Please wait until I'm wrong.[Note: the phone call in question took place at about 9:30am.]
"There's no sense in being precise when you don't even know what you're talking about"
"There was a seminar for advanced students in Zürich that I was teaching and von Neumann was in the class. I came to a certain theorem, and I said it is not proved and it may be difficult. Von Neumann didn't say anything but after five minutes he raised his hand. When I called on him he went to the blackboard and proceeded to write down the proof. After that I was afraid of von Neumann." George Pólya, in How to Solve It (1957) 2nd ed
And the most intelligent of all:
"With the Russians it is not a question of whether but of when. […] If you say why not bomb them tomorrow, I say why not today? If you say today at 5 o'clock, I say why not one o'clock?"
Mar
4
Counting Median Home Prices, from Phil McDonnell
March 4, 2009 | 2 Comments
 The current Administration is very concerned about the poor and the middle class. But little concern is expressed for the upper middle class or as the Administration likes to call them 'the rich'. One wonders if there is a downside to this asymmetric outlook.
About a month ago the National Association of Realtors again called for an easing of terms on the large jumbo mortgages. Their argument is that the upper end of the market has seized up. In fact the data bear this out. In the upper end very few homes are being sold because of the difficulty in getting financing. Only cash buyers are nibbling and there are very few of them.
For example in the Seattle market in some areas there are 30 homes for sale but only one will sell in a given month at the high end. At the high end prices are not necessarily coming down at the rate the Case Schiller index claims. The sellers are not making concessions on a comparable same house basis. Rather, what is happening is that they are financially able to hold on hoping for some light at the end of the tunnel.
So why is there a disconnect between what the Case-Schiller and other median type indices say and the ground truth? Let's take a simple example of a neighborhood with 5 homes sold at the following prices (in thousands of dollars) :
500
600
700
800
900
Median = 700
Let's say that was a year ago. Now pretend that the exact same houses are sold for the exact same prices with one exception. There are no transactions above 750 because of mortgage financing issues. So now we have only homes below 750 that are sold at the same prices at which they were purchased:
500
600
700
Median = 600
So comparing medians one might superficially conclude that in the last year that home values have dropped from 700 to 600. But we know that the prices in fact are unchanged from the year before. The point here is that the drying up of mortgage financing at the high end has created an appearance of a greater decline in real estate prices than has actually occurred. The fix is simple and obvious. We must relax rules on high end mortgages and allow that market to function again. The interesting thing is that it will reverse the statistical anomaly and create the perception of a real estate price increase. Most importantly it will not cost the government a single dime in bailout money.
Jason Thompson writes:
 As a prospective home buyer that has thus far legged the trade the right way, I've been doing a lot of counting in the arena of luxury homes — following the higher end of the market in my current locales, Chicago and Reno/Lake Tahoe, and a future destination, southwest Ohio. Though I'm leaving Chicago as I've tired of the nanny state and sky-high taxes (10.75% sales tax anyone, or how about a $125 dollar parking meter fine?) I admit I'm going to a place not much better, Ohio, though at least there I will be next door to my kin. While what Dr. McDonnell says about the state of the jumbo mortgage market and the lack of compromise on pricing back to reality is largely true, his observation that easing credit will fix this is not.
Rather, there has been a collapse in the pool of buyers, combined with a glut of custom built homes by small builders that have populated the exclusive suburbs of this country for many a moon. Further delinquency checks call in to serious question the belief that these "homeowners" (they don't own anything, rather are renting from creditors) have the staying power to remain in their homes.
One market I am now knowledgeable about is Indian Hill, the most exclusive suburb of Cincinnati. Median income is $188K per household (its $47K per for Ohio overall) and median home value was $1.1 million in 2007. There are around 6K residents, enough of whom wish to sell their house such that there are 338 listed homes or prepared lots (80% are completed houses). Based on 2008 sales levels, Indian Hill has 11 years of home inventory, yet based on transacted prices, "values" are only down 18% from 2007 levels which were in-turn flat to 2006. To me this is beyond nonsense, especially when some smart sleuthing can determine 90+ day delinquency rates for loans in the 45243 zip code is rising faster than the DJIA is falling. Market clearing prices are likely 30-40% lower, just to adjust to the wealth effect, not to speak of executive level job losses and the imminent sale/forced merger of FITB.
Albeit it is a sample of one market, but it is in the Heartland of America and as Ohio goes so goes the nation, no? What rose-colored glasses should I be using if above not correct?
Kim Zussman comments:
It's relatively easy to look up foreclosures/REO in your area of interest. Realty-Trac sells lists of these (notice they don't call it "Reality"), and the ghost of Countrywide has about 20,000 nationally:
Prices won't bottom until there is no one left with money or interest to buy, and judging by the size of the recent bubble that could take some time. The wealth effect should work both stocks –> housing and vice versa.
Upscale homesellers of coming years have the same problem as stock-invested boomers: sell to whom?
One can quibble with Shiller's methodology or his optimism, but he is certainly on the short list of market timers of the millennium.
Feb
14
Debubble Yo Hood, from Kim Zussman
February 14, 2009 | 9 Comments
 Robert Shiller updated his long series on real house prices (1890-Q3 2008). For today's exercise, using this data, I made the attached graph which currently shows reversal of about half the gain from 1997-2006.
Believers in over-reactions to the downside and history repeating might worry based on what happened in the past. There was a smaller bubble which peaked in 1894 at 124, and declined irregularly until bottoming at 66 in 1921 (47% decline over 27 years).
Surviving optimists might take heart from the 60% increase that occurred 1942-1947, which pulled back again but remained stable for decades.
David Riffer writes:
The thing that jumps out at me from this long term Shiller graph is that real house prices were roughly the same in 1988 as they were 100 years earlier. This cuts very deeply against the grain of conventional wisdom, but it is consistent with the seminal study by Piet M. A. Eichholtz that examined prices between 1628 and 1973 on the Herengracht in Amsterdam.
Feb
6
Deep Survival, from Mark Humbert
February 6, 2009 | 6 Comments
 An interesting article is "Deep Survival, who lives who dies and why" written by Laurence Gonzales. These 12 survival techniques are most definitely appropriate for these times of struggle for many:
The 12 Rules of Survival Laurence Gonzales, Based on his book Deep Survival (W.W. Norton & Co.)
As a journalist, I've been writing about accidents for more than thirty years. In the last 15 or so years, I've concentrated on accidents in outdoor recreation, in an effort to understand who lives, who dies, and why. To my surprise, I found an eerie uniformity in the way people survive seemingly impossible circumstances. Decades and sometimes centuries apart, separated by culture, geography, race, language, and tradition, the most successful survivors–those who practice what I call “deep survival”–go through the same patterns of thought and behavior, the same transformation and spiritual discovery, in the course of keeping themselves alive. Not only that but it doesn't seem to matter whether they are surviving being lost in the wilderness or battling cancer, whether they're struggling through divorce or facing a business catastrophe–the strategies remain the same.
Survival should be thought of as a journey, a vision quest of the sort that Native Americans have had as a rite of passage for thousands of years. Once you're past the precipitating event–you're cast away at sea or told you have cancer–you have been enrolled in one of the oldest schools in history. Here are a few things I've learned that can help you pass the final exam.
1. Perceive and Believe. Don't fall into the deadly trap of denial or of immobilizing fear. Admit it: You're really in trouble and you're going to have to get yourself out.[…]
2. Stay Calm – Use Your Anger In the initial crisis, survivors are not ruled by fear; instead, they make use of it. Their fear often feels like (and turns into) anger, which motivates them and makes them feel sharper. […]
3. Think, Analyze, and Plan. Survivors quickly organize, set up routines, and institute discipline. […]
4. Take Correct, Decisive Action. Survivors are willing to take risks to save themselves and others. But they are simultaneously bold and cautious in what they will do. […] They handle what is within their power to deal with from moment to moment, hour to hour, day to day.
5. Celebrate your success. Survivors take great joy from even their smallest successes. This helps keep motivation high and prevents a lethal plunge into hopelessness. […]Viktor Frankl put it this way: “Don't aim at success–the more you aim at it and make it a target,the more you are going to miss it.” […]
7. Enjoy the Survival Journey. It may seem counterintuitive, but even in the worst circumstances, survivors find something to enjoy, some way to play and laugh. Survival can be tedious, and waiting itself is an art.
8. See the Beauty. Survivors are attuned to the wonder of their world, especially in the face of mortal danger. The appreciation of beauty, the feeling of awe, opens the senses to the environment. (When you see something beautiful, your pupils actually dilate.) […] When Saint-Exupery's plane went down in the Lybian Desert, he was certain that he was doomed, but he carried on in this spirit: “Here we are, condemned to death, and still the certainty of dying cannot compare with the pleasure I am feeling. The joy I take from this half an orange which I am holding in my hand is one of the greatest joys I have ever known.” At no time did he stop to bemoan his fate, or if he did, it was only to laugh at himself.
9. Believe That You Will Succeed. It is at this point, following what I call “the vision,” that the survivor's will to live becomes firmly fixed.[…]
10. Surrender. Yes you might die. In fact, you wil die–we all do. But perhaps it doesn't have to be today. Don't let it worry you.[…]
11. Do Whatever Is Necessary […].
12. Never Give Up […] If you're still alive, there is always one more thing that you can do.
Survivors are not easily discouraged by setbacks. […]
© 2005 Laurence Gonzales Reprinted by permission of the author. All rights reserved.
Laurence Gonzales is the author of Deep Survival: Who Lives, Who Dies, and Why (W.W. Norton & Co., New York) and contributing editor for National Geographic Adventure magazine. The winner of numerous awards, he has written for Harper’s, Atlantic Monthly, Conde Nast Traveler, Rolling Stone, among others. He has published a dozen books, including two award-winning collections of essays, three novels, and the book-length essay, One Zero Charlie published by Simon & Schuster. For more, go to www.deepsurvival.com.
Kim Zussman writes:
Studies of characteristics of survivors suffer from survivor-bias; ie, you don't get to interview those who didn't survive, and thus cannot compare traits which favor survival. Even if there are traits which improve survival, they could be wholly or partly inherited: in which case you should feel purpose in your demise for enriching the surviving genome.
Dr. Frankl's observations come close (who fared better in concentration camp), but his own biases ("logotherapy") come out in the book. Here (wiki source) are tenets of logotherapy:
Life has meaning under all circumstances, even the most miserable ones. Our main motivation for living is our will to find meaning in life. We have freedom to find meaning in what we do, and what we experience, or at least in the stand we take when faced with a situation of unchangeable suffering
Not all philosophers will agree with these, and most biologists will say that the motivation for life is to project our DNA sequence into the future.
So when you're down 300%, you have to keep going to pay your daughter's tuition so she can become a desirable mate - and attract good DNA to mix with the bit of yours she has, to salt future clouds with your legacy worthiness.
Marion's study on risky mice and men shows the value of genetic risk-takers in both complex and immoral animals. Certain mice who venture out of their local habitat (meadow, log etc) risk death by starvation or predation - but may possibly find better sources of food, or more nubile mates. That a high % of such adventurers die trying isn't important in comparison with improving the species, and improving survival chances for future generations.
Feb
3
Dogma, from Kim Zussman
February 3, 2009 | 3 Comments
 Now that the assumption that 1930s markets would never repeat was wrong, academics will have to start over:
Dollar cost averaging vs all in at 8X leverage.
Stocks for the long run.
Real estate never goes down.
10% down on house doubles your money quickly.
Buy dips because they sometimes reverse.
How many asteroid collisions in a normal distribution.
You can't time the market but it is better to skip crashes.
Buy and hold this.
The miracle of compound what.
Small stocks are good because they were large banks.
High dividend yield is a tumor marker.
The trend is your friend until you both end.
Safe mortgage investments.
Self-directed retirements.
Calpers.
Retire this.
Prosperous Iceland.
Free markets work best because Ayn never experienced one.
Yes we can.
Jan
30
Strange Headlines, from Vince Fulco
January 30, 2009 | Leave a Comment
 There is headline after headline about the commodity houses, like Koch Trading et al. getting long the underlying (talk at the time was low 50s) and having the deep pockets to carry six months or longer.
It strikes me as a bit strange since how often is the media ahead of the big trading wins? Maybe it is as simple as that this time around.
Kim Zussman writes:
Lots of moves obvious in hindsight are just too painful/risky to hold. One recalls certain home-builder shorts ca 2004-2005, which rose substantially before ultimately doing what was expected (of course after the positions were closed).
One definition of successful active investing is funding your conviction, and holding on through destructive price action until you are either rich or ruined. Survivor bias of war heroes, etc.
Jan
27
National Service, from Scott Brooks
January 27, 2009 | 3 Comments
 The fact that our lives belong only to each of us individually is completely lost in this political environment. The most patriotic thing any of us can do to benefit our country is go out and get a job on our own, do great work at that job and improve our lot in life.
Then if we choose to, we can give back in whatever way we chose.
For instance, you become successfully self-sufficient and raise a family that grows up to do the same.
You could volunteer and teach people how to fish (as opposed to the government that gives them fish or, in the case of this misguided idea of "national service", forces them to fish).
You could further your education.
But at no point, ever should you be a burden on society or expect society to anything other than what the Founders intended (society being the government). If you're a child, you get a pass… except that you must work constantly to educate yourself and develop a good work ethic.
If you are physically or mentally unable, you get a pass and charities or family will care for you (believe me, it doesn't take the government to do it… you'll be surprised at just how generous people will be when they don't live under the oppressive rule of the government that encroaches further and further into their lives and finances.
It's time we do something in this country that has never been tried: laissez faire politics. Busybody politicians do not know what's best for me and my family.
Kim Zussman looks at the investment implications:
 OK but 'splain me this: If free markets reward hard work, independence, and innovation, why should one work hard when the markets become unfree? Many folks paying usury taxes on their marathon efforts might resent decreed redistribution of the fruits of their labor "putting America to work" (whether they can or not, qualified or not, want to or not). If the hard workers pull back, and the soft workers get softer, fiat monetas vaporis.
Increasing socialism is very bearish.
Pitt Maner III adds:
A couple of forthcoming books — no doubt timed for the New New Deal — make the opposite argument: irrational and animal-spirited humans need government intervention.
Free Market Madness by Peter A. Ubel
"What’s wrong with free market theory? It doesn’t take into account our human nature. We humans aren’t entirely rational creatures.[…] All too often our subconscious causes us to act against our own self-interest. Yet our free-market economy is based largely on the assumption that we do act in our own self-interest. In this book, I argue that the combination of human nature and free markets can be downright dangerous for our health and well-being. That government must step in and further regulate the markets[…]".
Animal Spirits: How Human Psychology Drives the Economy, and Why It Matters for Global Capitalism by George A. Akerlof and Robert J. Shiller
"Like Keynes, Akerlof and Shiller know that managing these animal spirits requires the steady hand of government–simply allowing markets to work won't do it. In rebuilding the case for a more robust, behaviorally informed Keynesianism, they detail the most pervasive effects of animal spirits in contemporary economic life–such as confidence, fear, bad faith, corruption, a concern for fairness, and the stories we tell ourselves about our economic fortunes–and show how Reaganomics, Thatcherism, and the rational expectations revolution failed to account for them."
Stefan Jovanovich concludes:
 As with most "debates", this one has the fix put in with the premise. (No wonder the citizens of Athens got so tired of the Socratic method that they asked its creator to take a walk.) Neither Ronald Reagan nor Margaret Thatcher thought that liberty = perfect rationality. No one who spent most of a lifetime working in Hollywood or being the only woman in the meeting could think that even imperfect rationality had much to do with human conduct. (No wonder they liked and respected each other.) Mr. Ubel creates the same egregiously phony straw-man by his thesis that the "free-market economy" is based on the "assumptions that we do act in our own self-interest." Markets are never "free"; there is always a house and usually someone has an assured position at the rail. Yet, even with their corruptions, the uncompelled exchanges between private parties still work far better than any prescriptive allocations determined by the people with the best transcripts. Even a little bit of liberty works far better than the pure hierarchies of authoritarian structures. What really screws things up is when the people who benefit most directly from government interventions completely rig the game and call it a collective good. Mr. Ubel's use of the universal academical "us" - "human nature and free markets can be downright dangerous to our health and well-being" - is the classic aggregation fallacy that makes so much of economics remind me of Tennessee Williams's best line ("File this under C for crap").
You had it wrong, Mr. L. The first thing to do is kill all the preachers of the economic doctrine who never have to worry about the actual cash market for their wisdoms. Or, even better, don't kill them and make them get by on their royalties from writings other than the required text books. Without the state-sponsorship of their compulsory indoctrination of the collective "us", the lawyers would hardly be much of a threat.
Sorry for the rant, Pitt; I will now retreat to my private, unmortgaged cave and consider why my nature remains so persistently unable to see the obvious benefits of Fannie, Freddy and the future Maes now working together to build a "more robust, behaviorally informed Keynesianism".
Jan
17
Rolling Ten Year Returns, from Kim Zussman
January 17, 2009 | 2 Comments
There is a long SP500 monthly series on Shiller's website, which I used to compute the 10Y rolling returns (for the 10 years ending at the present) from 1880-12/2008. I did not attempt to factor in dividends (which were significant once upon a time…), and keep in mind it was hard to "hold the index" until Jack Bogle came along. Nevertheless…
The enclosed chart shows that rolling 10 year returns are negative now as they were for (approximately) 1974-82, 1932-47, 1914-24, 1890-98, and 1884-5. If you advance these dates by ten years and look again at the chart, you would be tempted to conclude that the subsequent 10 year returns were strong.
Also interesting to note an apparent pattern in the wait time between peaks in 10Y return:
1887-1906 (19Y)
1906-1929 (23Y)
1929-1959 (30Y)
1959-2000 (41Y)
The second wait is 4y longer than the first, 3rd 7y longer than 2nd, and 4th 11 yrs longer than 3rd. It is tempting (again) to compare the elongating waits between 10Y peaks with concurrent increasing life-expectancy:
This table compares waits with (midpoint) life expectancy (for white males, of course):
This whole investigation was pursuant to an academic paper suggesting increased risk-aversion for people who lived through bad markets: Do Macroeconomic Experiences Affect Risk Taking? by Malmendier and Nagel. Eventually the risk aversion decreases again through (ahem) natural population replacement.
Phil McDonnell comments:
Although there are only five complete cycles, I note that each speculative cycle is increasing in amplitude as well as increasing in period.
Dr. McDonnell is the author of Optimal Portfolio Modeling, Wiley, 2008
Jan
9
Job Description, from Michael Cook
January 9, 2009 | 1 Comment
Of info I am a font –
More than you probably want –
I'll give you advice
It will be quite precise
And some of it quaintly quant…
I also discuss finance theory
until your eyes grow bleary
from CAPM to Black Scholes
I stress risk controls -
but I always try to be cheery.
Our goal is to beat a bench -
but according to Fama and French
we'll probably lag -
(a bit of a drag
when our clients decide to retrench).
We cannot believe this is true -
we're stock pickers through and through
though we think we have found
that returns will compound
more, if we keep risk in view.
We aim to be more than lukewarm,
while taking less risk than the norm.
You can't tell in advance
if it's skill or it's chance
if we do or do not outperform.
What else can I say to you?
to help our assets accrue
I simply observe
the Gaussian Curve
in everything that we do.
Kim Zussman writes back:
That last ad made me Mad
The premise - it was Off
A dance around the mean?
That makes this rabbi cough!
I promise not an average
Convergence to the mean
Just modest up returns
In good times and in lean
You're lucky to invest here
At my firm no arms wave
Because we make the markets
We know how they behave
You'll have to think a while
Before I'll take your money
It will stay in the family
Just you and me and sonny.
Jan
8
The Last Lecture, from Victor Niederhoffer
January 8, 2009 | 17 Comments
 If one were to deliver a last lecture like Randy Pausch, what would it be like? I'd start with trying to prolong life. It's terrible to die at an early age like he did, and there are many things that a person can do now to prevent it. Let's start with the Mediterranean and Okinawa diets and statins, Tagamet, and nsaids like Vioxx and Celebrex. In addition to the added time to enjoy and liquify the wealth, this gives one the power of compound interest.
The second thing I'd say is always be aware of deception. The market is at least as smart as the caterpillar which has a hundred ways of deceiving its predators. A good understanding of deception in nature, and models that go into first, second and third level deception in various games is a good start.
The third thing is similar to Randolph's head fake thing and is contained in Liddell Hart best. The power of indirection. A frontal attack is often met by the adversaries best defenses. It wastes too many resources. Absolutely essential is to divide and conquer.
The fourth thing is to develop a good character. All your faults will come out in the market. and if you are a chronic complainer, or liar, or compulsive gambler, or procrastinator, the market will ferret them out and do you in.
The fifth thing is to always be humble. The market is so smart, so changing that to think you ever have the answers for too long, is certain to lead you to be behind the eight ball when things change.
The sixth thing is to develop good fundamentals. Randolph says that he likes to use football analogies and to get a good three point stance and to play well without the ball. I'd go back to coach Wooden and start with washing the hands, and putting on the socks, and keeping your execution costs low, and making sure that you don't pay too high a cost in promotion or that you're carrying too many people on your shoulders who aren't paying an appropriate part of the passage.
The seventh thing is to learn how to count. Too many people are prey to wishful thinking and an inability to distinguish regularities from randomness too many are subject to real psychological biases, (not the ones talked about by the Nobelites) to think that you can overcome them without some hand studies and calculations of variability.
The eight thing is to learn how to handle failure. It's bound to happen, and you have to learn from it.
The ninth is to read good books. We have many that we recommend on this site.
The tenth thing is like Shakespeare to suit your apparel to your position, and to suit your positions to your size so that you don't get in over your head.
The eleventh thing is to have some escape hatches and contingency plans i.e. the mouse with one hole is quickly cornered or as Randolph says, what happens if the wolves are after you. I could go on and on, and perhaps I will but I"d like to get your insights on this.
Valery Kotlarov comments:
I’d take the best of the best writers and begin with something like what Kurt Vonnegut said here. I love every book he wrote, and the most important thing that I took from them is the fun– that every situation in life can be so comical and funny, so we should never take anything too seriously. As humans, we are driven by language, and sometimes it’s funny what one can understand from the same sentence or even word– something totally different from what another would understand. Also, I’d speak about the charismatic and optimistic personalities, like Ayn Rand. I’d mention the legendary people. I’d also speak about the bank robber, whatever his name, just to show that success is something that we can create and follow, but we should never be slaves of it, or friends of it.
When I was in Turkey, I heard that many families build homes for themselves. Each year, they build it higher and higher, step by step, so in a few years they get a warm house. And I’d speak about some of the greatest inventors like DaVinci, Edison, Tesla, Archimedes, and what they did to show the achievements and that dreams can come true. I’d take some of the Gregory Bateson’s ideas, and emphasize that the ideas and dreams are things we are made of. And from here again to Vonnegut: “We are what we pretend to be, so we must be careful about what we pretend to be.” And, well, I’d also emphasize reading and learning– the importance of it, and to try make fun of it all–life, whatever it is. Also I’d never think or call it my last lecture, just too optimistic for that, even if 99% of facts would point that it is (gimme events not the descriptions) Last, I’d buy some S&P or other stocks of healthier, economologically speaking, countries, and give it to someone I love (so he or she could only use it after some 15-20 years.)
Nigel Davies writes:
There's only one major addition that I can think of, and that's the importance of having a higher purpose or mission in life. This is something that all the great people in history have in common, whether it's 'queen and country' (e.g. Nelson), 'the truth' (e.g. Galileo) or helping others (e.g. Mother Theresa). This could even be the biggy, the one that holds other principles in place.
GM Davies is the author of Play 1 e4 e5: A Complete Repertoire for Black, Everyman, 2005
Victor Niederhoffer adds:
Find a good mentor. You can ride on their shoulders and they will achieve immortality and pay back for the mentoring they received through you. But by the same token, never take a tip from anyone, a trade for the day, because you won't know if it fits in with your persona as it did with theirs, and you'll never know how strong their convictions are, and when they change them, and you'll be weak.
Be optimistic. Nothing good has ever come to those who hope for the destruction of civilization or the market or who fight the upward drift which must continue up to follow the strands of human progress, which is still grand, even today especially if you consider all the individualism unleashed on the world in India and China.
One of my mentors, Dr. Raymond Chang, says that the best meal for a lifetime he knows is to take a vitamin D3 Supplement each day, and I would add it to the list. Exercise is always helpful as it prolongs the life, and eases the tensions, and improves the digestive process, and makes you look better, thereby attracting better mates, and mentors, and is in keeping with the fundamental nature of humans, which involves play and sympathy.
Family. The people that you can always count on are your extended family, and the more you use this to support you, the better you'll be. Conversely, be aware that most of your non-extended family, except for your very good friends, can never be trusted to support you when you need it the most and indeed are likely to disappoint you over the long run.
Friends. Friendship based on business is always better than business based on friendship. I would augment my little thing about deception above by saying that one should always beware of the negative lie as a tool of deception. The thing where the deceiver tries to say something bad about himself so as to get you off your guard so he can go in for the big kill. I was interested in this regard to see that the French firm that killed itself out of honor on the Madoff matter was taken in by the very self deprecating manner in which B. M. told them that he once lost too big while his kids were tugging at his coat, and telling him not to help others, when he tried to intervene with big bucks against his kids advice. It is interesting how the kids "apparently" did not tug at his coat vis a vis any of his other less noble activities.
Stephen Stigler comments:
That is a good list, although I'm tempted to repeat a comment of my father's, "There are not ten good reasons for anything." Which would suggest focus and priorities.
James Sogi adds:
Do what you love. Love what you do. Don't do what you hate. Many people will tell you what to do. There are social and family pressures, some hidden. Follow your own agenda. Trade your own style. You can't follow someone else's style. It won't fit, and you will lose money. Trade and make money the way you know how, they way that is comfortable to you.
Spend time with your family. As Vic says, no one but they will really be there when your really need them. There is not much time, and it will soon be gone. Spend time with them.
Kim Zussman writes:
Regarding Vic's "fourth thing," use the market-mirror for self-diagnosis, but never rule out the possibility that your condition (you + the market you're in) could be pre-malignant and require complete excision.
Laszlo Birinyi comments:
There are two things I would add. One, read different books and develop breadth. Drucker amazed me in school because he could illustrate ideas from history, literature, life and whatever. I encourage my kids to take courses in Arab culture or Norwiegen or whatever, not just literature and art which are their major interests.
Second, learn to listen. I find at bonus time everyone has inflated opinion of their contribution. I did well in my career because I never argued with my bosses. If they paid me x, my contending that I was worth 2x wasnt going to fly. If it was .5x (fortunately it never was) that was a signal to shape up.
David Brooks writes:
All of Victor's ideas about ways to prolong our mortality are right on. I particularly like the comments about deception, because I have always believed that one of the things that differentiates excellent surgeons from merely good surgeons is the ability to see things that others don't, such as tissue planes, obscure vessels, the deceptive picture that disease often presents.
Jan
4
Love and Trading, from Jim Sogi
January 4, 2009 | 10 Comments
 The most powerful kind of love is the love that is not self centered, but goes outward. This kind of love can take many forms such as the love of knowledge, compassion and empathy towards others, the love of nature, love of one's profession and work, or the love of art. In some respects one can love the market as a love of knowledge.
I disagree with the oft used characterization of the market as 'mistress'. That definition embodies and emphasizes more tawdry, baser instincts in the relationship. It is an erroneous anthropomorphication and an unhealthy relationship. Empathy is one of the elements of love. Empathy can be used to understand the herd's motivation to profit in the market. Love enables late nights, long hours and tedious computations. Love is power. Love creates power and that is why it is the greatest of all.
Jeff Watson adds:
I'm so glad that the holiday season has passed, as all of the commercialized sentimentality tends to give me a case of a sour stomach and the need for a strong bromide. Holiday cheer is supposed to allow one to demonstrate love for his fellow man, and a person is supposed to show this love by purchasing as much swag as possible to keep the holiday numbers strong. To all of this, I have to agree with Dickens and say, "Bah Humbug." Not to say that I have anything against love, but love has some psychological components that should be examined. Love has been shown to be a mammalian trait, much like hunger or thirst. Psychologists state that there are different stages of love in an interpersonal basis that include lust, attraction, and attachment. These stages can be overlapping and all involve the chemistry of neurotransmitters in the brain and other endocrine glands. Some theories about this misunderstood phenomenon also state that love is composed of three components that are intimacy, commitment, and passion.
While it is all good that psychologists have done exhaustive studies of love, it is my contention that self delusion is a major component of what we call love. When there is that initial attraction between two people, only the good sides are shown, and one only sees an incomplete picture of what the other person is all about. The mind makes up an idealized model of the other person, ignoring all of the other characteristics that could cause one to change one's mind.
Love happens to be a very irrational concept, although it's worked since time began. Love has been the subject of writers from Shakespeare and Ovid, to Danielle Steele and a hundred other cheap romance writers. Love happens to be big business, in fact it's a multibillion dollar business. It would be a tough calculation to determine the amount of our GDP, that is a derivative of love.
Love happens to be a very bad thing for speculators or any traders for that matter. When one falls in love with a position, irrationality takes over, and one only sees the idealized position, not the real one. When one loves one side of the market, whether it be bullish or bearish, all other rational arguments fall upon deaf ears. When one loves a particular method of trading… a style, one might not see that the method has become unprofitable before it's too late. Love will keep one going back to the same mistakes, all irrational of course, but that's what happens sometimes. One might fall in love with the Mistress of the Markets, and feel a strong desire to be at her side 24/7, and always have a position on. Spending all of one's time in the market courting the Mistress, carrying a position, can spell financial doom. I'm sure that a hundred different analogies about the detrimental effects of love regarding trading could be listed, and this short list is by no means complete. I will admit that I feel a lot of love in my heart for friends, family, and my country. I will also admit that I've felt love in the markets before and paid very dearly for that love. Since I've gotten older, the best trading lesson I've finally gotten after all these years is the lesson of a dispassionate attitude, not love.
Kim Zussman writes:
 A man walks into the market, and asks, "What kinda Gin ya got?"
She replies, "Oxygen, Nitrogen, and Estrogen"
It seems no accident to refer to the market's alluring, seductive, narcotizing, hypnotic, deceptive, convoluted, torturous, capricious, punitive, empty, destructive path as "mistress". Not just any mistress; but that just ripe girl with a perfect body, blemish-less skin, and crystal eyes that smile with love just for you. Until you grow to need it.
How do you dally with her without falling in love? As Jeff says, love is the point beyond which ruin no longer matters. If you can be intent enough to see it coming, can you be strong enough to resist the temptation of heroic sacrifice?
Maybe it takes a good lady's man. Presumably the guy who can take it right to the edge, make her believe, but hold back enough of himself to walk away unscathed at any moment. See Casanova.
Dr. Janice Dorn observes:
 In my experience, one approaches the study of the markets, the long hours, the tedious computations with a sense of passion. People truly fall in love with the study of the markets and the attempt to make sense of them. Perhaps it is the challenge of attempting to understand or explain that which can possibly be understood or explained after the fact — not before.
First Corinthians 13: 1-13 says that — of faith, hope and love — the greatest of these is love.
In the actual trading of the markets, there is no place for faith, hope or love. Markets are not entirely rational and not entirely random. They hold out hope and dash it. They hold out faith and dash it. One can fall in love with the idea of trading until your real money in on the line. Then, the mean markets show themselves and love turns to fear and loathing. Certainly, one can use the concept of empathy to understand the motivation of the herd to profit in the markets. The herd needs empathy because, for the most part, the herd loses.
The markets are neither friendly nor loving. This is a game where some 60 million people compete everyday to take your money before you take theirs. If love is truly a battlefield, there is no better place to find the battle than in the markets.
The markets demand humility, they demand gratitude, they demand that one approaches each day as a loser.
I challenge anyone who actively trades these markets every day to tell me that they are not a demanding mistress, that they are not there to take as much money from as many people as possible or that they are loving and kind.
Paolo Pezzutti adds:
The relationship between love and passion is interesting. A sane passion helps you reach significant results and objectives. You do not have great objectives if you are not a dreamer, and somehow an irrational component in these endeavors is always involved. Markets are not loving and caring, but you can actually love the way they are structured and twork, and how they surprise investors with sudden and unexpected moves which systematically trap the herd on the wrong side.
You can love the long and patient endeavor to discover hidden inefficiencies and short term behaviors due to specific and repetitive moves of certain participants in the markets. However, love must not be confused with obsession. In this regard, the initial phase of a relationship is characterized by an instantaneous attraction. This phase can be replaced by an anxious and obsessive phase, characterised by an unhealthy attachment possibly overwhelming your life. The final destructive phase may involve extreme feelings of self-blame, anger, and desire to seek revenge. Markets are a fascinating expression of social behavior. The emotional behavior and the ever-changing characteristics and number of participants makes them so complex and quite unpredictable. But the feelings that participants in the markets can have are quite similar to those in a relationship. The post Lady in Sorrento I wrote back in November is about this.
Dec
25
X-mas Bored Game, from Kim Zussman
December 25, 2008 | Leave a Comment
 Start with 10 companies, each with 100 shares worth $1 each. Each player starts with $100. Player 1 rolls dice, and can choose to buy as many shares as they can afford of company # (# = numerical roll of dice) from the IB.
The price of shares in each company starts at $1, but once a player owns some of it, the price to new players increases: to $2 once 20% of shares owned by players, to $3 once 30% of shares owned by players, to $4 once 40% of shares owned by players… to $10 once 100% of shares owned by players.
If player X wants to buy shares of company Y, and some or all of Y shares are owned by other players, the owning players can choose to sell their shares.
After a few rounds, shares in the different companies are worth different amounts depending on buying by players. A player's "Net worth" is sum of a current share values + cash. Rolling "mammaries" (double 1's) is a divorce: give half your net to the nearest female player, and pay her 50% of your cash after each time you roll. The winner is the player with the highest net worth on "retirement". Retirement occurs 2 hours after the game started, or when all the Wassail is gone –which ever comes first.
Dec
18
Either/Or, from Kim Zussman
December 18, 2008 | 1 Comment
 If I may paraphrase something Doc Castaldo once wrote, "Whether or not you have a position, you have a position."
One of the simplest forms of this occurs in relation to markets: Assuming one has $ome discretionary capital (or can borrow it), it can be spent or invested many ways. Or kept under the mattress (assuming one has a mattress). If you choose to keep it in a money-market account, that is the same as choosing not to invest it other ways, and miss the next move in (say) stocks.
Of course the same holds for whether to keep various positions, vs close or add to them.
This can be extended to life in general; where (for example) each day you can choose to be loyal to your spouse (or not), stay at your job, exercise, further your education, etc. Each is a kind of binary yes/no decision, with large ramifications compounded into the future, which are make on a daily basis.
Dec
5
Girls and Boxing and the Market, from Paolo Pezzutti
December 5, 2008 | 2 Comments
 Many years ago I wanted to date a friend of mine. When I called her, sometimes she was nice and would talk. This gave me hope. The same hope you have when markets rebound after a sell off for a few sessions even with light volume. Sometimes she would tell me: "Call me back in five minutes. I am doing something very important." When I called back after five minutes, she would not pick up the phone. Or if she finally did, she would say: "Sorry. I am leaving now. Can you call me this evening?" When I called her later, I wouldn't simply find her at home, she would be busy brushing her teeth or shampooing her hair. Eventually I didn't succeed in my efforts and I gave up. Low after low, rebound after rebound, you refuse to accept that you are in a bear market. You keep on insisting as stubborn as ever. And your losses mount. You refuse to see signals that are very clear to those not emotionally involved in the situation. And you average your positions as prices go down, with horrible outcomes. As if, in the case of my girlfriend's story, hope resulted in a mortal disease.
At the same time, I like to remember the epic fight between Rocky Balboa and Lang. Rocky was feeling the pain of his opponent's tough punches. Lang said: "I'm gonna torture him. I'm gonna crucify him. Real bad." Rocky replied: "You ain't so bad, you ain't so bad, you ain't nothin'. C'mon, champ, hit me in the face! My mom hits harder than you!". Lang expended his energy trying to knock Rocky out. Rocky eventually retaliated and knocked the confused Lang out with an impressive counter-attack. The 9% plunge few days ago hurt me much less than the downtrend did back in October. Eventually you get used to these plunges. You get prepared to expect very negative events. Hopefully bears will get exhausted like Lang did and we will eventually see higher prices and a trend reversal. The selling pressure at a certain point will ease and the bulls will prevail with a fast and sudden counter trend as Rocky came back and surprised his opponent.
Kim Zussman comments:
It's hard to imagine that most traders can discern random from non-random, not to mention that even scientists have trouble with the subtleties (pertinent variables, sample size, learning set selection, multiple hypotheses, causation vs. association, etc.).
Another way to assess this is whether statistically astute traders do better (under all market conditions) than innumerates.
Dan Grossman remarks:
Regarding the girlfriend story, it is a principle of behavioral psychology, and gambling, that random reinforcement is highly addictive.
Victor Niederhoffer replies:
One should carefully consider whether there is any evidence that random reinforcement is better than systematic reinforcement or punishment in inducing behavior. The evidence is very mixed and inconclusive last time I studied it.
Gibbons Burke writes:
The wikipedia article on Operant Conditioning in a sub-article titled Reinforcement provides a decent trailhead to further references, as well as criticisms:
Effects of different types of simple schedules
• Ratio schedules produce higher rates of responding than interval schedules, when the rates of reinforcement are otherwise similar.
• Variable schedules produce higher rates and greater resistance to extinction than most fixed schedules. This is also known as the Partial Reinforcement Extinction Effect (PREE)
• The variable ratio schedule produces both the highest rate of responding and the greatest resistance to extinction (an example would be the behavior of gamblers at slot machines)
• Fixed schedules produce 'post-reinforcement pauses' (PRP), where responses will briefly cease immediately following reinforcement, though the pause is a function of the upcoming response requirement rather than the prior reinforcement. • The PRP of a fixed interval schedule is frequently followed by an accelerating rate of response which is "scallop shaped," while those of fixed ratio schedules are more angular.
• Organisms whose schedules of reinforcement are 'thinned' (that is, requiring more responses or a greater wait before reinforcement) may experience 'ratio strain' if thinned too quickly. This produces behavior similar to that seen during extinction.
• Partial reinforcement schedules are more resistant to extinction than continuous reinforcement schedules. • Ratio schedules are more resistant than interval schedules and variable schedules more resistant than fixed ones.
Nov
29
On Pricing, from Kim Zussman
November 29, 2008 | 1 Comment
 Here is a paper showing different buy/sell activity for stocks as a function of digit of price:
It contains a chart quite similar to the one above, which I made using data a real-estate agent shared on the local housing market over the past year, including listing price, sale price, days on market, and selling agent commission.
I tried to address a question related to choosing a listing price. Often when someone wants to sell something for $100, he might price it $99.95 or $98.50, etc., under the theory that people will think "ninety-something" instead of a hundred, and be more tempted to buy. The chart seems to show that people do this with house listing prices too.
To check this, I used the listing prices for homes ranging from $400,000-$999,999, and adjusted them such that the data was moot in the 100,000 column; they were all $9XX,XXX, and binned. For instance 495000 became 995000, 675000 = 975000, 825000=925000, etc. This way I could look at where people priced their homes in the ten-thousands column, regardless of the hundred thousands column (which was adjusted to 9).
Above is a dot-plot showing the frequency of prices in the various 10,000 bins. It is a "bimodal" distribution; people were more likely to price at or above 90,000 (in the ten thousands column), and near the 50,000 level. This confirms the effect alluded to earlier, because of the huge peak in the 90,000 area which dwarfs the 10,000 band. This and the peak around 50,000 bears a resemblance to what was found in stocks.
Adam Robinson writes:
 Dr. Zussman's reference on pricing reminds me of the notion of price points: discrete (rather than continuous) pricing "bands" that once "entered," a person is willing to go to the next higher band. (E.g., once a person is willing to pay more than $10 for an item, he's willing to pay $14 — so it would be foolish to ask for $12. Kind of like quantum levels for electrons.) If you examine random price offers, which are tested to death by direct marketers, they cluster around these price points.
Also, for some quirky reason, prices ending in a "7" draw much higher response than any other digit (not sure if this is true of other cultures).
For more on the psychology of pricing, and why we buy things (which might offer insights into why people buy stocks), here are some terrific sources:
Buyology, by Martin Lindstrom
Influence, by Robert Cialdini (Yes! is an offshoot with more applications in business world)
Why We Buy, by Paco Underhill (an almost anthropological take, more on retail environments)
The Strategy and Tactics of Pricing, by Thomas Nagle
Dr. Robinson is the author of The Rocket Review Revolution, NAL Trade, 2006
Nov
29
This Week up about 9.7 % in DOW, from Kim Zussman
November 29, 2008 | Leave a Comment
It was encouraging that there were even a couple cases with weekly returns >9% that were not in the 1930s. Here they are along with following weeks:
Date week nxt week
06/22/31 0.182 0.008
08/01/32 0.162 0.008
06/20/38 0.142 0.058
07/25/32 0.130 0.162
03/15/33 0.128 -0.046
10/07/74 0.126 -0.005
10/27/08 0.114 -0.042
08/22/32 0.114 0.031
04/17/33 0.113 0.048
09/05/39 0.109 0.027
11/07/32 0.106 -0.075
07/11/32 0.103 0.049
08/16/82 0.103 0.016
09/19/32 0.102 -0.032
12/05/32 0.101 -0.017
02/15/32 0.094 -0.045
05/01/33 0.091 0.030
avg 0.010 sd 0.055 t 0.770
Nov
26
Two Years in Four Days. DUUUU! from Kim Zussman
November 26, 2008 | 2 Comments
DOW return from last Thursday's close to today's returned what two "normal" years in stocks would have: 15.5%. Note there were only 10 other rolling 4 day returns which were higher (1928-present):
Date 4d
08/08/32 0.274
03/15/33 0.208
10/09/31 0.208
03/16/33 0.198
02/16/32 0.185
11/19/29 0.178
04/24/33 0.176
08/10/32 0.164
06/24/31 0.161
03/17/33 0.156
11/26/08 0.155
Today was also 4 up in a row (DUUUU), the first since April 2008 (man
that was a short recession!). The wait since last DUUUU was 155 days,
second longest in the series
Date wait
04/13/38 196
11/26/08 155
06/06/32 146
08/09/02 135
12/27/94 113
11/25/57 113
10/01/81 110
09/21/34 107
11/06/01 104
07/21/31 104
And the recent DUUUU was the second largest gain:
Date 4d
08/08/32 0.274
11/26/08 0.155
07/25/32 0.137
10/15/02 0.133
06/23/38 0.127
06/01/70 0.125
08/01/32 0.120
10/14/74 0.118
10/20/31 0.117
10/30/87 0.111
Nov
23
Briefly Speaking, from Victor Niederhoffer
November 23, 2008 | 16 Comments
 1. Walking east across 56th Street from 9th to 6th Avenues the other day, at 5:15 pm, I noted 50 cars parked there, with drivers in the drivers seat waiting, slumbering… It wasn't an invasion of the body snatchers. Just people waiting for the 'no parking till 6 pm' to pass. They save 15 bucks for the night at the cost of an hour or so, valuing their time at less than $15 an hour. I wonder what the implicit price of time is in various cities now as a function of the recent diminution in wealth and loss of jobs.
Along the same lines, I recently received an offer from Icon which has a few hundred parking lots in NYC to park one's car on a monthly basis for $220 a month with "further discounts available" if you call. This might be a good way for the city and others to save money through obvious substitutions.
Fifteen dollars after tax translates to $22 or more pre-tax depending on the bracket. Moreover snoozing or reading have their own value, so the $15 could also be interpreted as the marginal difference in comfort between reading/napping in one's car versus doing the same in another environment. Nonetheless, the point remains: whether these people have anywhere better to be. Such Millhonian observations are enlightening and a reminder of the complexity of the economic system in which even the smallest actors are constantly performing economic calculations, the results of which feed into larger calculations.
I hope these people are reading some mentally enriching material, or at least taking power-naps or meditating, or somehow increasing their human capital, and that this is not complete deadweight loss.
2. At x pm every day, an announcement is made. The market moves to a level. The move is attributed to the announcement. The question is whether the move would have occurred regardless of the announcement. Also, whether the announcement was planned to make the move. For example, at 3:02 on 11/21, an announcement that the new Treasury Secretary was appointed occurred and the market moved up 6% in 59 minutes. Similarly at 3:10 last Friday, the announcement from the current Secretary that he believed everything was under control. The market set a new high and then dropped 6% in 50 minutes. We know that the news follows the price. Also, that the news is often now as "new" as we believe. The proverb comes to mind "the ____ will do what he can do." Also, the ephemeral nature of the news and those who know about it in advance. Is it fate or chance when such moves occur? And does the market do what it's going to do regardless? How would one approach this question and its tests and what insights can be drawn from such a traverse?
3. "The Game" between Harvard and Yale was won 10-0 with Yale limited to 90 yards. Yale previously had allowed just 95 points through 9 games. If the market can't be predicted, let us at least use the market to predict other things. Scores in baseball are always lower during bear markets. That's well known. Can we expect the same in basketball and such others as "What time is it, Mr. Fox?" and does the well documented predictive relation between low scores in baseball still continue to predict the market as previously enumerated in Practical Speculation?
4. Sometimes the kind of language used is a signal of vast underlying unearthed issues and problems. Times of crisis provide many nice examples of these and here a few which should be quantified and tested. In talking about his meeting with the former head of the investment bank who seamlessly moved to the chair of Treasury, the head of the now bankrupt investment bank said, "Our brand with the Treasury is very good." A Canadian central banker said about his meetings with senior bank executives, "If you were having a meeting with a central banker such as I and the conversation drifted to opera or the ski slopes at Davos or some such social setting, I think that's an issue." In discussing his tenure as consultant the former Treasury Secretary who seamlessly moved to consultant of the troubled bank, said "When you have a risk book…, you can't earn more unless you risk more," and he according to others asked to "bulk up" the book. Others involved said that, "as long as you grow revenues you can grow bonuses," and apparently the risk manager and the risk taker in CDOs were once stranded together on a "boat on a lake that ran out of gas" on a fly fishing trip. (That's not exactly language but it recalls the similar incident of the server CEO who was stranded on a boat with his assistant during a survival exercise before the comparable plummet in his stock after they bought an interest in a company he owned for 1000 times revenues or so). In talking about the risk controls, a former president of the troubled bank said "our reputation with the public and the regulators must be an asset." These are paraphrases just to set the ball rolling, and I would be interested in other telltale uses of language that reveal deep truths below the surface.
Gregory van Kipnis replies:
You can not read too much into the fact that 60 cars are waiting for the "No Parking" period to expire so they could park overnight for free. I live in that neighborhood and such a sight has been seen every night for seven years. Perhaps if you knew if there was an increase in the number of cars that didn't get one of those spots you might have a hardship barometer.
Much more revealing, however, is that two weeks ago everyone who parked on the street got a flyer on his windshield, saying he could park for $211 per month, guaranteed for one year, at an undisclosed garage, just call (212) xxx-xxxx. That's a $150-200 per month saving over the prevailing monthly rate in the neighborhood, and was being offered by one of the leading garage chains. I took the deal and wound up in a better garage than the one I left.
It appears that in anticipation of reduced demand for parking and an increase in space capacity, one of the garage chains is trying to cannibalize as much business as possible from the other chain operators, and lock them in for a year with the low teaser rates. After a year they start jacking up the monthly rate by $25 a clip every few months. The assumption must be that the frictional costs of searching for a cheaper deal and adapting to a new location will be high enough to retain most of the new customers while they transition them up to full market rates.
I haven't see parking rate warfare since 9/11/01.
Kim Zussman ponders point 2:
One thing news-related market moves can do is reveal a hidden question or tension. The big jump on Geithner (along with the post-election slump) suggests there was worry about if/how BHO would address the crisis.
I wonder what would have happened had he tapped Volcker? Maybe the same.
Recall the big up open when they caught the other Hussein; then an all-day decline.
It seldom makes sense, which is one reason it's so frustrating to ask logic to predict. If the market were logical, the logical would be rich. If the market were a puzzle, the clever would be rich. If the market were a symphony, Mozart would not have died poor.
There are enough stars to make a thousand constellations, and by design enough movement in the market to keep people believing in a rhyme or reason.
Andrew Moe replies:
 Underneath the belly of the beast, we had options expiration on Friday, and it seemed that the 750 strike was running the table for much of the day, creating extreme gains for those on one side of the trade and extreme losses for their counter-parties. Just days before, these levels seemed unthinkable, so emotions were running high on both sides. At 3pm, the market seized upon the Geithner news to speed directly to the 800 strike, delivering comeuppance and salvation in one swift blow. I believe this move was in the can all afternoon as the mistress alternately teased and taunted before finally making a decision as to what news would carry the banner for the advance.
Nov
22
The Definition of Wealth, from Kim Zussman
November 22, 2008 | 10 Comments
 A contractor told me proudly he was out of stocks since summer, because he bought a house. I suggested that house prices are currently correlated with stocks, and to the extent that most mortgages create leverage (ie, LTV 80% means if the house loses 20% you lose 100% - at least until Oh saves) the effect is amplified. Then I told him he needed an extraction, and he got mad and left.
Don't shoot the messenger?
Anyway he got me thinking about the definition of wealth. If you knew about a guy who made $100,000 per year, you might not be that impressed. Except if this happened in 1932 (that year comes up a lot now). 100K then was a lot of money, but not now. Maybe $100,000 will be respectable again soon.
Income is relative. Maybe net worth is too. Now everyone who owned stocks over the past year is worth less, and the same if you owned a house. Since most people own houses, and many own stocks, most got poorer. If you own a business it's probably worth less too.
But if you own stocks, a house, and a business, they still have worth relative to others - and ostensibly it is not zero (though the formerly low-risk concept of leverage has been revised). Now prices have to catch up, and lots of businesses don't yet understand that they need to cut prices.
It's amazing how powerfully emotion rules the mind. In 13 months the net worth of the world was about cut in half, and if you think about it, in reality how different is the world since then? Did an asteroid hit? Did Amadinejad invade Israel? No. People in many countries got carried away with house prices then got scared and stopped buying. Which pushed the leveraged upside down, foreclosures increased, counter-parties bellied up, and now everyone wants out.
Jeff Watson writes:
My son likes to watch a TV show on MTV known as Cribs when he's home from school. Cribs is a showcase of the big houses that rappers, pop stars, and others of that ilk like to buy and decorate when they get their big break. Generally, the houses have brand new furnishings and have been done in a very modern, minimalist, interchangeable styling. Part of the show is a tour of their garage, where multiple Hummers, Ferraris, Bentleys, and Escalades seem to be the cars of choice. They take you to their pool areas, which usually are very nice and expensive. All the houses have game rooms and private theaters, with state of the art equipment. My son was telling me how rich those guys must be to have all of those toys, and asked why we don't live like that. I pointed out the math to him, on an artist who has one or two hits under his belt, and grossed $10 million tops. Out of that $10 million, he has his agent and management fees taken right off the top, figure 25-35%. Then comes taxes which might be another 20%. Add the cost of a $5 million house, a million dollars worth of cars, another million in furnishings, then the salaries of their entourage, local taxes, utilities, and they're practically broke, or even have negative net worths. They are living for the now, on the expectation of their next deal, which may or may not appear. I pointed out to him that living really large on a shoestring isn't the way to exercise fiscal prudence. I also pointed that every performer whose house is showcased on Cribs has one striking similarity: a total absence of books anywhere in the houses, closets or even built in bookcases. I've never, ever seen a book in that show, and I've been forced to watch more than a few episodes. Evidently those performers never read, and one could postulate that reading is counterproductive as far as that type of success is concerned. In any case, my son learned a valuable lesson in thrift when I sat down and ran the numbers for him.
Vincent Andres adds:
Concerning the absence of books, it would be very nice if this observation were really specific to the houses showcased in such shows. I'm however afraid this observation is very general (and recursively, mainly because of many examples of this kind, the only cultural tap in so many houses is indeed just the TVs).
Entering a house is a bit like entering the owner's brains. Seeing no books, empty walls, … strange feeling. Intellectual faculties are outsourced, TV and the Jones are the spinal chord.
Nov
21
Rolling 15 Week DOW Returns, from Kim Zussman
November 21, 2008 | 4 Comments
(Another study showing that the market hasn't been this bad since the depression*)
Assuming tomorrow closes about here, the current 15 week DJIA return of -35.6% only compares with 18 such from the depression, and one from 1987. Here are the 20 worst rolling 15 week returns:
Date 15 W
07/05/32 -0.471
06/20/32 -0.464
06/13/32 -0.448
05/31/32 -0.437
06/27/32 -0.437
12/07/31 -0.434
12/21/31 -0.409
06/06/32 -0.404
05/23/32 -0.396
12/14/31 -0.392
12/16/29 -0.386
11/22/37 -0.375
11/30/31 -0.374
07/11/32 -0.370
11/23/31 -0.365
11/15/37 -0.363
11/17/08 -0.356
11/11/29 -0.352
04/25/32 -0.349
11/30/87 -0.348
*It's hard to imagine anyone who bases investment decisions on history not getting killed here, or anyone using leverage living a normal life. It's also hard to imagine that the current recession is close to the depression, or that SP500 deserved to be cut in half in 13 months (it has).
The lame duck period does seem hopeless; maybe a good time for long-term investing in a rich equity risk premium.
Nov
14
Most Kids Desire Strong Fathers, from Victor Niederhoffer
November 14, 2008 | 7 Comments
 Over and over again, we see the market moving in trepidatious concert with the father figure of the moment. It used to be the fake doc and then it was the scholarly economist chair, and now it's the former chair of the white shoe firm that maintains the Chinese wall with its former colleagues. On past occasions it's the Sage, and every now and then, a big executive like the head at Intel or the basketball player from Conn.
What's particularly damaging to the market is when these people bow. The spectacle of the Intel chief bowing and begging forgiveness I believe forever tarnished the aura of high p/e deservingness that his company with 59% profit margins might have deserved. The news that the former white shoe chair knelt in front of the chair of the Democratic party and begged her to pass the bail out bill was the death warrant for the market for a time. And now that he changed horses in midstream and gave up on buying mortgages directly, a position he had previously begged for, "based on a different set of circumstances" was the death knell for the market.
The trader has the Dostoiyefskian tendency to feel guilty about their activities from the time they were small. And they wish their father figure to be strong and not to kneel. When these figures regain the respect of their kids by being strong, maintaining the stiff upper lip, etc., we can expect a much better market. How would you quantify this and what other instances of kneeling as a bearish indicator have you seen?
Anatoly Veltman writes:
You mean like when Chancellor of the Exchequer raised discount rate 9/16/92 three times (from 3% to 7%), before rolling it back to 3% by the end of the same day… and recognized that ERM snake was in fact beheaded?
James Lackey replies:
The return of the dipsy doodle is a good start. The most damaging current meme is that the markets are at fault… and market prices do not forecast. "Free markets need help and regulation from governments," The dog is chasing its tail. Government regulations are what cause markets to come up with crazy schemes to avoid the previous market patches, in Microsoft terms, a "hot fix."
A more direct answer is price discovery. Once we all figured out too many prices were rigged they panicked and traders bought as usual. Then when the father figures changed the rules to bailout their kin, we went on strike. No traders, no liquidity for the markets. Now the prices are caught in the crossfire of the Hatfield-McCoy feud. Do not blame the hired guns.
Art Cooper adds:
Obviously the market and economy respond positively to strong leadership, as this relates directly to human emotions (animal spirits) which are so essential a part of Main Street economics, finance and the financial markets. Hence, the Great Depression market responded positively to a strong leader who declared that "The only thing we have to fear is…fear itself," even though his economic policies were in fact counter-productive to recovery (see Jim Powell's "FDR's Folly").
Kim Zussman interjects:
The child is racked with disorienting insecurity when they first witness their parents own uncertainty, indecisiveness, and fear. Now the children are being dragged by their mother to a new daddy with undetermined rules of discipline, while being told that the last daddy was really an immoral fraud.
It's hard growing up, especially with a fickle mother.
James Lackey writes:
I listened to Santana's show tour warm-up in 2002 or so. Later that evening he was on an interview, local radio, and was describing his so called comeback. His rebirth was through collaboration with new young artists. His quote went something like, "I wanted my teenage kids to know dad can jam, and how the system works, sure they saw my old awards and shows from back in the day… but to a teenager..it's now that counts." The gist was, the only reason he did the work was to prove a point to his children… boom… the return of a father figure.
J.T Holley writes:
Highly apropos, like all great literature, call me crazy if ya'll don't see it that way, this has been written in William Golding's Lord of the Flies.
Kids abandoned due to crash from adults.
Ralph pleads with Piggy about Simon's death: "You were outside, Outside the circle, Didn't you see what they did" (paraphrased).
Piggy before his murder: "Which is better? Law and rescue or hunting and breaking things?" (paraphrased). Then the rock falls.
Kids rescued from abandonment and panic/chaos when Ralph looks up at Naval Officer (adult).
I guess the big question right now and maybe one that Golding proposed is who is going to rescue the naval officer and his boat? In other words who saves the adults themselves?
Now substitute War, Atomic Bomb, Ralph, Jack, Simon, Piggy, Naval Officer, Naval Ship with traders, investors, banks, citizens, government, and politicians.
Kevin Eilian writes:
Before it became a quote dejour by Mac and others, R*bin's upper lip, bone straight poker face, "the economic fundamentals are strong,"– you believed it. He made sure he did, too, as his net worth was tied to white shoe IPO.
James Sogi says:
Demographics is the counting of the "father figure" issue. We saw the effect in the aging of Japan. Now we are seeing the aging of America. The rest of the world is quite young, averaging something like 15 years old… Many of our parents are sick, old or dying or died. There is a changing of the guard. The boomers are retiring. America is aging and gaining weight. Though America "the great white father" is kneeling or brought to its knees, the emerging world will rise in its place over time. I would watch this trend over the long term. The world is becoming multicultural. Witness, O witness, the non white majority in California.
Russ Sears adds:
I have been thinking for the last few weeks that all of this could have been avoided if the investment bankers had learned a few lessons on risk management from a mother of a smart, curious two year old or a teenage boy. You can't just tell them no and then ignore them once they've moved on and not still expect some experimention to happen. The alerrt mom always seems to have an instinct, before the father, when silence is a clue they are into something or when the truth has been stretched. How the mother always is prepared to contain while still delighting in their first taste of chocolate cake or discovery of girls and love. The good mom has the sense to help them limit these new found divine obsessions, before they ruin their mental and physical health.
Nov
9
Westerns, from Steve Leslie
November 9, 2008 | 9 Comments
 This site is devoted to revealing lessons that will endure for a lifetime. One of the familiar themes that Daily Speculations has offered over the years has been Westerns.
1. L'Amour. One of the favorite writers discussed here is Louis L'Amour. In researching Mr. L'Amour's work, I have decided to list my favorite films that are based upon Louis L'Amour novels for those who would like to watch a movie inspired by Mr. L'Amour's work. They are in no particular order of personal preference.
Hondo Short story "The Gift of Cochise" 1953 John Wayne
The Shadow Riders 1982 Tom Selleck, Sam Elliot
The Quick and the Dead 1995 Gene Hackman, Sharon Stone, Leonardo DeCaprio
Conagher 1991 Sam Elliott, Katherine Ross
Crossfire Trail 2001 Tom Selleck,Virginia Madsen
2. My favorite Westerns in general
The Man Who Shot Liberty Valence
Tombstone
Open Range
Fort Apache
The Treasure of the Sierra Madre
High Noon
Unforgiven
Butch Cassidy and the Sundance Kid
Tom Horn
The Magnificent Seven
3. My favorite Western Miniseries
The Sacketts
Lonesome Dove
4. My favorite Western Comedy
Support your local Sheriff
Kim Zussman insurges:
What about the Italian favorite “The Good, the Bad, and the Ugly”? (Also known on Wall St as “The Three Faces of Heave”).
Lots of market parables there, including the tug-of-war between fear and greed, continuously changing levels of deception, unhuman fearlessness, and a whole way of life based on fairy-dust.
OK not fairy-dust; gold.
Great fun with Eli Wallach and Clint Eastwood, ca 1966.
Nov
8
Change We Needed, from Kim Zussman
November 8, 2008 | Leave a Comment
For this quantitative exercise, I compared the size and counts of up and down days (SPY cls-cls) from the Museum of Drift period (10/05-10/06) with the most recent period (10/07-10/08).
(Using a 2-sample T-test to compare means of up days with means of abs[down days]):

Note that in the former period the size of up and down days were identical, so this up market was due to 1.23 up days for every down day. In the recent interval (i.e. over the past year) the count of up to down days is 1:1, and the down days are down more than up are up (though not stat. significant).
So if you count on drift for change you need, before you would likely get it by waiting a few days. But now that we need even more change (to pay taxes), the longer you invested the more change you will need.
Alex Castaldo calls attention to the obvious:
Also interesting is that in the former period the typical move was about 0.5%, in the more recent period it has more than doubled to 1.2% or 1.5% respectively.
Nov
2
Stocks Dislike Obama More Than They Like McCain, from Kim Zussman
November 2, 2008 | 1 Comment
Intrade has data on betting odds for Obama and McCain: daily close-close change on betting price 1/08-present (eliminating weekends/holidays), used linear regression to compare change OB and change MC with (contemporaneous) change SPY:
Regression Analysis: chg SPY versus chg OB
The regression equation is
chg SPY = - 0.00151 - 0.0045 chg OB
Predictor Coef SE Coef T P
Constant -0.001512 0.00164 -0.92 0.358
chg OB -0.00449 0.01898 -0.24 0.813
S = 0.0236313 R-Sq = 0.0% R-Sq(adj) = 0.0%
Regression Analysis: chg SPY versus chg MC
The regression equation is
chg SPY = - 0.00160 + 0.0064 chg MC
Predictor Coef SE Coef T P
Constant -0.00159 0.00163 -0.98 0.329
chg MC 0.00639 0.02282 0.28 0.780
S = 0.0236300 R-Sq = 0.0% R-Sq(adj) = 0.0%
None of the coefficients approach significance, but (as we well know) as Obama's odds went up YTD, stocks went down.
Repeated the regressions "at lag 1" (ie, today's change in SPY vs yesterday's in OB and MC):
Regression Analysis: L0 SPY versus L1 OB
The regression equation is
L0 SPY = - 0.00131 - 0.0228 L1 OB
Predictor Coef SE Coef T P
Constant -0.00130 0.00164 -0.80 0.427
L1 OB -0.02282 0.01897 -1.20 0.230
S = 0.0236091 R-Sq = 0.7% R-Sq(adj) = 0.2%
Regression Analysis: L0 SPY versus L1 MC
The regression equation is L0 SPY = - 0.00161 + 0.0082 L1 MC
Predictor Coef SE Coef T P
Constant -0.00160 0.00163 -0.98 0.327
L1 MC 0.00822 0.02293 0.36 0.720
S = 0.0236837 R-Sq = 0.1% R-Sq(adj) = 0.0%
Again nothing significant, but the slope coefficient for SPY/OB is closer to significant (and negative) than SPY/MC (positive).
Conclusion? "Yes-we-can" sell because your once-preferential treatment of capital gains are going to the capital for at least 8 years…
Nov
1
Velocity of Drops Vs. Gains, from Kim Zussman
November 1, 2008 | 4 Comments

Using SP500 daily returns 1950-present, I calculated the returns for non-overlapping intervals of 1, 2, 4, 8, 16, 32, 64, 128, and 256 days. Then I ranked the returns for each interval into the 19 biggest gains and 19 biggest losses. Then I compared the absolute values of the 19 biggest gains and losses using paired t-test: which compared the single biggest gain with single biggest loss, next biggest to next biggest, etc. Here are the t-scores for ranked |biggest losses|-|biggest gains|, by interval:
DAYS PAIRED T
1 -2.8
2 -1.8
4 -4.0
8 -3.4
16 -2.1
32 0.9
64 1.3
128 6.9
256 18.9
For non-overlapping intervals 16 days and shorter, losses are bigger than gains. However the pattern reverses as the interval gets longer, and for periods 128 days and longer, gains are bigger. Since the gains and losses are compared over the same intervals, this is a test of velocity (change/time), and supports the belief that over intervals shorter than a month drops are faster than gains.
Oct
31
Moderation in GDP Volatility, from Kim Zussman
October 31, 2008 | 1 Comment
(This is in the literature, but wanted to check it).
Using quarterly-change in (%, 2000 dollar adjusted) GDP, checked stdev
every 16 quarters starting back from Q3 2008, to 1952:
Date 16Q stdev
2008q3 1.75
2004q3 2.02
2000q3 2.05
1996q3 1.80
1992q3 2.36
1988q3 1.57
1984q3 5.21
1980q3 5.19
1976q3 4.70
1972q3 4.13
1968q3 3.48
1964q3 3.50
1960q3 5.87
1956q3 5.47
1952q3 6.65
Noticeable reduction in volatility since the late 1980s, dating with the Greenspan tenure. The attached chart shows the source data, which suggests we have been in much more stable economy in the recent 20 years.
Looking at the quarterly GDP data, checked for the pattern "UDX" (up qtr, down qtr, next=X). Found that 30% of X were negative (2 consecutive down GDP qtr), whereas in the whole series (1947-present) down quarters were 15%. And the means of X and all qtr were not significantly different (test not shown).
Also checked DJIA quarterly returns with respect to QTR GDP changes. Here is test of mean quarterly returns for DJIA for all qtr of the series (DOW QTR), simultaneous with down GDP QTR (DOW SQ), and those qtr following down GDP QTR (DOW NQ):
One-Sample T: DOW QTR, DOW SQ, DOW NQ
Test of mu = 0 vs not = 0
Variable N Mean StDev SE Mean 95% CI T P
DOW QTR 243 0.0197 0.0737 0.0047 ( 0.0104, 0.0290) 4.17 0.000
DOW SQ 35 0.0155 0.0858 0.0145 (-0.0139, 0.0450) 1.07 0.292
DOW NQ 34 0.0262 0.0893 0.0153 (-0.0049, 0.0574) 1.71 0.096
Stocks average up during down GDP QTR, and interestingly up even more the following QTRs.
Oct
30
Internet Radio, from Kim Zussman
October 30, 2008 | 2 Comments
 There are a number of free internet radio stations, and in honor of the pending savage bear market rally, here is a good site.
I like the Bartok station from Hungary, and of course Zappateers which is on now (that man died too young).
But since this is a trading list, certainly you have read, "Trader know thyself". Which I think means that when you are intimately involved with the market it is difficult to disentangle your interpretations from unbiased signals, because you kind of merge with it. As if it is about you.
Last week while sitting in the kitchen with a mug of Costco coffee (Jose brand), a hapless bird struck the nearby bay window with a loud thud. I went out and found that she had banked off the glass into a waste bin; not dead but disoriented and bleeding. I picked her up –it looked like she could make it, so I set her on the lawn to recuperate.
Half hour later she had flown; but suspecting not far, I put out some bread crumbs and filled the bird-bath. Almost immediately she flitted from a tree into the bath, sipped it, and looked at me in appreciation. It felt good to bridge across inter-species bigotries (I eat her cousins), and being recognized by her felt like how Adam must have before he got poisoned.
When we came back later that night she was perched incautiously on our porch looking quizzically at her savior, and it was hard to resist thoughts of Cult Cargo Science and that she might now worship me.
The next morning I found her dead there. Clinically, probably internal bleeding, shock, and cardiac arrest. But at least someone was nice to her in her last day.
The next day I saw another bird like her; a kind of "tit".
If you read the description, when you have seen one tit, you have seen them all (which in all species never derails the inquisition). And over the next few days I noticed there were many, and it occurred to me that the bird which hit the window may not have been the one who came to the bath. And it also may not have been the one that was stooped on the patio, and maybe even a different one had died. Maybe this "one bird" was all a self-constructed story, originating at the center of the universe, like the one running in every one of us.
All of which perhaps argues for another conservation law: The more you strive to know yourself, the more self-obsessed you become, and the less accurately you can visualize your unique irrelevance.
Oct
25
Stocks for the Long Run, part II, from Kim Zussman
October 25, 2008 | 1 Comment
(Or what the boring do on Saturday morning)
Curious about investor dispositions over time, I used DJIA monthly closes 1928-present (w/o dividends) to calculate a rolling compounded 10 year return. At the end of each month, plotted the product of this and the prior 119 month's return vs date (see attached - dark blue line) defined:
Month return = (this month close) / (prior month close) = "M"
10y compound rolling return = {M * M(t-1) *…… *M(t-120)}
Also plotted in pink is ln(DOW) - 4 (to scale with 10y compound rolling return)
Assuming October ends about where it is now, the 10y compound rolling return is currently just under 1 (0.975), which hasn't happened since 1982. The last time 10y compound rolling return dipped below 1 was 1974, and it hovered around this level for 8 years. The the prior sub-1 regime was in the 1930's, so the wait was about 40 years. There is about the same wait between 10y compound rolling return peaks -from 1959 to the most recent in 2000.
While there are few inferences to be made when N=2 (but how often do we get markets like the current one…), this could be evidence for cycles of over–and under–enthusiasm for stocks on the timescale of human-investable-years.
Oct
24
Five Year Lows, from Scott Brooks
October 24, 2008 | 4 Comments
 I firmly believe that cash flow will be king in the coming decade. Buying companies with a solid cash flow that do well in difficult times will allow the prudent investor to have the capital available to make purchases of other companies (and acquire their talent either thru acquisition or hiring them after they are laid off) during this depressed time.
Cash flow = money in the bank to buy depressed companies…..depressed companies that offer (what I believe to be) the great growth opportunity of the coming decade.
Kim Zussman writes:
I keep trying to remember why my folks weren't buying stocks in the early 1970's: "cash flow" (used to be called money, like consumers were once citizens) was needed for things like mortgage, cars, food after coupons, and thread for mom to repair our clothes.
Darn socks - damn stocks
Alston Mabry adds:
Given the DS comment on the new cash flow ("I firmly believe that cash flow will be king in the coming decade."), I have the temerity to re-post this link of mine from 2006.
Oct
24
Econ 252 Financial Markets Midterm, Part 2, from Kim Zussman
October 24, 2008 | 2 Comments
2. A market mystery is that crashes are prone to Fridays and Mondays. A certain Friday opens limit-down, but bobs up a bit during the day. What will traders do at the end of the day? Choose the best answer:
A. Fearing a Monday massacre, they sell heavily to the close. You buy because now there is no "portfolio insurance", and a 1987-type crash cannot happen. Plus it's a good way to get a date on Friday night.
B. Traders are horny, so they run the close up. You short or hedge because the lack of fear makes a Monday crash more likely, plus you already had a date on Thursday (meow).
C. Trader is finally listening to the pleas of radical Islam .
Oct
23
An Interesting Parallel, from Nigel Davies
October 23, 2008 | 4 Comments
 "Alan Greenspan, the former Federal Reserve chairman once considered the infallible maestro of the financial system, admitted on Thursday that he “made a mistake” in trusting that free markets could regulate themselves without government oversight…. But in a tense exchange with Representative Henry A. Waxman, the California Democrat who is chairman of the committee, Mr. Greenspan conceded a more serious flaw in his own philosophy that unfettered free markets sit at the root of a superior economy."
"Citizen judges, I want to tell [you] how a man who spent thirty years in the party and worked a great deal, stumbled [and] fell … I have committed heinous crimes. I realize this. It is hard to live after such crimes . . . But it is terrible to die with such a stigma. Even from behind bars I would like to see the further flour-ishings of the country I betrayed." Genrikh Yagoda
"… I confirm the admission of my monstrous crimes . . . We were preparing for a coup d'etat, we organized kulak insurrections and terrorist groups … I would like those who have not yet been exposed and have not yet laid down their arms to do so immediately . . . Their only salvation lies in helping the party." Alexei Rykov
GM Davies is the author of Play 1 e4 e5: A Complete Repertoire for Black, Everyman, 2005
Kim Zussman replies:
I doubt Mr Greenspan has as much at stake as the bolsheviks did, though the interesting parallel does illustrate the easy job inquisitors have.
Given government ownership of assets and increased regulation decrease the risk premium, keeping risky assets at a durably lower price level?
Oct
23
Econ 252 Financial Markets Midterm, from Kim Zussman
October 23, 2008 | Leave a Comment

1. Risk appetite is to (__________) as (__________) is to (__________)
A. The trader, tunnel of love, cute amusement parks
B. The US capitalist system, egg, matzo-brei
C. Dead generals, never to be written chapters, history books
D. The male black widow, leverage, market liquidity
Oct
22
Unprecedented Events, from Victor Niederhoffer
October 22, 2008 | 19 Comments
 There are many unprecedented events that we are witnessing these days. To me, the most amazing is that on 12 31 1982 the Nikkei closed at 8500, by no means a local high as it was 9000 a year later.. On 10 15 2008 it closed at 8458 thereby marking a 26 year period where a major enterprise stock market moved without a rise. The S&P stood at 800 to 900 in mid 1997 and reached 1000 in early 1998. Thus, 11 years without a gain in the US. Is there a single overriding reason?
To me, the key aberration occurred in the two weeks of 9 26 2008 to 10 10 2008 when the S&P moved from 1218 to 891 and the Nikkei plummeted from 11920 to 82760.
To gain perspective, I looked at weekly prices:
date       sp     nikkei    bonds    euro   crude gold   wheat vix

0919     1246    1192       118 5   14466   10254  834   718   32

0926     1216    1189       117 1   14609   10618  879   716   35

1003     1108    1094       11920   13772    9301  835   640   45

1010      891    8276       11620   13408    7799  849   563   56
A preliminary insight is that vix and the dollar rise and crude were the major harbingers of the unprecedented decline the week of 10 10.
I always believe that markets and prices are the key and that interrelation and the web is always there. The problem is they're always changing. But at least we've got a description.
Anatoly Veltman adds:
My hypothesis at this hour is that the currency markets are destined to wash-out first, with world equity markets grudgingly following. The reason, obviously, is that margin liquidation in FX takes plays instantly - while generating and then instituting collection on stock margin calls takes time, not to mention timezones.
Kim Zussman wonders:
Couldn't help wondering when/if backbone financial theories (such as high allocation to equities for long term investors) will become so unpopular that demand for courses in financial markets will dry up. Y@le had a guest lecture from David Swensen earlier this year, will he be invited back next year?
Charles Pennington comments:
For any remaining fans of the Fed Model, here are some numbers from the Financial Times (page 23, "Market Data"):
country earnings yield % 10-year gov't bond yield %
US 8% 3.7%
Germany 10% 3.9%
UK 13% 4.6%
Japan 9% 1.6%
J.T Holley writes:
 The web now includes for me the Vix trading higher than a barrell of oil at one point, and for me a first, the cash trading more than the Dec mini S*P contract. What is next– dawgs n catz sleepin' together? Be very very careful, brainwashin' is in effect and bodies are being snatched!
Stefan Jovanovich replies:
Starting the Index of home prices at 1995 overstates the run-up of home prices. It would be like starting a stock market Index at 1982. Kim may disagree, but house prices here in California in 1995 were still recovering from a boom-bust cycle that was almost as dramatic as the current one. The current boom didn't really get going until after the dot.com bust; 2002 was really the first full year when housing prices only went up no matter where they were.
Time for Oscar Hammerstein and Carousel (first sung on Broadway by Jan Clayton aka Lassie's Mom):
"When you walk through a storm,
Hold your head up high,
And don't be afraid of the dark,
At the end of the storm is a golden sky.
And the sweet silver song of a lark.
Walk on through the wind,
Walk on through the rain,
Tho' your dreams be tossed and blown,
Walk on, walk on, with hope in your heart,
And you'll never walk alone.
You'll never walk alone ![]() "
"
Time to buy because it is way too late to sell, and all the canes have been swapped for walkers.
Oct
19
The Mother of all Swans, from Kim Zussman
October 19, 2008 | Leave a Comment
Update on 10d non-overlapping daily stdev of DJIA: The recent 10d daily (cls-cls) stdev is 5.7%, which was only exceeded in 1987 and during the depression (see attachment).
Here are the other cases with 10d sdev > 4%, the dates of which seem to make it hard to argue that the mechanisms of modern finance reduce volatility:
Date STDEV10 nxt 10 ret
10/27/87 0.089 0.017
11/14/29 0.075 0.112
10/14/31 0.071 0.033
03/21/33 0.060 -0.026
10/29/29 0.052 -0.056
08/16/32 0.051 0.078
02/25/32 0.047 0.051
09/28/32 0.045 -0.187
07/28/33 0.045 0.031
06/22/31 0.042 0.048
12/28/31 0.042 0.075
01/12/32 0.041 0.005
09/29/31 0.041 -0.025
06/20/32 0.041 -0.091
Oct
17
Nowhere Near Delivery, from Kim Zussman
October 17, 2008 | 2 Comments
 My surgical assistant often asks for updates on the stock market, especially lately with what's happened to her 201K (used to be 401).
"Big dip after the open, with a huge rally to the close. We're nowhere near the bottom because there is still too much speculative buying, and we won't get there until normal people stop talking about the market."
(Read it somewhere and wanted to impress her.)
A lady overheard this, and related a similar story about childbirth: She was exhausted after laboring for a few hours, and the doctor came in to check. He asked her to rate the labor pains on a scale of 1-10. "Eight or nine!" she said. "It hurts a lot!"
"You're nowhere near delivery" he said, "because when you get close you won't be able to answer my questions, or even hear them."
Oct
16
Buyback Checkup, from Kim Zussman
October 16, 2008 | Leave a Comment
There is an ETF that invests in buyback companies. It is PowerShares Buyback Achievers Portfolio (PKW )
The following are regression stats for daily change PKW vs daily change SPY, from PKW inception 12/2006:
.                 Intercept SPY change

Coefficients      -0.0002    0.8596

Standard Error     0.0003    0.0169

t Stat            -0.8081    50.7573
Conclusion: Alpha slightly negative (N.S) with beta of 0.85.
Either the buyback anomaly has been arbed away, or the market is playing one of its dirty tricks.
Oct
11
The Stats, from Kim Zussman
October 11, 2008 | Leave a Comment
Everyone knows last week's 18% drop was the worst in DJIA history (10/28-present). Here are the stats excluding that week (but including Great Depression weeks):
Descriptive Statistics: week ret
Variable Mean SE Mean StDev Minimum Median Maximum
week ret 0.0012 0.00038 0.02442 -0.1554 0.0025 0.1821
So last week's return (return?) of -0.18 was about 7.4 STDEV below the mean.
Not only not normal, but where to look for example periods to model quant strategies? We now see it was a mistake to exclude 00-02. Even 29-40. What about the KT boundary?
In honor of this occasion, one will ditch the clever-as-if-it-was-known tone of this web site, and offer an opinion:
There are periods when markets behave well and are amenable to characterization (quantitative or otherwise). And there are periods when they are not. If you could know this with any precision, you would be extremely wealthy; which by design makes it about impossible to know.
Markets wouldn't trade actively if there weren't opportunities, or if it were easy to tell genius from luck.
Rich Bubb responds:
So this "characterization" could be a 3×3 cube plotted representation (albeit this might be a little simplistic for most of the SPEC-Listers), with axes listed, in no particular order:
x aka a bubble exists in sector/commodity, scale might read: "no chance" at far left end; hysteresis happening and/or lobagola should happen or just did happen being in the mid-zone/s; and price/cost up n% in m-time meaning "here there be the bubble monster" and tread lightly or get out as fast as feasible.
y aka the interest rate du jour… scale trending down means economy &/or mkt trending down; scale trending up means economy &/or mkt trending up… but the scale would be visually represented by an upside down bell curve. So, for example, if fed rate is trending down, then the might be converted to a z-scale transformed scale with 0 in the mid of the scale, +3 on high end of scale, and -3 (std devs) at the low end.
z aka axis might be volatility or put-call ratio, or money supply, or OBOS%, or your indicator of choice.
With enough data points one might be able to observe the rate of change in 3D as things (x, y, z) move about.
I think this could be done with the charting tools in Excel…
Phil McDonnell observes:
The analysis Rich Bubb has described is essentially a 3D scatter plot. There are many examples of 2D scatter plots in Education of a Speculator and Practical Speculation as well as any introductory stat book that covers regression. The 2D plots relate to regression of one variable in an attempt to explain or predict another. The 3D case would relate to the case of using 2 variables to explain a third one. The regression would be of the form:
Z = a * X + b * Y
The usual caution is to avoid variables which are serially correlated. Usually price CHANGE variables are not correlated because an efficient market will remove any such correlation. By the same token price LEVELS are always highly correlated. One notes in passing that interest rates are a kind of reciprocal of the price level of the underlying debt instrument. Thus interest rates would be expected to be highly correlated but CHANGES in interest rates or prices would not be correlated.
Volatility is a more interesting animal. Volatility and therefore Vix levels are highly correlated. Again it is probably better to use changes in Vix than levels.
A final note is that one can perform a two variable regression of the above form even in Exc3l. To do that you need to have the Analysis Tools Add-In loaded. The data columns should be right next to each other (vertically). Then the regression analysis can be performed by clicking 'Tools/DataAnalysis/Regression'.
Oct
10
Seven Dow Days in a Row, from Kim Zussman
October 10, 2008 | Leave a Comment
Seven down days in a row in DJIA total about -21%. Looking for past cases with exactly seven in-a-row down (ie, UDDDDDDD) 1928-present, the current run appears to be lowest. Here are UDDDDDDD down more than -7%:
Date UD7 next 10d
10/09/08 -0.209 ?
04/08/32 -0.185 -0.064
09/20/01 -0.165 0.082
10/18/37 -0.146 0.081
05/19/31 -0.101 -0.124
09/30/74 -0.098 0.108
07/16/02 -0.097 0.024
04/02/31 -0.087 -0.057
08/16/74 -0.083 -0.072
05/27/38 -0.077 0.036
10/16/79 -0.076 -0.007
11/06/73 -0.075 -0.075
06/26/62 -0.073 0.099
03/26/29 -0.073 0.014
Stats (not shown — don't matter) for next 10 days are only significant for huge variance.
Q: Doesn't govenment takeover of financial firms worsen stocks, since it either dilutes or destroys shareholder equity? Is the tongue-in-cheek talk about socialism "be careful what you joke about or…"?
Oct
10
A Message from the President, from John Tierney
October 10, 2008 | 1 Comment
 Following his recent death, there has been much written about John Templeton. Most stories emphasized two aspects of his life: his most recent views on the market (very bearish) , and how he made his first big score.
It's this second aspect that interests me. To recap, in 1939 Templeton borrowed $10,000 and bought 100 shares of every Big Board stock selling for less than $1.00. There were 104 of them at the time and 34 of them were in bankruptcy. Four years later, only four of the 104 proved worthless, and his initial stake had increased by approximately 400%.
I have no idea where the market is heading from here but as I have read recently, were someone to have invested a given sum every month beginning in late '29, and continued to do so through '32, he would have realized a very nice return and one which would have continued to appreciate nicely throughout the Depression years. I don't believe many would argue that the current market is healthy but might argue that there are some excellent values for those courageous enough to take the risk. Maybe it's time to "Templeton" the market.
Could the same strategy work again? With a few modifications, I believe it's worth a try. The first adjustment I made was to calculate today's equivalent to '39s one dollar stock. The calculator I used determined that a dollar back then is $14.78 through 2007. It's no big deal to find equities that currently trade at or below that figure; however, unless you possess huge amounts of capital buying 100 of every equity below $14.78 would be awfully expensive.
Now, I have many, many watch lists — several of which go back a decade. Last evening I went through them and quickly found 17 which met the price threshold. Some I have owned, some I have not. Some treated me well, others poorly. Some are relatively new, some are very old (e.g, CX was purchased in '99 and sold in '01 — until last night I had not even remembered its existence). But all are flawed in that, at one time or another, I felt they'd be a good buy or interesting speculation. Their prices today when matched against the prices I recorded when adding them to one of my watch lists indicates, in most cases, I was wrong.
Alice Allen adds:
 I was glad to be reminded of Templeton's strategy after yesterday morning (10/10) when I bought 100 shares each of six stocks under $3 that I had owned earlier at higher prices. For two stocks, industry experience gives me an edge to think these companies will survive. For two stocks, excellent customer experience makes me willing to take a chance. The last stock is a small oil company with all the potential for unexpected movement. Tierney's post has encouraged me to explicitly track how this strategy works out. I'm considering each position as simply a call option with delta=1 and no decline from theta, certainly among my least risky trades in this market. Now if I can just resist increasing position size on random positive fluctuations…
Kim Zussman Reflects:
'39 was 10 years after the crash, and fortuitously near the end of the Depression. Presumably by that time, with the main worry survival and the start of WWII, the few who had money were more disposed to buy stocks of food than stocks of companies in bankruptcy.
That the above question is being asked suggests we aren't there yet.
Oct
7
Rolling 7 Day DJIA Returns <-15%, from Kim Zussman
October 7, 2008 | 2 Comments
9 of the 39 cases since 1928 were not during the Depression:
Date 7D
09/21/01 -0.163
09/20/01 -0.165
10/27/87 -0.178
10/26/87 -0.238
10/23/87 -0.191
10/22/87 -0.222
10/21/87 -0.179
10/20/87 -0.258
10/19/87 -0.309
05/22/40 -0.166
05/21/40 -0.212
05/20/40 -0.174
05/17/40 -0.161
03/31/38 -0.155
03/30/38 -0.161
10/19/33 -0.154
07/21/33 -0.152
10/13/32 -0.161
10/10/32 -0.183
09/19/32 -0.160
09/16/32 -0.161
06/01/32 -0.157
05/31/32 -0.158
04/11/32 -0.153
04/08/32 -0.185
12/16/31 -0.151
10/05/31 -0.198
10/02/31 -0.165
06/24/30 -0.152
11/14/29 -0.157
11/13/29 -0.274
11/12/29 -0.189
11/07/29 -0.209
11/06/29 -0.225
11/04/29 -0.157
10/31/29 -0.162
10/30/29 -0.195
10/29/29 -0.310
10/28/29 -0.238
Oct
7
SAT Question # 1008, from Kim Zussman
October 7, 2008 | 4 Comments
1008. During a period prone to large market declines on Fridays and Mondays, there were two consecutive weeks with crashes on Monday followed by large gains Tuesday. The first week saw a large drop from Tuesday to Friday. What happens the second week?
A. The market is too cute to repeat except when you least expect it, so Weds-Friday continues with large gains.
B. The market is too cute to repeat except when you least expect it, so Weds-Friday repeats with large losses.
C. Volatile markets are baited heavily to maximize extinction, so you should not trade them unless you can't get another job.
D. It's October, and Treasury ran out of Treats for Tantrums. Market will be about unchanged.
E. Under the Obama administration, it is finally legal for Harriet Tubman to wed Sacajawea.
Oct
5
Mother of All Swans, from Kim Zussman
October 5, 2008 | 5 Comments
 To me the biggest assumption about financial markets is that history will repeat. The second biggest assumption is that the Great Depression won't.
At least in terms of volatility, it looks like we are going to test both these assumptions soon.
VXO is recently over 50, which has occurred infrequently since inception in 1986. But this is a short time when studying mass-extinctions, so to study volatility over longer periods I used DJIA daily returns 1928-present, and for every non-overlapping 10 day period I calculated the STDEV. This chart shows the recent 10 day/daily STDEV is >3%, which occurred recently only in 1997, 1998, and 2001. Prior to this, all the instances were in the 1920s and 30s.
Mark Isbic writes:
Today here in Israel, the mother of all swans started with the TA 25 and 100 down 7% and the Tel Tech down over 11%. If this is any indication, tomorrow will be very ugly unfortunately. I say to myself it will be a great time to jump in. Unfortunately I have been doing this for several months and have taken a beating!
Jason Shapiro remarks:
Anybody see the Bloomberg story about how current financial conditions are a black swan event? Statistically they say this is rarer than a comet's destroying the earth. And the data they used go all the way back to 1993!
Oct
3
Dood, What Happened to My Shorts? from Kim Zussman
October 3, 2008 | 1 Comment
1. Has the behaviour of XLF changed since the SEC restricted shorting of certain financial stocks?
First compare daily return SPY for the period before and after the shorting ban (after=S):
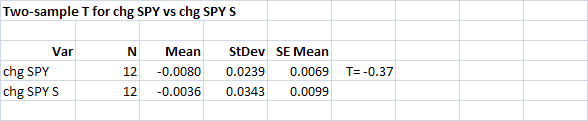
SPY down for both periods, difference N.S. Now the same for XLF:
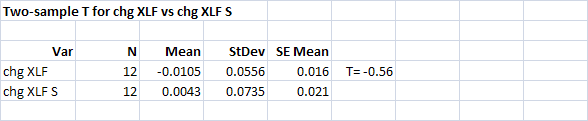
Again the difference was N.S. Like SPY, XLF was down in the pre-short ban period, but unlike SPY it went up post.
2. What about correlation with VIX? (First the control group)
Here is regression of daily change VIX vs SPY for the 11 days before the ban on shorting:
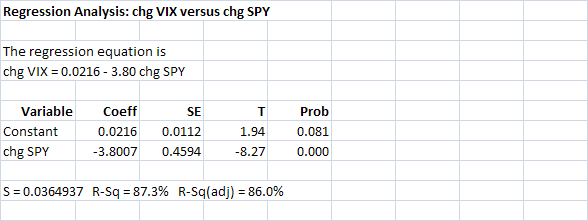
And the same since the change:
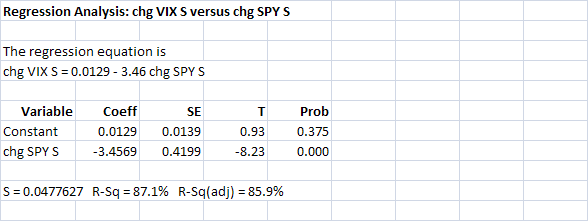
R^2 the same at 87%.
Oct
3
Cost of Living Over the Centuries, from Stefan Jovanovich
October 3, 2008 | Leave a Comment
Being too lazy to find out on my own and, therefore, that much more curious about the answers, I repost this past exchange by Yishen and Kim in the hope that they may have further thoughts on the subject. How much, I wonder, has the cost of lodging changed over the centuries and in the recent slump for an unskilled laborer? I can provide one factoid: for the unskilled laborer without papers here in the SF Bay Area the price of housing - i.e. sharing a bedroom with 3 other laborers in a ranch house in the non-posh suburbs - has gone down by 30-40%. House rents have slumped badly as the supply of tenants has fallen even faster than housing prices (the decline in remittances from the U.S. to Mexico is a lagging indicator of this trend.)
Yishen wrote:
I recently took a look at cost of living in 1700s London versus 2000s New York City.
I took the approach of figuring out how much of each item could an unskilled worker consume a year based on his salary and the price of goods then.
For instance, an unskilled laborer could purchase 511 lb of bacon in 1700s London with his annual paycheck versus 4122 lb of bacon in NYC today.
There's a lot of detail one can get rigourous about (like correcting for various taxes) and a lot of assumptions about prices, so I don't think the numbers I cite contain much (or any) precision, however the magnitudes of improvement should tell the right story:
Item              1700s 2000s

Postage 80 miles  1872  83324

Coarse Soap, 1lb  3744  5833

Beer, 1qt         1404  3888

Barber visit      936   1167

Butter, 1lb       624   5833

Bacon, 1lb        511   4122

Mail, London-NY   468   41662

Steakhouse dinner 468   583

Candles, 1lb      165   1458

Coffee, 1lb       94    1326

Tea, 1lb          62    1750

Simple dinner     899   1167

Ticket            45    93 (Handel's messiah vs Madonna's latest tour)
Our average Joe benefited the most in communication anywhere from 40 fold to 90 fold greater consumption.
Agricultural goods came next, some 10 to 30 fold for tea and coffee, 8 to 9 fold for processed goods like candles, butter and bacon.
Finally, a trip to the barber didn't change all that much in terms of affordability for the average Joe.
Kim Zussman replied:
By any measures standard of living (i.e., real wages/real cost of living) has improved dramatically since the 1930s. Just check any data source (government conspirators), and you will see that with improved productivity and agriculture, this is true over time in most periods.
However it is still possible, with 2006 dollars, to eat for less than $20/week:
Source .
« go back — keep looking »Archives
- July 2026
- June 2026
- May 2026
- April 2026
- March 2026
- February 2026
- January 2026
- December 2025
- November 2025
- October 2025
- September 2025
- August 2025
- July 2025
- June 2025
- May 2025
- April 2025
- March 2025
- February 2025
- January 2025
- December 2024
- November 2024
- October 2024
- September 2024
- August 2024
- July 2024
- June 2024
- May 2024
- April 2024
- March 2024
- February 2024
- January 2024
- December 2023
- November 2023
- October 2023
- September 2023
- August 2023
- July 2023
- June 2023
- May 2023
- April 2023
- March 2023
- February 2023
- January 2023
- December 2022
- November 2022
- October 2022
- September 2022
- August 2022
- July 2022
- June 2022
- May 2022
- April 2022
- March 2022
- February 2022
- January 2022
- December 2021
- November 2021
- October 2021
- September 2021
- August 2021
- July 2021
- June 2021
- May 2021
- April 2021
- March 2021
- February 2021
- January 2021
- December 2020
- November 2020
- October 2020
- September 2020
- August 2020
- July 2020
- June 2020
- May 2020
- April 2020
- March 2020
- February 2020
- January 2020
- December 2019
- November 2019
- October 2019
- September 2019
- August 2019
- July 2019
- June 2019
- May 2019
- April 2019
- March 2019
- February 2019
- January 2019
- December 2018
- November 2018
- October 2018
- September 2018
- August 2018
- July 2018
- June 2018
- May 2018
- April 2018
- March 2018
- February 2018
- January 2018
- December 2017
- November 2017
- October 2017
- September 2017
- August 2017
- July 2017
- June 2017
- May 2017
- April 2017
- March 2017
- February 2017
- January 2017
- December 2016
- November 2016
- October 2016
- September 2016
- August 2016
- July 2016
- June 2016
- May 2016
- April 2016
- March 2016
- February 2016
- January 2016
- December 2015
- November 2015
- October 2015
- September 2015
- August 2015
- July 2015
- June 2015
- May 2015
- April 2015
- March 2015
- February 2015
- January 2015
- December 2014
- November 2014
- October 2014
- September 2014
- August 2014
- July 2014
- June 2014
- May 2014
- April 2014
- March 2014
- February 2014
- January 2014
- December 2013
- November 2013
- October 2013
- September 2013
- August 2013
- July 2013
- June 2013
- May 2013
- April 2013
- March 2013
- February 2013
- January 2013
- December 2012
- November 2012
- October 2012
- September 2012
- August 2012
- July 2012
- June 2012
- May 2012
- April 2012
- March 2012
- February 2012
- January 2012
- December 2011
- November 2011
- October 2011
- September 2011
- August 2011
- July 2011
- June 2011
- May 2011
- April 2011
- March 2011
- February 2011
- January 2011
- December 2010
- November 2010
- October 2010
- September 2010
- August 2010
- July 2010
- June 2010
- May 2010
- April 2010
- March 2010
- February 2010
- January 2010
- December 2009
- November 2009
- October 2009
- September 2009
- August 2009
- July 2009
- June 2009
- May 2009
- April 2009
- March 2009
- February 2009
- January 2009
- December 2008
- November 2008
- October 2008
- September 2008
- August 2008
- July 2008
- June 2008
- May 2008
- April 2008
- March 2008
- February 2008
- January 2008
- December 2007
- November 2007
- October 2007
- September 2007
- August 2007
- July 2007
- June 2007
- May 2007
- April 2007
- March 2007
- February 2007
- January 2007
- December 2006
- November 2006
- October 2006
- September 2006
- August 2006
- Older Archives
Resources & Links
- The Letters Prize
- Pre-2007 Victor Niederhoffer Posts
- Vic’s NYC Junto
- Reading List
- Programming in 60 Seconds
- The Objectivist Center
- Foundation for Economic Education
- Tigerchess
- Dick Sears' G.T. Index
- Pre-2007 Daily Speculations
- Laurel & Vics' Worldly Investor Articles