Jun
11
 One of the most common problems when studying markets is deciding whether to study levels, or the changes themselves. For example, when looking at weekly levels of stock market prices, one knows that the changes between the consecutive closes might not contain all the regularities, yet by analyzing the levels one runs into the problem of serial correlation, with levels near the previous being much more likely than the mean level.
In Data Analysis Tools # 11, which I found helpful in writing this piece, they list four reasons for such serial correlation:
- The market has a trend within the period. In the following case the levels at the beginning are closer together than the levels at the end of the period, which is what makes the serial correlation.
- The market varies seasonally, which has been overlooked. This would apply more to economic announcements, with the always suspect seasonality corrections.
- The market is missing some explanatory variables that are serially correlated, like bonds and the dollar.
- The market includes random noise that is serially correlated or that has persistent effect, (that being the name of the game of course).
The usual method of handling this problem is to take first differences, but this has several technical problems due to the implicit assumption one has to make as to the correlation between the consecutive levels and errors. There are several parametric solutions to this, but as far as practical market work goes, they induce so much data fitting and variability to the analysis. In my opinion they are merely window dressing for academic practitioners, whose purpose is to invent methods that are results impossible to duplicate by the layman, therefore maintaining the academics' ivory towers, useful for consulting and marketing purposes.
A solution that is often used for for problems of this nature is to take the ranks of the levels of changes and apply the normal methods of correlation on the ranks. Whilst going through the book Rank Correlation Methods, I wondered if the use of Tau as a correlation measure might unravel many of the statistical problems in testing for randomness in such a series. I reflected on such, and came across several papers that had taken similar technical approaches, including a Kendall's Tau for Autocorrelation by Ferguson et. al., in the Canadian Journal of Statistics.
The results and procedures of that paper are interesting, but I found it better to continue pursing the subject on my own, as I believe the methodology and approach I take is more direct and relevant to market analysis. Let us start with what Tau is, adopted from Kendall himself.
Suppose a number of boys are ranked according to their ability on mathematics and music:
BOY A B C D E
Math 7 4 3 10 6
Music 5 7 3 10 1
Let us consider boys A and B; B is below A on math, but on music, B is above A — their ranks are in opposite order in this comparison. Now if we look at C, he is below A on math and below A on music, making it in natural order. D is above A in both subjects, so again this in natural order. E is also below A on both, so in natural order. Three of A's relationships were in natural order and one was not.
Let us now focus on boy B. He is in natural order with C, natural order with D and in opposite order with E. That is 2 in natural order in 1 out. Now C is in natural order with D and E. That is two more relationships in natural order. D is in Natural order with E, which is another relationship in natural order — thus of ten possible comparisons, there were eight in natural order, and two not.
Tau would be computed as six out of ten (the number concordant minus the number discordant), and it could have varied from plus one to minus one.
Now let us consider using Tau as a test for trend, where we look at time as one variable and price as the other. Here are prices starting with Friday January 5th and ending with Friday January 12th, this year.
DAY NATURAL LEVEL
Fri, 05, 1 1442.3
Mon, 08 2 1448.5
Tue, 09 3 1446.7
Wed, 10 4 1450.6
Thur, 11 5 1457.6
Fri, 12 6 1467.6
There are fifteen possible comparisons here, and of these fifteen, only one is discordant, (out of natural order) — Tuesday with Wednesday, with Wednesday being down from Tuesday, but coming later in the week. Thus there were 14 in natural order, and tau for the week would be 13/15 = 0.87.
I believe that the absolute value of Tau computed in such a manner for each week, with positive Tao meaning a positive trend and vice versa, is a good measure of the trendiness in the market for the week. Here are Tau calculations for the first few weeks of the year, and then last week, for S&P futures.
Week Ending Tau measure of Trend.
Jan 05 -0.6
Jan 12 0.90
Jan 19 -0.6
Jan 26 -0.2
Feb 02 0.9
Feb 09 0.07
Feb 16 0.7
Feb 23 -0.60
Jun 08 -0.7
The tendencies are apparent even in this cursory analysis, which will doubtless be finalized by the young intern scion, and compared with the random character of the actual price changes in the series, by the artful simulator, Mr. Tom Downing.
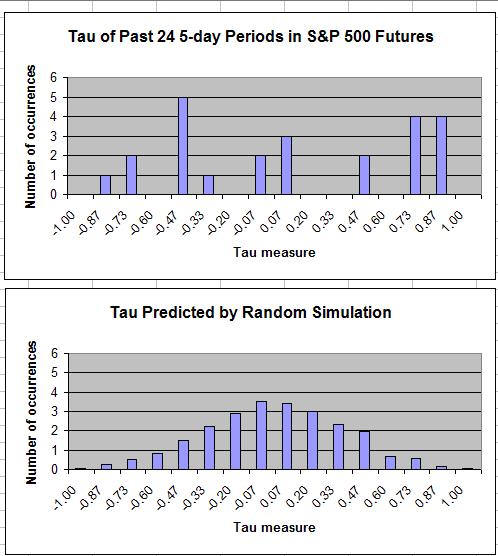
Steve Ellison adds:
I generated 2400 random sequences of 6 numbers and calculated the tau measures of each sequence. I then calculated the tau measure for each of the past 24 5-day periods in the S&P 500 futures. The distribution of the S&P 500 tau measures appears quite different from the randomly generated distribution.
Comments
Archives
- July 2026
- June 2026
- May 2026
- April 2026
- March 2026
- February 2026
- January 2026
- December 2025
- November 2025
- October 2025
- September 2025
- August 2025
- July 2025
- June 2025
- May 2025
- April 2025
- March 2025
- February 2025
- January 2025
- December 2024
- November 2024
- October 2024
- September 2024
- August 2024
- July 2024
- June 2024
- May 2024
- April 2024
- March 2024
- February 2024
- January 2024
- December 2023
- November 2023
- October 2023
- September 2023
- August 2023
- July 2023
- June 2023
- May 2023
- April 2023
- March 2023
- February 2023
- January 2023
- December 2022
- November 2022
- October 2022
- September 2022
- August 2022
- July 2022
- June 2022
- May 2022
- April 2022
- March 2022
- February 2022
- January 2022
- December 2021
- November 2021
- October 2021
- September 2021
- August 2021
- July 2021
- June 2021
- May 2021
- April 2021
- March 2021
- February 2021
- January 2021
- December 2020
- November 2020
- October 2020
- September 2020
- August 2020
- July 2020
- June 2020
- May 2020
- April 2020
- March 2020
- February 2020
- January 2020
- December 2019
- November 2019
- October 2019
- September 2019
- August 2019
- July 2019
- June 2019
- May 2019
- April 2019
- March 2019
- February 2019
- January 2019
- December 2018
- November 2018
- October 2018
- September 2018
- August 2018
- July 2018
- June 2018
- May 2018
- April 2018
- March 2018
- February 2018
- January 2018
- December 2017
- November 2017
- October 2017
- September 2017
- August 2017
- July 2017
- June 2017
- May 2017
- April 2017
- March 2017
- February 2017
- January 2017
- December 2016
- November 2016
- October 2016
- September 2016
- August 2016
- July 2016
- June 2016
- May 2016
- April 2016
- March 2016
- February 2016
- January 2016
- December 2015
- November 2015
- October 2015
- September 2015
- August 2015
- July 2015
- June 2015
- May 2015
- April 2015
- March 2015
- February 2015
- January 2015
- December 2014
- November 2014
- October 2014
- September 2014
- August 2014
- July 2014
- June 2014
- May 2014
- April 2014
- March 2014
- February 2014
- January 2014
- December 2013
- November 2013
- October 2013
- September 2013
- August 2013
- July 2013
- June 2013
- May 2013
- April 2013
- March 2013
- February 2013
- January 2013
- December 2012
- November 2012
- October 2012
- September 2012
- August 2012
- July 2012
- June 2012
- May 2012
- April 2012
- March 2012
- February 2012
- January 2012
- December 2011
- November 2011
- October 2011
- September 2011
- August 2011
- July 2011
- June 2011
- May 2011
- April 2011
- March 2011
- February 2011
- January 2011
- December 2010
- November 2010
- October 2010
- September 2010
- August 2010
- July 2010
- June 2010
- May 2010
- April 2010
- March 2010
- February 2010
- January 2010
- December 2009
- November 2009
- October 2009
- September 2009
- August 2009
- July 2009
- June 2009
- May 2009
- April 2009
- March 2009
- February 2009
- January 2009
- December 2008
- November 2008
- October 2008
- September 2008
- August 2008
- July 2008
- June 2008
- May 2008
- April 2008
- March 2008
- February 2008
- January 2008
- December 2007
- November 2007
- October 2007
- September 2007
- August 2007
- July 2007
- June 2007
- May 2007
- April 2007
- March 2007
- February 2007
- January 2007
- December 2006
- November 2006
- October 2006
- September 2006
- August 2006
- Older Archives
Resources & Links
- The Letters Prize
- Pre-2007 Victor Niederhoffer Posts
- Vic’s NYC Junto
- Reading List
- Programming in 60 Seconds
- The Objectivist Center
- Foundation for Economic Education
- Tigerchess
- Dick Sears' G.T. Index
- Pre-2007 Daily Speculations
- Laurel & Vics' Worldly Investor Articles