Nov
8
An Strange Question, by Kim Zussman
November 8, 2011 | 2 Comments
Why would people PAY the government to take their money?
WSJ: Paying to Give U.S. Money? Some Like Idea [registration may be required]
By MIN ZENG
With yields plummeting on U.S. government bonds, the Treasury Department has quietly asked some banks if they would agree to buy new short-term bills offering yields below zero.
Effectively, the Treasury is asking investors if they are willing to pay the government to take their money. And some big banks have answered, "Yes."
It may sound crazy, but yields on Treasurys of less than three-month maturity are already occasionally trading below zero in the secondary market. Under current auction rules, though, the Treasury can't sell so-called T-bills with a negative yield. In the bond market, however, higher yields mean lower prices, so the Treasury is effectively losing out every time it sells bills with higher yields than the prevailing level in the market.
The question was included in a questionnaire the Treasury delivered on Oct. 14 to the 22 primary dealer banks that are obligated to bid on primary auctions of its debt.
[…]
Gibbons Burke comments:
It is just another form of protection racket. For a small tribute, you can keep your money.
Victor Niederhoffer comments:
The banks are so indebted to the government for their survival and bonuses and trading and purchase of distressed assets, and redeeming of sovereign debt, and capital at the funds rate, and bailouts, and investments et al , and freedom out of hotels that they are happy to accommodate their masters on the Hill with any emoluments like paying the master a fee for the privilege of holding the master's…
Oct
28
Selling Tails to the Middle, by Kim Zussman
October 28, 2011 | 2 Comments
 Last night at a fund-raising event I met the chairwoman of the local classical orchestra. They have been struggling financially for years, and worse lately even though the second recession in three years ended this week.
She told me the musicians make $150-250 per day–and I didn't tell her this was about half of what a dental hygienist makes. We lamented that the symphony's efforts to interest young people in classical music had largely failed, and wondered why there wasn't greater interest in classical music. As this lady hailed from a formerly socialist / currently mafia part of the world that gets people kicked off spec-list, I explained that in free capitalist markets financial resources gravitate toward areas of greatest demand. Thus classical music is not much in demand by the majority of people, and marketing to them will not get results.
Afterwards we went to a nice restaurant and had dinner near the bar. The place was very busy–which seemed surprising for a weeknight just after another recession. Apparently the internet age speeds us up. We had a good view of the bar, as well as the two cute hostesses in their twenties. Nearby an older single model with colored hair and unbuttoned shirt was seated at the bar. You could tell because he wore a diagnostic shibboleth that used to be much more common: a necklace with a dangling gold-plated razor blade.
He kept stopping the cuter blond hostess and chatting with her. At first she was too busy, but eventually she heard him out for about five minutes; politely listening and making good eye contact. Suddenly grandpa handed her $100, saying "take this for your four year old".
When I was little an old Jewish man gave me a penny. I quickly did the inflation calculation and realized a value transaction had occurred, and that free markets would never die.
Oct
28
Darwin > Smith? from Kim Zussman
October 28, 2011 | Leave a Comment
 "The Darwin Economy: Liberty, Competition and the Common Good"
Professor Frank draws comparisons between Adam Smith's "invisible hand" theory and Darwin's innate understanding of competition. As a pioneering naturalist and not an economist himself, Frank states that Darwin helps describe the economic reality of our current world much more accurately than Smith's and predicts that Darwin will be seen by most economists as the intellectual founder of their discipline within the next century. The book expands on this theory, elaborates on how Darwin's theories relate to our current situation, and how Darwin's insights can help us in the future.
Oct
27
The Other Greek Tragedy (Averted Again), from Kim Zussman
October 27, 2011 | Leave a Comment
In less than a month, by virtue of modern technology, the story went from near-certain Greek government default and coordinated/global ECRI-vetted recession to……. this. [Just for fun… Stimpy cartoon, 3 minutes]
Oct
26
Income Mobility 1996-2005, from Kim Zussman
October 26, 2011 | Leave a Comment
Interesting study from the US Treasury (2007):
Income Mobility in the U.S. from 1996 to 2005
Some excerpts:
• There is considerable income mobility of individuals in the U.S. economy over the 1996 through 2005 period. More than half of taxpayers (56 percent by one measure and 55 percent by another measure) moved to a different income quintile between 1996 and 2005. About half (58 percent by one measure and 45 percent by another measure) of those in the bottom income quintile in 1996 moved to a higher income group by 2005.
• Median incomes of taxpayers in the sample increased by 24 percent after adjusting for inflation. The real incomes of two-thirds of all taxpayers increased over this period. Further, the median incomes of those initially in the lowest income groups increased more in percentage terms than the median incomes of those in the higher income groups. The median inflation-adjusted incomes of the taxpayers who were in the very highest income groups in 1996 declined by 2005.
• The composition of the very top income groups changes dramatically over time. Less than half (40 percent or 43 percent depending on the measure) of those in the top 1 percent in 1996 were still in the top 1 percent in 2005. Only about 25 percent of the individuals in the top 1/100th percent in 1996 remained in the top 1/100th percent in
2005.• The degree of relative income mobility among income groups over the 1996 to 2005 period is very similar to that over the prior decade (1987 to 1996). To the extent that increasing income inequality widened income gaps, this was offset by increased absolute income mobility so that relative income mobility has neither increased nor decreased over the past 20 years [emphasis added]
Oct
6
A Thought for Today October 6, 2011, from Kim Zussman
October 6, 2011 | 2 Comments
It is tempting to think the recent market top marked by the death of an agent of destruction of free will, creation, and human progress (Osama Bin Laden, D-5/2/11), will be book-ended by a bottom on the passing of an emblem of unafraid creativity, entrepreneurial spirit, and inspired human curiosity (Steve Jobs, D-10/5/11).
The memory of his life recalls the transition from Carter's malaise to Reagan's unashamed patriotism, only this time it is for capitalism.
Steve Jobs Stanford Commencement Speech 2005
Oct
5
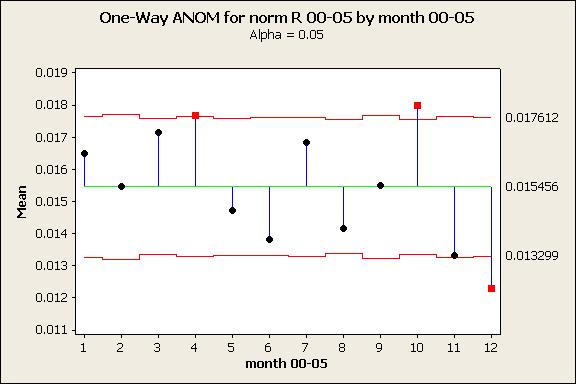
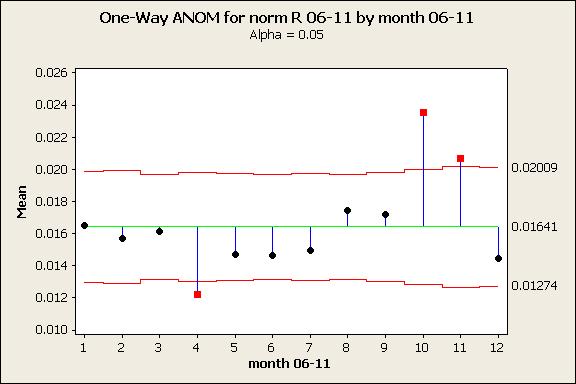
The Behavior of Volatility in October, from Kim Zussman
October 5, 2011 | Leave a Comment
Daily SPY was used to calculate volatility as normalized range:
norm range = (H-L) / {(H+L)/2}
The attached compares mean normalized daily range by month; first period was 2000-2005, and the second period 2006-sept 2011.
In both periods, mean normalized daily range for Octobers (month 10) exceeds the global mean.
Oct
5
Where Are They Now?, by Vince Fulco
October 5, 2011 | Leave a Comment
Since the Fed Head expressed great satisfaction with asset inflation through the capital markets, particularly stocks, just a short time ago, surely he can't throw his theory and intervention(s) out of the window so soon? Blunt instrument indeed.
Kim Zussman comments:
BBQ phase change from warming the corporate economy to juicing the protesters and the electorate.
Oct
3
From Dept of ETF-Everything: SPLV, from Kim Zussman
October 3, 2011 | Leave a Comment
SPLV is an ETF with the 100 lowest-volatility stocks in the SP500, which started trading May 2011. Using close-close daily returns, here is regression of SPLV vs SPY:
The regression equation is SPLV = 0.000693 + 0.697 SPY
Predictor Coef SE Coef T P
Constant 0.0007 0.00038 1.83 0.070
SPY 0.69662 0.02207 31.57 0.000
S = 0.00383423 R-Sq = 90.8% R-Sq(adj) = 90.7%
beta of SPLV is 0.7, and alpha for the 4-month down period is almost significant 0.07%.
And so far SPLV is indeed less volatile than SPY (comparison of variance of daily returns):
Test for Equal Variances: SPLV, SPY
95% Bonferroni confidence intervals for standard deviations
N Lower StDev Upper
SPLV 103 0.0108657 0.0125769 0.0148974
SPY 103 0.0148627 0.0172035 0.0203776
F-Test (normal distribution) Test statistic = 0.53, p-value = 0.002
Levene's Test (any continuous distribution) Test statistic = 4.72, p-value = 0.031
Oct
2
Interesting Chart of the Day, from Victor Niederhoffer
October 2, 2011 | Leave a Comment
Interesting chart of the day.
Kim Zussman adds:
Plotting Intrade vs SPY shows congruence over the period (including sell-the-news post Osama). However the daily change is not significantly correlated:
Pearson correlation of chg spy and ch barry = 0.109
P-Value = 0.138
Oct
2
Perfunctory Quarter Study, from Kim Zussman
October 2, 2011 | 1 Comment
The calendar quarter just ended saw the SP500 lose 14.4%. Since 1951 there have been 17 quarters with SP500 return less than -10%. The subsequent quarters had mean return of 5%, though not significantly different from all quarters 1951-2011:
Two-sample T for next Q vs all Q
N Mean StDev SE Mean
nxt Q 17 0.0495 0.0985 0.024 T=1.2
all Q 245 0.0209 0.0779 0.0050
Date qtr ret nxt Q
Sep-10 -0.119 0.107
Jun-09 -0.117 0.152
Mar-09 -0.226 -0.117
Dec-02 -0.176 0.079
Sep-02 -0.137 -0.176
Dec-01 -0.150 0.103
Jun-01 -0.121 0.055
Dec-98 -0.103 0.209
Dec-90 -0.145 0.079
Mar-88 -0.232 0.048
Dec-81 -0.115 0.055
Dec-75 -0.119 0.075
Dec-74 -0.261 0.079
Mar-74 -0.100 -0.037
Sep-70 -0.189 0.159
Sep-62 -0.213 0.028
Dec-57 -0.104 -0.057
Sep
29
When Things Change, from anonymous
September 29, 2011 | Leave a Comment
One posits that dependency on the past is sacrosanct to all trading/ investing, and when past relationships break down there is always the question whether the current instance is a temporary state or regime change. (2008-09 contained many such, as well as a few more recent examples).
This reduces further to how well success in markets (life, etc) tightly correlate with intelligence, learning from study and experience, and discipline, and what happens to successful trend followers (which all living creatures are) when the trend dies and nature deals out an extinction. The quaint notion that fear is conserved in the genome for a reason.
Ralph Vince writes:
As the Old Frenchman would have put it, stamping out his Gitane on the dashboard itself, "Adaptation…..The first rule of survival."
anonymous writes:
Clearly, it would be best to know in advance if things that worked in the past stop working. But aside from a very very few circumstances (true arb is the only one that comes to mind, and even that relies on technology working), do traders ever have this knowledge? Instead, isn't money management of some sort used?
With respect, for example, enter a tiny amount, if it works, put on more, if it doesn't work, but the idea remains the same, take off some and wait for a truly outrageous spread to try again, if it never works, exit and take it off the screen or something etc.
Ralph Vince talks about not needing to predict movement to make money and I keep thinking about this.
Sep
28
The Marathon Record Indicator, from Russ Sears
September 28, 2011 | Leave a Comment
 The men's marathon record was broken this week end at the Berlin Marathon, pending ratification, by Patrick Makau with time of 2:03:38. Beating the old record Sept. 2008 record by Haile Gebrselassie by 21 seconds. The record has been broken with some regularity since the mid 1930s when the depression caused men to look for any way to make a living or bolster their reputation to get and keep a job.
It has occurred to me that the record tends to be broken when the economy is in long term trouble and when the young are having hard time finding opportunity elsewhere. The record broken by decade is as follows: 1930, 3; 1940, 1; 1950 6; 1960 9;1970 3; 1980, 5; 1990 2, 2000 4, 2010 1st last weekend. Marathoning is a tough way to make a living and the competition, at least in my time, has appeared to get stronger as the stock market tanks and gets weaker as it is about to take off. I missed my opportunity by not taking up serious marathoning in 1992 but waiting till 1996, 1992 was when I was at my peak and the competition was weakest.
Below is a comma delineated file with the month the record was broken, the % change in the Dow Index 12 months prior (counting month record broke), and the 12 month after % change in Dow index.
Here are some key statistics:
12 month prior avg. 3.22% stdev 13.64% count 34 negative count 15
12 month after avg 13.59% stdev 21.06% count 33 negative count 7
Student T test 2 different stdev one tail, 1.14%
It would appear that the marathon tends to be broke at the turning points in the Dow, however with a wider deviation than prior and the last 2 times this did not work. A similar result occur taking out all but the first occurrence when the record is broke within 12 months of the last time, except the student T test is higher due to fewer occurrences.
Month Record Broke,Prior 12 month % change in Dow,Next 12 month % change in Dow, New Record
3/1/1935,0.47%,55.13%,2:27:49
4/1/1935,8.92%,55.13%,2:26:44
11/1/1935,38.27%,26.77%,2:26:42
4/1/1947,-17.47%,0.00%,2:25:39
5/1/1952,5.32%,6.65%,2:20:42
6/1/1953,-2.19%,20.28%,2:18:40
10/1/1953,2.44%,36.52%,2:18:35
6/1/1954,24.33%,29.73%,2:17:39
8/1/1956,7.23%,-1.79%,2:18:05
8/1/1958,5.01%,34.17%,2:15:17
9/1/1960,-8.16%,15.01%,2:15:16
2/1/1963,-6.37%,15.01%,2:15:16
5/1/1963,18.52%,12.97%,2:14:28
7/1/1963,16.31%,17.63%,2:14:43
6/1/1964,17.63%,11.88%,2:13:55
10/1/1964,15.60%,6.31%,2:12:12
6/1/1965,4.39%,-3.70%,2:12:00
12/1/1967,15.20%,12.48% 2:09:36
5/1/1969,4.29%,-22.53% 2:08:34
7/1/1970,-9.98%,30.37% 2:09:29
12/3/1973,-16.58%,-17.75% 2:09:12
2/1/1978,-20.75%,9.00% 2:09:06
4/1/1980,-4.43%,27.76% 2:09:01
12/1/1981,-9.23%,16.91% 2:08:18
10/1/1984,-1.45%,10.10% 2:08:05
4/1/1985,7.46%,43.56% 2:07:12
3/1/1988,-13.74%,9.02% 2:06:50
9/1/1998,-1.29%,43.64% 2:06:05
10/1/1999,24.88%,3.04% 2:05:42
4/1/2002,-7.35%,-23.18% 2:05:38
8/1/2003,8.68%,9.81% 2:04:55
8/1/2007,17.37%,-21.91% 2:04:26
8/1/2008,-13.58%,-19.39% 2:03:59
9/1/2011 -0.15%, ?, 2:03:38
Kim Zussman queries:
Russ, in your opinion, will the 2 hour mark be broken in our lifetime (you and I are about the same age)?
The 12 records since 1980 have dropped in a roughly linear fashion, which if continued extrapolates to about 2035
Russ Sears replies:
If you would have asked me in the 90s about this, I would have said no way, they are beginning to form an asymptote. However, I believe sport science has made considerable progress in 2 areas critical to lowering this record below 2 hours.
1. There is a much better understanding of the altitude effect has in endurance training and how to maximize this effect.
2. There are now much more creative ways to exercise more with less detrimental stress but maintaining the positive stress and exercise specifics. See zero gravity treadmills and water running treadmills for example.
And perhaps it simply is competition creates its own opportunity and it is clear to me we are in a new competitive era for distance running.
Hopefully it will continue for the rest of our lives. But not because the economy will continue to flounder. Especially for the young, ambitious and talented.
Larry Williams comments:
The math is all a runner has to do is knock 8 seconds a mile of his/her pace. Much easier said than done, but it's a goal within reach. 2:00:00 will be broken in next 10 years is my forecast. Mostly because of what Russ said–better training habits and knowledge. With science, a runner with lots of personal angst will break through. Must have personal angst (see current frank shorter article in Runners World) to get through the pain.
Sep
25
SP500 Level and Yield Curve, from Kim Zussman
September 25, 2011 | Leave a Comment
The attached is a plot of log SPX vs contemporaneous yield curve (10Y-2Y), monthly 1976-August 2011. Dates are not shown, but the plot is a continuous (albeit mathematically not one-to-one) and shows various regimes between log SPX and 10Y-2Y.
The series starts in 1976 at the red dot near the bottom. Stocks (vertical axis) made little headway while 10Y-2Y varied above and below zero, making a series low about -2 in 1980. From the early 1980's to 1990's, stocks moved sharply upward, with 10Y-2Y varying between slightly negative and +1.5. From 1990 to 1992 (~Iraq I), stocks moved up while 10Y-2Y widened. From 1992-94, stocks went up while 10Y-2Y narrowed. From 1994-2000, stocks rose strongly while 10Y-2Y remained in a tight range (activist FED?), and 10Y-2Y went negative when stocks peaked in 2000. From 2000 - 2011 (green dot), 10Y-2Y varied considerably from -0.4 to +2.8 while log SPX was range-bound with considerable variation.
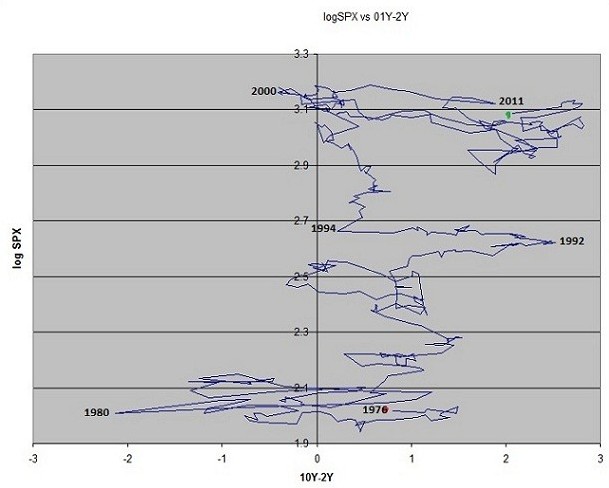
The recent picture - range-bound stocks with varying yield curve - resembles the late 1970's, and the overall pattern suggests no consistent relationship between stock levels and 10Y-2Y.
Steve Ellison writes:
Attached is a regression graph of 1981-2010 S&P 500 annual returns vs. the difference between the 10-year yield and 3-month yield at the beginning of the year. N0, t=1.06, p=0.30, Rsq=0.04

The results I posted earlier that showed significance were the second year's S&P 500 returns regressed against the 10-year/3-month yield differential. That result seems suspicious–why should year-old data be more predictive than current data? 2011 so far is not going according to form.
George Zachar adds:
Because between Volcker's rise and Lehman's fall, the main way the curve steepened was when the Fed lowered rates in the front end, stimulating the economy and stocks, months down the road.
Sep
25
Silver and Gold, from Kim Zussman
September 25, 2011 | Leave a Comment
This is a chart of ratio GLD/SLV (gold and silver ETFs, daily, from SLV inception 2006 to last Friday).
The big move down (=relative SLV up) began with the inception of QE2 in Aug 2010, and stopped around the recent top in stocks April 2011.
Just for fun: listen to "Silver and Gold" on youtube.

Sep
25
Risk Free Assets, from Charles Pennington
September 25, 2011 | Leave a Comment
If yields on all treasuries of all durations are going to zero forever and ever, it seems possible that a bubble could develop in the Falkenstein-ish safety stocks, the Proctor and Gambles, the Pepsis, the Philip Morrises–anything that has a 2-3 percent dividend yield that's expected to grow slowly with minimal risk and minimal connection to the economy.
Kim Zussman writes:
Relatedly, what exactly is a risk-free asset?
Sep
9
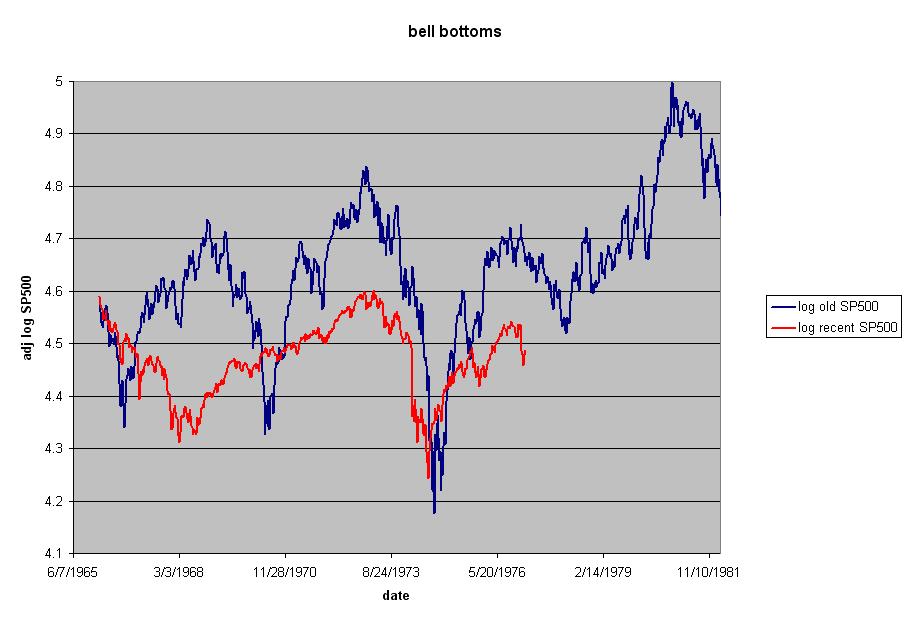
Bell Bottom Blues, from Kim Zussman
September 9, 2011 | 1 Comment
This is a plot of log SP500 for the period 2/66-2/82, along with a time-shifted / log adjusted plot of log SP500 from 8/00-present. Both plots were aligned so they originate at what was then a local maximum, and show (not adjusted for dividends or inflation) what happened to stocks in ensuing years.
The first 10 years of these periods are similar as there is no "upward drift". During the recent 11 years stocks made three major highs and two major lows, whereas the similar (net/flat) period 66-77 had 4 major tops and 3 major bottoms. In addition to the recent period's less frequent periods, the peak/valley has been far less than the older interval.
Interesting also to consider other differences not shown on the chart, including results of US military action, inflation levels, bond yields, age of depression-era children, age of post-war baby boomers, evolution of the equity culture, widespread indexation, and globalization of economies and markets.
Stefan Jovanovich replies:
Great stuff, Kim. My feeble model compares the present to the late 70s/early 80s. The difference is the world's Bond Markets, which are now the opposite of what they were during that period. Good credits are now as much overbought as they were oversold then. Gold's price is equally high because then people were hedging against cost-push inflation while now they are hedging against deliberate currency depreciation by the central banks. Back then the gold market was disappointed when further cost-push inflation failed to materialize after Reagan and Thatcher made it clear they were not going to give in to the unions. This time the fears of further currency depreciation will be disappointed as the electorates in the U.S., U.K. and Germany decide that they want the central banks to tear up their credit cards and drain the punch bowl. Gold will then have to compete with actual returns for CDs and other conventional savings. But, then, how can stock prices rise? The answer is that the cost of borrowed capital is now a negligible part of the overall expense of currently doing business and irrelevant to consumer demand. The promise of diminished regulatory and steady (i.e. no longer rising) commodity costs will offset the added costs of higher interest rates for businesses 10 or even 100 times over; and - miracle of miracles - there will be an increased consumer demand from the savers - i.e. the people living off the interest rates from CDs. This is, of course, exactly the opposite of the Fed's diagnosis that we need to somehow reduce lending rates further to "prime" the economic pump so the borrowers can go more cheaply in debt; but then, what would you expect from people who walk by Woodrow Wilson's statue every day without gagging.
Aug
29
HPQ Pinned, from Kim Zussman
August 29, 2011 | Leave a Comment
Though stocks rose steadily through the day, Hewlett-Packard rose in the morning then was pinned at or near 26 for 3 hours before floating up a bit more in the last hour.
Anatoly Veltman writes:
A very unusual chart indeed! HPQ was noted among Paulson's holdings. One might guess that other "size people" that Paulson talks to MAY well be stuck with it as well. We're in the era when HFT's sit ahead of any offer they've sniffed — so getting out is problematic…
Aug
24
Thoughts on the Federal Reserve Bank of SF Paper on Middle Savers and Old Spenders, from Mr. M.G.
August 24, 2011 | Leave a Comment
There is a paper making the rounds from the FRBSF that looks at the predictive relationship between "middle" savers (40-49) and "old" spenders (60-69) for equity market P/E ratios. The paper demonstrates a relationship between the M/O ratio and historical market P/E ratios from 1954-2010. The paper is a quick read.
The conclusion that is getting the attention reads:
Historical data indicate a strong relationship between the age distribution of the U.S. population and stock market performance. A key demographic trend is the aging of the baby boom generation. As they reach retirement age, they are likely to shift from buying stocks to selling their equity holdings to finance retirement. Statistical models suggest that this shift could be a factor holding down equity valuations over the next two decades.
A couple of quick points on the FRBSF economic letter:
1) The key paragraphs in terms of stock implications are:
Since we have forecast a path for the P/E ratio, predicting stock prices is straightforward if we can project earnings, the E part of the ratio. For this purpose, we assume that, in the next decade, real earnings will grow steadily at the same average 3.42% annual rate by which they grew from 1954 to 2010. To obtain real earnings, we deflate nominal earnings by the consumer price index.
The model-generated path for real stock prices implied by demographic trends is quite bearish. Real stock prices follow a downward trend until 2021, cumulatively declining about 13% relative to 2010. The subsequent recovery is quite slow. Indeed, real stock prices are not expected to return to their 2010 level until 2027. On the brighter side, as the M/O ratio rebounds in 2025, we should expect a strong stock price recovery. By 2030, our calculations suggest that the real value of equities will be about 20% higher than in 2010.
Note that they are using "real" stock prices. Converting this to nominal using currently depressed inflation expectations of 2.01% over the next decade (from TIP breakevens) implies an increase in stock prices that is roughly 50% higher than what is priced into long-term S&P options. If they are right (and I think they are wrong), then the returns to equities using long-term options should be around 3.7% over the next decade (better than government bonds) while the returns to holding the S&P should be roughly the same 3.65% due to dividends received over the next decade.
They are also making an assumption that trend earnings growth mimics that of 1954-2010. They are calculating this using a straight line two point growth. Fortunately, they ignore that 1954 earnings were roughly 50% above long-term trend lines while 2010 earnings are roughly 30% below trend. Using an actual trend line (rather than point to point) growth would imply that S&P earnings should grow 10% per year over the next decade (this makes more sense if you forget about "peak margin" nonsense and recognize the current profit levels are against a very depressed economic output line). Using their other data (dubious for reasons articulated above and below) and trend earnings would imply the S&P should rise roughly 83% over the next decade (to ~2,100). This would yield returns from long-term options of 22.3% per year over the next decade while holders of the S&P should receive returns of 8.1% per year.
2) They "fit" data from 1954 to 2010. There is a reason for this choice of data sets — it's the only one that works. The demographic data offers zero explanatory power for periods prior to 1954 for one very simple reason — the proportion of the population that was aged 60-69 (their "old" people who are supposedly liquidating assets) was far, far lower. This would imply that P/E ratios should have been stratospheric in the pre-1954 period. We can see a tease of this in their chart that shows rising P/E ratios from 1964-1954 on their "model generated" line. Pre-1954, this model generated P/E would have risen dramatically. In contrast, they were depressed. As a result, I would strongly question whether we can generate any real insights on the forward direction of P/E ratios from this analysis.

The reality of all this nonsense is that when equity markets are low and falling, most people will offer explanations for why they are low and falling. Those arguments will sound intelligent until equity prices begin rising inexplicably. Then they will rage against the "bubble" until they suddenly see the light and argue we are at a permanently higher plateau.
Kim Zussman writes:
This is a variant of the "sell to whom" question posed by Jeremy Siegel in "Stocks for the Long Run". ie, when boomers retire and they change from saving to consumption, who will buy their stocks?
Siegel's suggestion was younger people of developing nations / emerging markets. Given the known tendency for people to invest closer to home, why wouldn't up and coming Indians and Chinese buy domestic vehicles rather than SPY?
Jason Ruspini writes:
Whatever problems we think we see with such studies, it is an embarrassment for economics that the effects of demographics, globalization, and diffusion of technologies are not more widely studied and understood. This provides cover for all sorts of claims like "tax rates were higher in 1950 and 1990 and we had excellent growth then…"
Russ Sears adds:
While I agree that studying the effects of the predictable real economy on the real economy should get more study. Further I agree with your implication, that jumping from fiscal/monetary policy to real economy often hides a large amount of nonsense. However, I can not encourage a tunneled vision approach of narrow real effect to narrow real effect. Especially when I see the design of the study to be such that its intent is to keep people from following their natural ambitions and make sure the individual is smaller than he needs to be by discouraging investing in capitalism. They (the govt) only do these studies when this is the case. The nonsense comes by narrowing the line of vision to reach the conclusion that we need them to protect us from ourselves.
Jason Ruspini replies:
This sort of criticism was behind some of the controversy with Tyler's Cowen's book. To those on the right it sounded dangerously like " 'We' should do something! " To those on the left, " 'We' are poor and can't do anything…"
But I don't see why low average rates of return should discourage entrepreneurs. Situations like Apple and Facebook suggest that where there is growth in a low growth environment, money funnels to the innovators just the same if not more vigorously. Regarding Facebook, my sense is that part of the "problem" with current technologies as compared to those of the 19th-20th century is that the latter often compressed time in terms of more efficient communication, travel and production while the former largely serves to fill time with questionable effects on production and average asset returns. Additionally, the diffusion of the latter 20th century type across the world is now past its inflection point.
One other point..
Japan in the '80s through present might be a better complement to the Fed study than the pre-1950s world as suggested in Mr. Green's original email. Equity returns aside, all things equal, more retirees should translate to lower rates. Given sovereign debt, I guess one should say lower real rates.
Russ Sears responds:
The government is in competition with the private sector for capital…In the fiscal world should the retiriees give their capital to Government and let them continue to spend or should they give it to entrepreneuars and let them spend it.
In either case fewer real world projects will begin to those who loss the competition for capital. All things being equal if less money goes to the stock market, few projects are begun and cost of captial is raised. If they cannot get capital from issuing stock, they must issue more debt, real cost of borrowing goes up.
But if real demand for private sector goods are raised and fewer project in the private sector were funded, cost of loans will go up and the profits per $ in the stock market would also increase.
If more money goes to government, the more our government becomes addicted to the low cost of capital, and the more it spends on less and less productive projects.
Am I missing something?
Which do you think will raise the overall wealth the most? Would you believe a government study suggesting investing in the private sector is doomed to low real returns for decades?
Jul
23
European Version of QE, from Paolo Pezzutti
July 23, 2011 | Leave a Comment
 After euro leaders announced a new (big) aid package for Greece and measures to prevent bond yields rising further in Spain and Italy, it seems that Europe has solved its sovereign debt problems…. Markets celebrate the European version of QE. Also Europeans (we'll see what Americans will now do about it, but I think the answer is pretty clear and markets know it) can now delay any tough decisions on deficits. Someone else will pay the bill. Pretty sad. However, markets go up and everybody is happy so far.
Kim Zussman writes:
Do not recall the oft-heard warning that a Greek default or failure to raise US debt limit will result in financial Armageddon prior to the Lehman collapse. That not yet distant memory still has usable power. Perhaps a day's meal in that.
Bruno Ombreux writes:
The 100s of billions will mainly come from the pockets of the German, French and Dutch taxpayers, since the ECB printing powers are limited. As for the Greek, they have lost their sovereignty but they will find freedom though work. You know. Arbeit macht frei. That is at least for the next few months until bailout 3 is needed and the whole show starts again.
Also, about the question from the bleachers: How are the ECB's "printing powers" more limited than the U.S. Federal Reserve's?
read this: European Central Bank
They need to maintain some capital and this capital is provided by the central banks of the member states. They cannot do too outrageously stupid things, because they can get bankrupt if some member state central banks stop capitalizing them.
And you can be sure that the German or Dutch have an uncle point.
Politically, the ECB is also far less inclined to print than the Fed:
- It has only one mandate, low inflation, whereas the Fed has a dual mandate: inflation and economic growth. In effect, the ECB doesn't really care about economic growth. - The German have been paranoid about inflation since Weimar and would not let the ECB go too far. - If you look at the ECB board, it is predominantly hawkish according to analysts and observers that spie every word uttered by these guys.
But the main reason they have less power to print than the Fed is that they have to please a lot of member states. Which creates checks and balances. Whereas the Fed only has to please one guy, the US president, who nominates board members.
John Floyd adds:
Leaving any debates on what is considered QE and what is not.
The ECB has lent to the periphery through its rediscount window Euro 330 billion, this is in addition to the Euro 75 billion in secondary market purchases of peripheral country bonds. The ECB has a capital cushion of about Euro 10 billion. One could argue this might be a stretch of the single mandate of the ECB's 1998 charter.
To Ireland alone the ECB has exposure of Euro 180 billion, or about 100% of Irish GDP.
Other thoughts on the most recent Euro summit:
The general reaction in markets and the street research has been this plan delivers slightly more than expected and is a bold plan. Not surprisingly this has been the analysis of most of the rescue packages globally since 2008. Yet, the failure of the packages on so many levels is fairly evident if one looks at economic growth, interest rate spreads, etc.
The most recent package clearly will buy some time. How much is an open ended question but I expect much less than previous packages as the Pavlovian reaction wears thin.
Amongst the many issues of implementation, political approval, private sector etc. I think the key failings are:
1) There was no increase in the size of EFSF. Furthermore, even the relatively paltry and debatable rating of current EFSF has yet to approved. To cover Spain and Italy would require 1.5-2.0 trillion Euros.
2) Concessions on rates and maturity extensions for Ireland and Portugal are nice but small relative to the fiscal adjustment required.
3) The debt relief to Greece is insignificant and will bring debt to GDP from 172% to around 150-160%, depending on whose estimates you are using.
4) Given that there is not much debt relief and the fiscal adjustment is massive there cannot be much hope that the domestic political willingness in Greece will be there to stay the course.
Jul
19
Finance Sector Factoid, from Kim Zussman
July 19, 2011 | Leave a Comment
In the SP500 Financial sector over the past 3-years, REITs comprised 9 of the top 20 performers and 2 of the bottom 20:
Symbol Company Name Industry Total Return 3 Year
DFS Discover Financial Svcs Consumer Finance 96.97%
AVB AvalonBay Communities Real Estate Investment Trusts (REITs) 76.37%
EQR Equity Residential Real Estate Investment Trusts (REITs) 75.15%
PSA Public Storage Real Estate Investment Trusts (REITs) 60.62%
FHN First Horizon Natl Commercial Banks 58.61%
BEN Franklin Resources Capital Markets 56.50%
SPG Simon Property Group Real Estate Investment Trusts (REITs) 51.61%
VTR Ventas Inc Real Estate Investment Trusts (REITs) 48.09%
AMP Ameriprise Financial Capital Markets 47.82%
TRV Travelers Cos Insurance 42.68%
HCN Health Care REIT Real Estate Investment Trusts (REITs) 40.75%
HCP HCP Inc Real Estate Investment Trusts (REITs) 40.66%
COF Capital One Financial Consumer Finance 38.45%
CB Chubb Corp Insurance 38.35%
AXP Amer Express Consumer Finance 37.44%
HST Host Hotels & Resorts Real Estate Investment Trusts (REITs) 37.21%
CMA Comerica Inc Commercial Banks 36.35%
CINF Cincinnati Financial Insurance 36.01%
MTB M&T Bank Commercial Banks 34.60%
BXP Boston Properties Real Estate Investment Trusts (REITs) 30.82%
Symbol Company Name Industry Total Return 3 Year
PFG Principal Financial Grp Insurance -23.03%
STT State Street Corp Capital Markets -23.64%
KEY KeyCorp Commercial Banks -24.81%
BK Bank of New York Mellon Capital Markets -26.70%
ALL Allstate Corp Insurance -28.30%
NTRS Northern Trust Capital Markets -31.10%
KIM Kimco Realty Real Estate Investment Trusts (REITs) -32.92%
MS Morgan Stanley Capital Markets -35.63%
GNW Genworth Financial'A' Insurance -39.22%
RF Regions Financial Commercial Banks -40.30%
AIZ Assurant Inc Insurance -45.39%
HCBK Hudson City Bancorp Thrifts & Mortgage Finance -45.74%
BAC Bank of America Diversified Financial Services -52.23%
HIG Hartford Finl Svcs Gp Insurance -56.92%
ETFC E Trade Financial Capital Markets -57.54%
JNS Janus Capital Group Capital Markets -59.93%
PLD ProLogis Inc Real Estate Investment Trusts (REITs) -61.70%
C Citigroup Inc Diversified Financial Services -75.05%
AIG Amer Intl Group Insurance -93.36%
Jul
15
Only the Shadow Knows, from Victor Niederhoffer
July 15, 2011 | 1 Comment
 I never look at the news, but I usually can tell what the news is from the market moves, and I would guess at 7 pm, S&P issued their catch up warning on rating change, and yes, I would guess that those selling at 3:55 pm bringing the market to 1301.5 knew that the S&P would join. But they were temporarily discommed by the Google announcement but then baled out by the 7 pm announcement, and then people thought that the first announcement by Moodies did not make the market open down, so maybe like the last announcement that dropped the market to 1301 this one will not have a staying influence, and then the problem is that the options expiration is tomorrow and the "market makers" usually have positions bearish when the market has been going down and 1300 is a target. How to play it? What evil lies in the hearts of men. Only the Shadow knows.
Ken Drees writes:
Skulduggery indeed. That darn Google is messing up my arrangements. Tessio, the underboss who brokered the meeting with Barzini.
Alston Mabry writes:
This sounds like revolution to me. Bond vigilantes riding through the night, striking fear into the hearts of the king's men.
Kim Zussman adds:
"why Moody's or S&P or Fitch or anyone else's rating on US Government debt should have had, or continue to have, any obvious and/or immediate effect on the S&P500 price"
Perhaps in part a conservation process: a back-and-forth conversion of equity capital to political capital. Markets regained much of 08-09 losses in great measure due to government interventions, creating a debt for the beneficiaries. Payment by the class that owns stocks can take the form of higher taxes or lower asset values, in either case accruing to the creditors.
Jul
13
If I Were a Rich Man, from Kim Zussman
July 13, 2011 | 1 Comment
 Market mavens and Shtetl life; what besides women and money can bring man to his knees:
"The attitudes and thought habits characteristic of the learning tradition are as evident in the street and market place as the yeshiva. The popular picture of the Jew in Eastern Europe, held by Jew and Gentile alike, is true to the Talmudic tradition. The picture includes the tendency to examine, analyze and re-analyze, to seek meanings behind meanings and for implications and secondary consequences. It includes also a dependence on deductive logic as a basis for practical conclusions and actions. In life, as in the Torah, it is assumed that everything has deeper and secondary meanings, which must be probed. All subjects have implications and ramifications. Moreover, the person who makes a statement must have a reason, and this too must be probed. Often a comment will evoke an answer to the assumed reason behind it or to the meaning believed to lie beneath it, or to the remote consequences to which it leads. The process that produces such a response—often with lightning speed—is a modest reproduction of the pilpul process.
Not only did the Jews of the shtetl speak a unique language (Yiddish), but they also had a unique rhetorical style, rooted in traditions of Talmudic learning: In keeping with his own conception of contradictory reality, the man of the shtetl is noted both for volubility and for laconic, allusive speech. Both pictures are true, and both are characteristic of the yeshiva as well as the market places. When the scholar converses with his intellectual peers, incomplete sentences, a hint, a gesture, may replace a whole paragraph. The listener is expected to understand the full meaning on the basis of a word or even a sound… Such a conversation, prolonged and animated, may be as incomprehensible to the uninitiated as if the excited discussants were talking in tongues. The same verbal economy may be found in domestic or business circles.
Jul
8
“Unexpected” Poor Jobs Report, from Dan Grossman
July 8, 2011 | 1 Comment
 Is it perhaps an indication of the media's solicitude for the current President that every poor economic report is termed "unexpected"?
While poor economic results under the prior President were somehow not so surprising since he was such an incompetent boob?
Kim Zussman adds:
As with many time series this month was similar to the prior month, which was different from the month before.
Victor Niederhoffer adds:
All are part of the regression fallacy.
Ken Drees writes:
So now we wander into "needed and now expected qe3" type thinking and should not the market go up due to this stimulus?
Sam Marx adds:
Three Thoughts on the Reported Unemployment Rate.
1) The Unemployment Rate is probably higher than the government reported.
2) Compared to the Reagan Recovery this Administration's economic plan is a failure
3) With Socialistic Policies you have high employment rates and I don't see much hope for great improvement.
George Zachar writes:
As luck would have it, Bernanke delivers one of his regular reports to Congress next week.
No doubt, this report will put that question high up on the agenda, and he'll be spending the weekend formulating his response.
Jun
27
Starting with an example, assume yesterday's close was above the simple 10D moving average: will today's close be below the 10D moving average?
Two things change from yesterday to today - today's close will be added to the series, and the close 10 days ago which was part of the moving average will be dropped (as it becomes 11 days ago).
C1 = today's close
C2 = yesterday's close
C10 = close 10 days ago
MAt = 10DMA as of today
MAt = sum(C10:C1)/10 (sum of C10 through C1)
The statement that "today's close < MAt " can be written
C1 < sum(C10:C1)/10
10C1 < sum(C10:C1)
10C1 < C1 + sum(C10:C2) ( Using: sum(C10:C1) = C1 + sum(C10:C2) )
9C1 < sum(C10:C2)
C1 < sum(C10:C2)/9
The right hand side is the 9 day moving average as of yesterday.
Thus today's close is below the ten day moving average if and only if today's close is below yesterday's 9 day moving average.
Jun
23
Protect the Bondholders, from Kim Zussman
June 23, 2011 | Leave a Comment
 Reinhart and Rogoff said governments usually get out of debt crises by default/decree or printing inflation. The next edition will include a chapter on what happens to sovereign debt when a government doesn't control its own currency.
Gary Rogan writes:
When Einstein was a boy, seeing a magnetic compass convinced him that
there had to be "something behind things, something deeply hidden."
This is the same way, there is something deeply hidden behind things.
The world doesn't work as most people expected it to work, but they are
finally getting clued in.
Jun
19
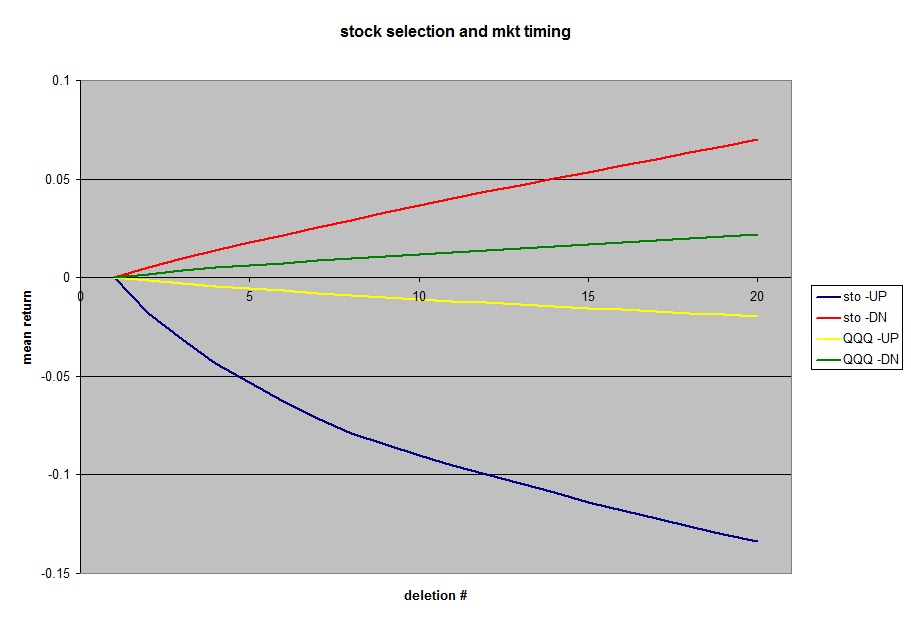
Stock Selection vs. Market Index Timing, from Kim Zussman
June 19, 2011 | 1 Comment
How can we compare the relative importance of stock selection and market timing?
The removal from a portfolio of the best or worst performing stock(s) gives some idea of the importance of stock selection. The removal from a stock market index time series of excellent or dismal time periods gives an illustration of market timing.
The chart below plots mean return for successive deletion of extreme winners and losers, both for skipping extreme winner and loser stocks in the stock portfolio as well as extreme gain and loss months in QQQ monthly time-series. Both series were scaled to start at zero origin, and the much larger dispersion of returns in stocks over the index is seen.
Green and yellow are the effects on mean QQQ return for skipping extreme winning and losing months. The effect is quite symmetrical in penalizing missing top gaining months and rewarding skipping bottom loser months.
Red and blue are the effects on mean stock portfolio returns for skipping extreme winning and losing stocks. The effect is asymmetrical, penalizing missing top gaining stocks more than rewarding deletion of bottom losing months.
One interpretation is that skew is more significant for stock returns within a portfolio than index returns within a period, and there is more penalty missing big individual gaining stocks within a period than missing index gains within a period.
Jun
7
Goat’s Milk, Raw, from Kim Zussman
June 7, 2011 | 1 Comment
 This morning for the first time drank fresh, raw, warm goat's milk.
We live in an area of small ranches, where the caretaker for the neighbor across the street keeps a small herd of goats — including milkers. A visiting relative from Moscow was fascinated — as Russian belief is that goat's milk is "verry good for you".
We fed the goats recently. One is a large black one-horned goat that Inessa named "Old Woman", because she looks haggard, has a droopy udder, and when we feed she butts the others away and gets most of the carrots — once butting so hard she sent a juvenile tumbling head over tail.
Old Woman is big and tough but not brilliant. When you try to feed other goats she quickly knocks them away: goats have horizontal pupils to increase their lateral depth of field, so they can watch for predators as well as competitors for food. Eventually I out-smarted her, and learned to hold onto a carrot through the fence and make her chew it– distracting her while Inessa fed the more demure ladies.
This morning on my run I asked the care-taker, Victor, if we could have some goat milk. He milks daily — drinking some himself and sharing with his constant companion mutt Zapato. He happily obliged and we finally got something back from Old Woman. He knelt next to her and pinned her hind leg in the crook of his bent knee. He slapped her udder several times to bring down the milk– mimicking what the kids do before nursing. In about 7 minutes he milked about 1.5 quarts into my plastic container, and I jogged the warm foamy jug up to the house.
They recommend goat's milk be pasteurized but Inessa insisted it be drunk raw. So we filtered it through gauze and gave it a try. Mild milk - very good, actually. A little sweeter and richer than non-fat cow's milk I'm used to.
Driving to work I noticed the udder drivers along side me. How funny they were with their shiny embellished vehicles and coiffed hair, determined and headed toward important appointments of a higher nature– while I rode contentedly digesting the friendly secretions of another animal.
Jun
2
A Taxonomy of Bubbles, from Kim Zussman
June 2, 2011 | 1 Comment
Two recent ostensible bubbles were the Nasdaq and US house prices. Prof. Shiller's nominal house price data was scaled to match the high of Nasdaq stock market, and shifted in time so the two peaks concurred (HPIQ2 2006 = NASQ1 2000).
Consistent with liquidity differences the Nasdaq bubble formed and burst much faster than housing. And neglecting effects of mortgage leverage, the housing bubble gain/loss was much less than Nasdaq.
Though the Nasdaq bubble was much more dramatic, ostensibly housing effects many more people. This, along with the fact that stocks are less in demand than places to live and market distortions due to foreclosures, suggests different bubble dynamics. Nasdaq began rallying about 2 years after its peak wheras housing continues to decline now some 5 years post-high.

Art Cooper writes:
Isn't "the effect of mortgage leverage" an enormous thing to neglect? Obviously, leverage is employed far more in housing than in the purchase of NASDAQ stocks.
Kim Zussman adds:
One could make the case that homeowners key less on loan-to-value (or value of equity) in a home than what the house next door just sold for.
May
27
Round Number Crosses, from Kim Zussman
May 27, 2011 | 2 Comments
The attached chart plots crosses of major SP500 levels of 1000,1100,1200,1300 from 6/97-present. Each colored vertical band represents a daily cross from below or above for each level.
Colors for each cross:
1000=turquoise
1100=yellow
1200=magenta
1300=blue
The middle section 2002-06 shows lengthening oscillations with 1000,1100, and 1200, but shorter shaking with 1300. From 10/09-8/10 1100 yellow was popular again - as it was in 03-04, 01-02, and 1998.

May
25
A Hairy Rule of Thumb, from Victor Niederhoffer
May 25, 2011 | Leave a Comment

 There is a hairy rule of thumb that sleeping in the buff is healthier for you than not. It relates I believe to the actual tested idea that sleeping with open windows is much healthier and gives much less respiratory disease than sleeping with closed windows as Asian women are all too prone to do, especially those living in air conditioned countries like Singapore. And it should be tested whether their respiratory diseases are much more common than they should be to their decreased longevity. We should ask Keeley what his tests on this show, or Louis L' Amour's study of wildlife.
As for its relation to markets, one comes back to the idea of playing canasta against 5 men named Doc. Impossible to win when markets are inactive as flexions must take their overhead out. Thus one must deal with the Asians, and the hotter the country, the greater the dishonesty I believe.
Jeff Watson writes:
Florida's a pretty hot place and I refuse to do business with any brokers or money people in this state because of the general lack of honesty. Something about the sun, surf, and sand that attracts people of questionable character.
Kim Zussman writes:
Corruption looks to be (inversely) related to latitude, with the obvious glaring exception of The Motherland.
Gary Rogan writes:
Speaking of hot dishonest Asian countries, I coincidentally just came across this story about the black market in Indonesia in RIM playbooks and other things.
John Floyd writes:
There is a somewhat new science that recommends "compression clothing" and I have been experimenting with it for both sleeping and exercise. I have found some merit to use.
In terms of fresh air as I recall the studies I have read indicate the high levels of air pollutants that accumulate inside a building, within in air ducts, etc. I always sleep with windows open regardless of the temperature outside and also use a hospital grade air purifier.
In Japanese there is a saying "Renma" meaning always polishing and improving. I think we can look at air circulation and blood circulation in the same way. Same is true for trading and the more we foment new ideas and ways to improve hopefully the better we become and avoid staleness.
Having lived in the Caribbean for several years and experienced months of absence from the heat while in New England winters I can tell you the adjust to the heat without air conditioning does take at least a day. But I found within a day I was fully adjusted. I think it becomes more difficult if you switch back and forth from A/C to non A/C in a hot climate. Again the trading link here may be one of consistency and allowing for adjustment processes that may be bring one out of their comfort zone.
In terms of the various prevalence of crime, corruption, work ethic, etc. across regions that I think is for one to do some research and analysis that would include Charles Murray's findings, geopolitical history, and personal experiences to reach their own conclusions.
Of course one would need to draw upon a sufficient sample size to determine for example whether those in Korea, Japan, Hong Kong or the Caribbean, etc. have a certain characteristics.
May
18
Query of the Day, from Kim Zussman
May 18, 2011 | 1 Comment
Does the incessant parade of illegal/insider trading, government manipulations, etc, of smart Ivy grads evidence the difficulty of getting rich in markets, or simply that dishonesty and greed is pervasive at all intelligence levels?
Gary Rogan writes:
It's probably evidence of both, but also of the illusion that highly successful people often seem to have of being invulnerable to normal negative forces, such as being punished for attacking hotel maids or being revealed for having a secret "love child" while running for the Governorship of California, or having an easily identifiable affair while running for the presidency.
Bill Rafter writes:
Don't the B Schools all have required ethics classes? Come to think of it, doesn't the industry regulators also require ethics classics?
Rocky Humbert writes:
The United States has an incarceration rate of 743/100,000 population.
The New York City's financial industry employees 344,700 employees.
If the pro-rata incarceration rate for Wall Streeters were at the national average, there would be 2,561 Wall Streeters in the Big House right now. Or, with 35,400 employees, 263 of these people would be Goldman Sachs employees.
Since neither of these facts are true, the inescapable conclusion is that Wall Streeters are either more lawful than the national average (or they have better defense lawyers).
QED
May
17
An Interesting Article, from Victor Niederhoffer
May 17, 2011 | 2 Comments
Here is an interesting article on the age of chief executives versus chances of acquisition. It shows that older CEO's are more likely to accept deals and also lower premiums. It's part and parcel of my investigation of how romantic urges of older CEO's often lead to hurtful results for stockholders from the Midwest to the coaches.
Rocky Humbert writes:
Interesting paper. But if I understand their methodology, they note that the chances of a bid is about 5.5% for geezers over 65, and under 4% for the younger CEO's. But their study seemingly only looked at the CEO's of companies that received takeover bids. They didn't look at companies which did NOT receive takeover bids. Hence, the subset that they analyzed has an obvious bias…. and it's possible that the stock of a company w/ an old geezer CEO of a company (which doesn't get a bid) has generated better long term performance than the stock of a company with a younger CEO. Surely there must be a paper out there which regresses CEO age versus stock price performance (over time). Doctor Z — have you seen such a study?
Victor Niederhoffer writes:
How could they come up with the chances of a bid without the total sample? Even an academic other than Sornette or the derivatives expert wouldn't make that mistake.
Rocky Humbert replies:
I didn't read the paper cover to cover, but section 3.1.2. and 3.1.2 defines their sample. Their study ONLY used the SDC US Merger and Acquisition Database….and CEO's who fell into that database.
The results are still interesting– but they would be much more interesting if they had looked at the bigger question.
Kim Zussman adds:
Here are some somewhat relevant papers from SSRN:
This paper examines the influence of CEO career horizon on the future performance of firms. Specifically, we argue that CEOs with shorter career horizons (as measured by their age) will adopt risk-averse strategies that will, on average, adversely influence future firm performance. Further, we argue that at relatively high levels of CEO ownership control, this relationship is exacerbated. Using a sample of US-based firms from the S&P 500, we find that future financial and market performance are significantly lower for firms with older CEOs but only when those CEOs have strong ownership positions. We conclude by discussing the implications of CEO career horizons in the content of various levels of CEO ownership power.
The announcement of a forced CEO resignation is hailed favourably by the market with a small but significantly positive abnormal return of 0.5%. The market may have anticipated the forced turnover since the abnormal return over a one-month period prior to the turnover amounts to 6%. Whereas voluntary resignations do not cause a price reactions, age-related turnover triggers a small negative price reaction.
While individually age and tenure are only weakly correlated with the stock price reaction to a sudden death, the reaction is strongly positive (5 to 7%) if (1) the executive's tenure exceeds ten years and (2) abnormal stock returns over the last three years are negative. In a number of cases, part of the reason for the positive stock reaction to sudden executive deaths is apparently because in the stockholders' view, an obstacle to a takeover has been removed.
In this paper we examine the cross-sectional determinants of idiosyncratic volatility of biotech IPO firms. We extend current research in two directions. First, we test whether CEO stock options impact on idiosyncratic volatility. Second, we test new hypotheses that relate some easily identifiable managerial characteristics to idiosyncratic volatility. We find that the CEO stock options, resource dependence capabilities, and the age of board members help predict idiosyncratic volatility
A dailyspec classic:
This paper shows that the time of year of a person's birth is an important factor in the likelihood they become a CEO, and conditional on becoming a CEO, on the performance of the firms they manage. Based on a sample of 321 CEOs of S&P 500 companies from 1992 to 2006 we find that (1) the number of CEOs born in the summer is disproportionately small, and (2) firms with CEOs born in the summer have higher market valuation than firms headed by non-summer-born CEOs. Furthermore, an investment strategy that bought firms with CEOs born in the summer and sold firms with CEOs born in other seasons would have earned an abnormal return of 8.32 percent per year during the sample period. Our evidence is consistent with the so-called "relative-age effect" due to school admissions grouping together children with age differences up to one year, with summer-born children being younger than their non-summer-born classmates. The relative-age effect has been demonstrated in numerous sporting and other contexts to last to adulthood and to favor older children within a school grade. Those younger children who nevertheless succeed by overcoming their disadvantage have to be particularly capable within their cohort. Together, the advantage enjoyed by older children and the particularly high capability of successful young children explain the statistically and economically significant findings.
And just a few more:
Regardless of retention , shareholders of acquired firms whose CEO is at retirement age receive lower premiums than shareholders of acquired firms with younger CEOs. This lower premium seems to be explained by the apparent reduced acquisition value of firms led by retirement age CEOs rather than by the target CEO conflict of interest.
Using U.S. plant-level data for firms across a broad spectrum of industries, we compare how career concerns affect the real investment decisions of younger and older CEOs. In contrast to prior research which has examined some specialized labor markets, we find that younger CEOs undertake more active, bolder investment activities, consistent with an attempt on their part to signal confidence and superior abilities. They are more likely to enter new lines of business, as well as exit other existing businesses. They prefer growth through acquisitions, while older CEOs prefer to build new plants. This busier investment style of the younger CEOs appears to be relatively successful since younger CEOs are associated with higher plant-level efficiency compared to older CEOs.
May
17
Proposition bet 2012, from Kim Zussman
May 17, 2011 | Leave a Comment
 I read this interesting thought today:
"You hear a rustle in the grass. Is it the wind or a dangerous predator?
If you guess that it's a dangerous predator but it's just the wind, you've made a mistake—believing that something is real when it's not (a "false positive," as cognitive scientists call it)—but a rather harmless one. On the other hand, if you guess that the rustle in the grass is the wind but it turns out to be a hungry lion, your mistake is more serious: The lion was real but you thought it wasn't (a "false negative"). In this case, you're lunch, and you won't get the chance to be more cautious next time."
If today a similarly evolved lady expressed a great deal of anxiety over the possibility the world would end in 2012, bet her $1000 ($1T, etc) it wouldn't, because:
1. If you are right she pays
2. If you are wrong, you don't have to.
May
14
Pre and Post 911 VIX, from Kim Zussman
May 14, 2011 | 1 Comment
Here is a study comparing VIX levels of 8 trading days prior to (and sometimes including) September 11's to 8 trading days following September 11's, 2002-2010. First comparing the mean pre-911's to post 911's for all study years:
Two-sample T for pre 911 vs post 911
N Mean StDev SE Mean
pre 911 72 21.45 7.39 0.87 T=-0.2
post 911 72 21.70 8.64 1.0
No difference in mean VIX between 8 days prior to and following 911 dates. Here is the same comparison by year, with the T-score for difference between pre911 and post911:
YR VIX T
2010 2.7
2009 3.1
2008 -6.9
2007 1.9
2006 4.1
2005 1.5
2004 0.8
2003 1.1
2002 -1.7
The omniscient market (and even more omniscient options market) was not concerned about repeat terror attacks in the 4 years following 9/11/01. In 2008 financial markets were probably more worried about self-inflicted damage. However pre-911 was significantly higher than post-911 in 2006 - the 5th anniversary of the attack; which fits with public information that other attacks were considered on notable anniversary dates. Evidently Osama also hoped for commemoration on 9/11/11, and it remains to be seen whether there will be a run on insurance under his new tenure as fish food.
May
8
A Question for Counters, from Dan Grossman
May 8, 2011 | Leave a Comment
Speaking of commodity spillover, I'd be interested to know the historical effect on near-term stock prices when commodities hit a "high" and then decline.
Many thanks,
Dan
Russ Sears writes:
One data point that may be applicable is Silver Thursday
Mar 27 1980 S&P closed 98.2
next day 100.68
5 trading days 102.25
21 days (April 28) 105.64
June 27 116.00
Looks pretty bullish.
Tim Hesslesweet adds:
Kim Zussman writes:
Using Tim's linked data for Cushing WTI spot crude weekly prices, constructed the attached comparison plot of log (spot crude) and log (sp500). Log (spx) was scaled -1 log unit (divided by 10) in order to readily compare the two.
The chart shows a similar gain for crude and SPX over the interval, 1/87-5/11. Crude remained relatively flat through the 90's while stocks gained. Oil bottomed in 1998, and from this bottom to the peak in 5/08 gained about 10X.
IQ1 marks the 1st Iraq war, with an expected spike in crude price and drop in stocks. Both stocks and oil were near many-year highs in 9/00, and both declined together until a few months after 9/11, when stocks continued to drop but crude rose. At the outset of IQ2, oil spiked and stocks sagged - like the prior Iraq war. From this point SPX rose consistently, and after a few months oil followed.
Stocks hit a many year high in 9/07 before turning down, and crude did the same 8 months later in 5/08. Subsequently oil bottomed faster - in 12/08 - and stocks in 3/09.
For crude and SPX there does not seem to be a clear relation between peaks and valleys, though there was a contemporaneous inverse relationship with two wars in the middle East.

May
6
Daddy’s on the Floor, from Kim Zussman
May 6, 2011 | Leave a Comment
 One of my favorite employees has a funny husband. Raised in the Midwest, his folksy sayings are often quoted by her during surgery. "Daddy's on the floor!" he shouts, in the morning once he's arisen from a night's slumber; out of bed, ready for a day's enlightenment (in retirement). The man of the house has arisen….and to every one and the only listener, he requires the family's attention.
This phrase again came to mind with yesterday's image of an Osama lieutenant; lying executed next to a child's fluorescent green toy water pistol. Some children have mass murderers for fathers, and I wondered if as a result this child is less a child and father is less a father.
We read they lived in full purdah– wives are required to not slumber with their husbands. And that the master killer wore a traditional salwar kameez when posing for the described portraits. Cultural traditions that seem different from ours, but in framework the same. The daughter who witnessed her father's disassembly was named for a spy who "killed a Jewish spy at the time of the prophet"; though it was as not so much this kind of spy that laid him down as it was cowboys of different cultures.
Dan Grossman writes:
I admire Kim's lending a little sanity to the Administration's celebration of the event.
I myself have no problem with sending Navy Seals to execute someone we are at war with, who planned the terror attack that took the lives of 3,000 Americans and that has cost us all years and hundreds of billions of dollars of delay, pat-down, and other sniveling procedures as we continue to allow the government (in what is more a "theatre of security" than anything effective) to permanently disrupt the lives of 310,000,000 of us. What I do feel uncomfortable about is:
1. Having the raid televised back to the White House situation room so that Obama (who was so crucial to the planning that he was actually on the golf course and had to rush back), Panetta, Hillary et al. could watch every step. This had to make the raid less efficient and more dangerous to the Seals, and why was it at all necessary other than to give the situation room viewers the false thrill of video-game-like participation?
2. The Administration's putting out the story (presumably to somehow justify the execution) that the unarmed OBL acted in a "cowardly fashion" when the Seals burst into the bedroom where he was with his family. Let us imagine how Obama himself, Panetta, Hillary or any of us might act if we are in our bedroom with our family and armed executioners burst in about to shoot us in the head.
And if Obama had to fly to Ground Zero and then fly to the Navy Seal base to keep the favorable publicity going (but of course not "to spike the ball"), it would have been classy to have invited George W. Bush to appear at Ground Zero with him. For all his faults, Bush did have a calming effect on the country and show personally bravery by, among other things, throwing out the first pitch at Yankee Stadium at a time when there was great fear of another attack and credible rumors of a nuclear weapon in NYC.
May
6
The Value of Doing Nothing, from George Parkanyi
May 6, 2011 | 2 Comments
 A while back, someone asked about the value of doing nothing. I had two positions on going into this morning - short S&P, and short natural gas. Had I not turned on a computer today, I would have made enough money to forgive many a sin of the first quarter. As it is, I ended the day breaking even when I had started out being significantly short two markets that gapped in my favour and then later basically went over a cliff. I won't go into the gory details of what and why I traded - nor share my feelings - but I'm pretty convinced that I'm going to have to hire a guy with a gun who, after I've set up the trade and the risk management, under contractual obligation is required to say to me "Sir, step away from the keyboard, or I'm going to have to shoot you in the head."
I would say there is value in doing nothing.
Speaking of doing nothing, the hockey game is on and the couch beckons.
Alston Mabry comments:
One sympathizes. It brings to mind this proverb.
Kim Zussman writes:
Randomly speaking, the market might have just as easily shot up and you could have avoided regret.
Gordon Haave writes:
Whenever I am in a business meeting and someone has come to it with some pressing need we have to react to right away, I always ask "what if we do nothing?". Everyone is always stunned.. they haven't even considered not doing anything. After asking that usually the consensus become to, in fact, do nothing.
Alston Mabry writes:
I would say that the over-arching issue is that the Market Mistress can torment her lovers in many, many ways. And experience would lead one to believe that tormenting her lovers is, in fact, her main obsession.
George Parkanyi replies:
Oh sure, Kim, you're right about that. But I had my risk management in place. Stops. But the point is, I had my idea right, and the method of executing basically set up to exploit the anticipated scenario. That would have played out very well, since there was nothing more that I needed to do at that point. Then I started changing stuff …
I don't mind being wrong, because that always happens in the markets, and you plan for it. What really gets me angry at myself is when I'm right and then I get in my own way. What other people do, I can't control, but what I do I SHOULD be able to control. Not being able to maintain self-discipline is a character flaw that has to be actively managed, and today it got the best of me. Doesn't always, but today it did. (Tomorrow may not be so good either, because before the close I went long a little silver.)
Jim Sogi writes:
Well, the next best thing to doing nothing is doing just a little to see what happens. If you're wrong, not such a big deal, but a small sample gives a good sign. Like Commodore when the guy gives him a hot tip in Reminiscences of a Speculator. See how it gets swallowed up.
Jeff Watson writes:
Jim mentioned probably the best thing I ever learned in my speculation game which is still going since 1973. "See how it gets swallowed up." Second best lesson I ever learned, but it only works with big orders and can tell so much about the markets, where they are, where they're going, who want's what, etc. Many things can be said with words, but until the order is put to the market, one can't say anything. The order getting digested is where the rubber hits the road and contains so much information(even in these electronic days), almost 10,000 pages per order if one is willing to keep an open mind and analyze it. The Commodore's system still works well in the grains, more than any other market I've seen and has been responsible for much of my limited success.
Vince Fulco writes:
The multi-day swing boys and the deep pockets are the big winners in GC1 so far tonight. Late afternoon, the contract came in like a ton of bricks as ES tumbled, with modest movement in equities after hours, zoom goes Gold as if the latter part of the day didn't even matter. The solid long moves all seem to be held "in reserve" till the day traders are flat.
Jim Sogi responds:
I know its so minuscule, but the market knows when I put in my and my order makes it harder for Globex to move to the price and for a fill. I try to stealth even my limit orders keeping them mental until the price is where I want, ambush like. It puts me near the end of the queue, but at least its the right queue at the right price tick. Less chance of the hunter becoming the hunted, less exposure.
May
1
Here are the mean monthly returns for gold ETF "GLD", 2002-present, by two groups: months Nov-Apr, and months May-Oct (vs zero):
One-Sample T: nov-apr, may-oct
Test of mu = 0 vs not = 0
Variable N Mean StDev SE Mean 95% CI T P
nov-apr 41 0.02504 0.05267 0.0082 ( 0.0084, 0.0416) 3.05 0.004
may-oct 36 0.00851 0.05303 0.0088 (-0.0094, 0.0264) 0.96 0.342
> Both positive, but only the mean for months nov-apr is significantly different from zero (and 3x greater than may-oct)
Apr
26
 There has been discussion both recently and historically concerning the relationship of stocks and bonds. Indeed the Daily Speculations website this year started color coding the days on the calendar based on the different movements of those two basic assets.
Much of the discussion concerning this subject has been oriented around "counting". While I value that approach I must point out that the yardsticks by which stocks and bonds are measured in such analysis are of different lengths. Specifically, those markets do not open and close at identical times, which means the daily recording of their respective changes may not actually reflect their movements when they were contemporaneously open. If the daily recordings are not exactly representative, then counting those recordings in the hopes that the errors will "all come out in the wash" may not be the best approach.
Changes (as opposed to levels) are the appropriate data to study. But because of the different time periods, a period other than daily would be more representative of their respective actions.
Instead of counting the daily changes, I have been following the moving correlation of those markets. Whereas most investment professionals are of the belief that stocks and bonds are essentially opposites, we have found otherwise. For example, if you were designing a most bullish environment/setting, I believe that would be when both stocks and bonds were rising. That is, you had a positively trending stock market and declining interest rates. That can be easily modeled by a moving correlation of the two and a positive slope of their prices. Here's a chart (weekly data) of exactly that:
If it doesn't show up well, here is a link.
As you can see, periods of positive moving correlation and positive slope tend to be good times to be long equities. More importantly however is that price collapses are easily seen as periods when that best condition does not exist. The worst condition is when stocks and bonds are both declining. But the other two "not best" conditions reflect the standard (macroeconomic) business cycle and have interesting trading implications all their own. All of this can be non-subjective and can be tested. We have found it to be statistically significant. Furthermore, I show it here on a weekly chart for convenience, but the data is daily and should be watched daily.
I would posit that Daily Specs could find this an interesting area of study. For years my shop had used this as an important part of avoiding trouble, basically to tell us when to play in equities and when not. We only abandoned it when we found something better.
Some further comments/tips:
For bonds I used the DJCBTI because it is price-based and not expiring every six months. It is also third-party. I could make my own bond index, but then open myself to the charge of jury-rigging the results. N-values are hugely important. But adapt, don't optimize N-values. Also you will have to consider what level of moving correlation is significant (i.e. a positive value of .01 is somewhat of a yawner).
Bill Rafter, MathInvest
Kim Zussman writes:
Using TLT for bonds and SPY for stocks (2002-present, including divs), checked weekly return for stocks after prior weeks which were either (bonds, stocks) up up, up dn, dn up, dn dn, vs zero:
Variable N Mean StDev SE Mean 95% CI T
BUSU 113 0.00165 0.0164 0.0015 (-0.0014, 0.0047) 1.07
BUSD 139 0.00156 0.0363 0.0030 (-0.0045, 0.0076) 0.51
BDSU 139 -0.00022 0.0213 0.0018 (-0.0038, 0.0033) -0.13
BDSD 60 0.00519 0.0242 0.0031 (-0.0010, 0.0114) 1.66
Apr
14
Comparison Study, from Kim Zussman
April 14, 2011 | Leave a Comment
Here is comparison of first 10 trading day return of each month (SPY 2000-2011) with first 10 days of just months of April:
Two-sample T for FOM10 AP vs FOM10
N Mean StDev SE Mean
FOM10 AP 11 0.0050 0.045 0.014 T=0.3
FOM10 124 0.0007 0.036 0.003
>>April "pre tax" period is higher than non-April months, but N.S.
Here is same comparison of last 10 days of each month with last 10 days of Aprils:
Two-sample T for EOM10 AP vs EOM10
N Mean StDev SE Mean
EOM10 AP 11 0.0088 0.030 0.009 T=1.3
EOM10 124 -0.0041 0.028 0.002
>Last 10D for Aprils ("post-tax") are also higher than non-Aprils
Apr
10
107 Days, from Kim Zussman
April 10, 2011 | Leave a Comment
It has been 107 trading days since QE2 was [officially] announced (Nov 4 2010). What has changed in the SP500?
SPY daily (cls-cls) returns were compared to zero for the 107 days since - and just before - the QE2 announcement:
One-Sample T: pre, post
Test of mu = 0 vs not = 0
Variable N Mean StDev SE Mean 95% CI T P
pre 107 0.0014 0.0109 0.0010 (-0.0006, 0.0035) 1.34 0.185
post 107 0.0008 0.0076 0.0007 (-0.0005, 0.0023) 1.21 0.230
The pre-QE2 daily returns were actually slightly higher than since QE2: 0.14% vs 0.08%, with both not significantly different than zero. Despite civil war in the Middle East and the Japan earthquake, however, volatility post QE2 has been significantly tamed*:
Test for Equal Variances: pre, post
95% Bonferroni confidence intervals for standard deviations.
N Lower StDev Upper
pre 107 0.0095 0.01097 0.01294
post 107 0.0066 0.00768 0.00907
F-Test (normal distribution)
Test statistic = 2.04, p-value = 0.000
Levene's Test (any continuous distribution)
Test statistic = 6.32, p-value = 0.013
*at what cost?
Alston Mabry comments:
My comment immediately seems too terse, especially given that Dr Z endeavors perhaps more than anyone to add actual quantitative analysis to Spec List. The difference between announcement and implementation in this period modifies the old saw to, "Buy the rumor, then keep buying the news, but not so vigorously."
Bill Rafter writes:
My method for identifying character changes in a market is to take an indicator that you think reflects such character and then keep smoothing it and observe what happens. It does not matter that the indicator is leading, coincident or lagging, since for this exercise you are not in the forecasting business. At some point you will see certain parts of your manipulated data become very smooth while other parts retain some craziness. The chart below (previously posted) is an example. In this case the data is smooth before September 2010, but definitely more erratic from September 2010 onward.This data is a smoothed version of the difference in open interest between equity calls and puts. One might come to the opinion that despite the fact that the Fed does not dabble in equity options, they are nonetheless influenced by the Fed's presence in the marketplace.

Apr
4
US employment/population, from Kim Zussman
April 4, 2011 | Leave a Comment
BLS data was used for the attached chart, which plots % of population employed 1948-present (Employment population ratio, %, age 16 or older).
From the late 1940's to the late 1970's, % of population employed varied in a tight range between 55% and 58%. Starting in the late 1970's, % employed moved to a higher regime, staying above 60% from 1987 until 2009. The recent decline which began in 2007 dropped % employed to about 58% - a level not seen since 1983.
Major declines corresponded with recessions, as marked: 1980-83, 1990-92, 2000-03, and 2007-present.
The regime change to higher % employment could have occurred for many reasons, including more women entering the workforce, deferred retirement, and less business cycle volatility. Is the recent drop a move back to the lower regime, or simply a temporary recession-decline in the higher regime?

Fred Crossman comments:
You wrote:
From the late 1940s to the late 1970s, % of population employed varied in a tight range between 55% and 58%. Starting in the late 1970s, % employed moved to a higher regime, staying above 60% from 1987 until 2009. The recent decline which began in 2007 dropped % employed to about 58%– a level not seen since 1983. Major declines corresponded with recessions, as marked: 1980 83, 1990-92, 2000-03, and 2007-present. The regime change to higher % employment could have occurred for many reasons, including more women entering the workforce, deferred retirement, and less business cycle volatility. Is the recent drop a move back to the lower regime, or simply a temporary recession-decline in the higher regime?

Kim, my humble reason for higher employment trend is more consumption and more debt incurred by American since late 70s, early 80s. Americans needed the money for a larger home, second home, second car, etc, basically greater spending and consumption– to pay off more more debt. (top chart). top chart also parallels greater debt incurred by American.
Lower chart of declining GDP (parallels a declining savings rate and wages that have not kept up with inflation). Average American less wealthy (very top class now is wealthier with government help, however, that is another topic). Also, going off gold standard encouraged more central bank money printing to inflate away federal debt. Also now takes more debt for every dollar in GDP gain.
Apr
4
Largest VIX Decline in History, from Kim Zussman
April 4, 2011 | Leave a Comment
1. VIX went up for a couple of days, then proceeded to go lower still
2. TVIX is an odd beast. It is new - just started trading Dec 2010. Here is a regression of (daily change in) TVIX vs VIX from inception:
Regression Analysis: TVIX versus VIX
The regression equation is TVIX = - 0.0102 + 0.860 VIX
Predictor Coef SE Coef T P
Constant -0.0102 0.00297 -3.45 0.001
VIX 0.8597 0.04250 20.23 0.000
S = 0.0274052 R-Sq = 83.1% R-Sq(adj) = 82.9%
Of note: The daily change is NOT 2X VIX- more like 0.86. Even more interesting the intercept coefficient is negative and highly significant. ie, on (extrapolated) days when VIX change is zero, TVIX change is -1%. This ongoing loss is also seen in comparative chart (attached), and would appear to be another (now common) ETN contango/roll tracking problem.
The advice that TVIX is short term is no joke.
Mar
29
Greenspan and Government Activism, from Paolo Pezzutti
March 29, 2011 | Leave a Comment
 We have discussed the role of government in the economy and during crisis many times on this site. Greenspan writes about this topic with the paper "Activism" that I recently read. He writes:
The current government activism is hampering what should be a broadbased robust economic recovery, driven in significant part by the positive wealth effect of a buoyant U.S. and global stock market.
Equity values, in my experience, have been an underappreciated force driving market economies. Only in recent years has their impact been recognized in terms of 'wealth effects'. This is one form of stimulus that does not require increased debt to fund it. I suspect that equity prices, whether they go up or down from here, will be a major component, along with the degree of activist government, in shaping the U.S. and world economy in the years immediately ahead."
Considerations about the wealth effect are in my view interesting, but well known to those who tried (and managed) to steer a recovery from the crisis.
The wealth effect has supported the economy so far. How much compared to the "stimulus" is hard to say however. "Manipulation" of markets in order to favor a continued move to the upside concerted by strong hands was (and is) in the interest of many forces who have a prominent role.
Victor Niederhoffer writes:
The wealth effect was very big in the 1960s and before, and Latane had good papers on it. Everyone at the Fed has believed in it for 70 years, to the exclusion of looking at interest rates themselves. And Bernanke often times his qualitative announcements with market lows or highs. A good way to trade.
Phil McDonnell writes:
Most of the so called wealth effect is really artificially induced by the QE programs. If the price of your stock rises but the value of the dollars the stock will fetch falls then are you really wealthier? How rich do the folks in Zimbabwe feel?
Jeff Watson writes:
One only has to look at the Weimar to see how the business class in Rhodesia feel. In 1913, the German stock market was at 126. Fourteen years later, the German stock market was at 26,890,000. At the index peak, the value of the Daimler company was only worth 327 of its cars. Interest rates were 900% and the exchange rate went from 4-5 marks per dollar in 1913 to 4+trillion marks per dollar in 1923.
Ian Brakspear writes in:
My portfolio in 1994 was worth aprox ZIM$10 million in 2005 worth ZIM $ 44 billion.
Victor Niederhoffer comments:
What they did to the farmers makes one cry. Brakspear is the guy that posted the funniest spec post ever. He ordered 2 beers for lunch. It was 10 million Zimbabwe. Then by the time he finished lunch, he ordered two more. The price had risen to 15 million Zimbabwe.
Kim Zussman asks:
So does inflation illusion work? What does it feel like to be a billionaire?
Ian Brakspear comments:
I have in my wallet 2 fifty billion dollar notes, a one hundred billion dollar note and one ten trillion dollar note-worthless.
Today the main currency in the streets of Zimbabwe is the US$– how all these US$ notes got here is anyone guess.
They are cleaned regularly in washing machines to prevent the spread of diseases– and hung out to dry on washing lines– always with someone on guard.
Mar
29
Primism, from Kim Zussman
March 29, 2011 | 1 Comment
Nine fatal flaws of hominid finance:
9. Laziness
8. Vanity
7. Hubris
6. Poorly equipped
5/4. Free-riding / dependency
3. Vendetta
2. Distraction
1. Fearlessness
Mar
29
Using Improv for Business, shared by Kim Zussman
March 29, 2011 | Leave a Comment
Here is an interesting article on using improv for business:
"Improvisational comedy offers valuable lessons to business, says Lakshmi Balachandra MBA ’04. An improv comic before working in venture capital and finance, Balachandra brought her spontaneous theater skills into the classroom …"
"Improv teaches you how to think on your feet, she says, to accept the facts, and then build on them. All these are excellent business and negotiation skills. In a CNN article, she offers her five rules of improv:
1. 'Yes, and.' Accept a situation and then deal with it.
2. Avoid asking questions. Continually asking questions makes other
people do all the work.
3. Listening. Focused listening is a crucial skill.
4. Add information. Contribute if you want to guide the conversation.
5. Eye contact. In the workplace it’s important to pay attention to
body language."
Russ Sears writes:
While not improv, here is a humorous Toastmaster speech I gave last year. It won at the club level.
This might have some lessons on risks and reward; parenting and other humorous topics when we think we have it all mastered.
And for those that have not meet me; you get to see my pretty face.
Mar
28
 "It is common to think of individuals to use genes to make more individual, but from the gene's eye view of evolution, its the other way around. Genes use individuals to make more genes. The chicken is the egg's way of making more eggs". p. 114 The Seventy Great Mysteries of the Natural World edited by Michael Benton.
Yes, and its the digits of the prices way of replicating itself to make individual market players create more of those digits. (I wrote about this before here).
The digit 0 plays a big part in the replication game, and it makes individuals sacrifice themselves to create more 0's.
One notes for example that the double digit 00 in 1300 on the sp has been broaches from below on a closing basis from Feb 03 on three times and gone from above to below on three times.
Similarly for the triple digit 000 in 12000 on the DJI. The DAX crossed the triple digit 7000 on Jan 3rd from below, went above below then above then below on Jan 07, then crossed to 7097 on Jan 13 but stayed above 7000 until March 14, then fell to 6436 on March 16, a decline of 10% for the year, and now for the first time on March 25 hit a high of 7006 but failed to close above 6981, a fact which must cause great disennu to the triple 0's in 7000 and they must be inducing much political change in Germany as we speak to achieve that level.
Similar analysis relates to the Nikkei at 10000 which crossed below 10000 on March 11 briefly, but closed at 100075 and then on the following two days declined 20% captures by the triple 000 at 8000 as its low was 7790, a decline of 25% from its mid December levels of 10300.
A similar analysis could be made with the grains especially corn which has shown a similar affinity to 700 as the Dow to 12000 and the SP to 1300.
Instead of taking closing prices for granted we should ask how the digits themselves influence our actions so that we can make them reappear over and over again.
Kim Zussman writes:
A simpler version of this is the opposite of the usual "the market did Y today because of X": We say X because it did Y and we need why.
The evidence is that for many similar X there are many dissimilar Y.
Price is selfish because its impact demands explanation.
Gay Rogan comments:
I'm having trouble understanding any of this. Genes are selfish in the following sense: if genes don't propagate, they disappear, so the only genes that are here today are proven propagators. How can prices or digits permanently disappear? And why would 0's propagate more than other digits? How do these explanations provide more clarity than simply saying people's brains are attracted to numerical markers, and in the absence of other alternatives they chose round numbers?
Steve Ellison comments:
One possible line of reasoning is that people are more likely to put limit orders at round numbers. People often put stops near round numbers, too, but the research I have seen suggests stops are more likely to cluster on the opposite side of a round number from the current price. Here, then, is a hypothesis: if the last two digits of the S&P 500 closing price are above 90 or below 10 (i.e., near a 00 round), the change the next day is likely to be in the opposite direction as today; if the last two digits are above 10 and below 90 (i.e., away from the 00 round), the change the next day is likely to be in the same direction as today.
Checking the last 1584 trading days of the futures,
Near 00 round:
N: 366
reversal next day: 194
unchanged next day: 3
continuation next day: 169
% continuations excl unch: 46.6%
Away from 00 round:
N: 1200
reversal next day: 592
unchanged next day: 15
continuation next day: 593
% continuations excl unch: 50.0%
The percentage of reversals was higher near rounds, but the difference was not significant.
What was significant was the number of closes near the rounds. One would expect a close within 10 points of a round about 20% of the time, but 23% of actual closes were within 10 points of a round, p=0.0006.
Victor Niederhoffer writes:
Here is an interesting paper on round numbers for individual stocks. It doesn't look at expectations, but does look at bid
asked.
Russ Sears writes:
I believe that this paper could be expanded measure this effect on high volume versus low volume stocks. Therefore its stated cost may not be as large as expected on all stocks. My guess, needing testing is the small stocks have this more frequently than the large stocks, that are often computer traded.
Mar
27
Why a Climactic Move is the End, from Kim Zussman
March 27, 2011 | Leave a Comment
 A young boy enters a barber shop and the barber whispers to his customer, "This is the dumbest kid in the world. Watch while I prove it."
The barber puts a dollar bill in one hand and two quarters in the other, then calls the boy over and asks, "Which do you want, son?" The boy takes the quarters and leaves the dollar.
"What did I tell you?" said the barber. "That kid never learns!"
Later, the customer leaves, and sees the same young boy coming out of the ice cream store. He asks. "Hey, son! May I ask you a question? Why did you take the quarters instead of the dollar bill?" The boy licked his cone and replied, "Because the day I take the dollar, the game's over!"
Mar
25
Rebecca Black’s Friday and the Market, from Kim Zussman
March 25, 2011 | 2 Comments
 There appear to be deeper messages in this music "Friday" by Rebecca Black– ostensibly market related:
One notes that in 2011 Fridays have not been particularly strong, but Mondays gave Fridays reason to celebrate (attached compares mean of weekday returns of SPY, cls-cls).
Jan Petter-Janssen writes:
Talking about music… Korean pop is extremely inspired by American culture.
The kids over there apparently cherish individualism and internationalism. It's a very good sign for Korea's future, isn't it?
How do I know about all these? It's impossible not to hear these in Singaporean malls. Much better than Justin Bieber though.
PS: Make a YouTube search on "Indian pop". It's a totally different story.
PS2: Also Chinese pop features some English. And materialism to the extreme…
Mar
24
Briefly Speaking, from Victor Niederhoffer
March 24, 2011 | 2 Comments
 I used to love to play an opponent who couldn't win because he was trying to do something that would definitely lose. Like setting his feet leaning towards the left and hitting to right, or hitting me a drop shot when I was always fast enough to return it regardless of where it went. The Knicks are like that. They can't possibly win regardless of what they do, or how good the players are, because their system is bad. The 7 seconds shoot doesn't work. It's not percentage play.
Fortunately some others seem to realize it now and the coach says "with all the problems I have, I am not going to comment on others problems". Hopefully he realizes it's his problem not the players.
It reminds one of my friend Joe Yuhas, the Christmas tree guy, who tapped out on a silver trade, from the long side below $ 4 and I said, "you shouldn't have been so big" and he said "but I keep thinking what would have happened if I had been short. I could have made as much as I lost" and I said, "but Joe, it didn't matter whichever way you went, you would have lost either way".
Many systems that people use for markets are like that. And those who day trade and give an implicit vig of a few 100% a year, are in similar positions in the main. They play against people whose costs are 1/10 of theirs, capital 1000 times as great, (and they can borrow from a fairy godmother at 0 % also ), and who have much better equipment and speed. And if all those advantages fail, they can force one out at the close, only to move back to where the profit would have been realized at the next open. And yet, the game must continue.
There is hope if D'Antoni trades places with the fake doc as I asked the sullen Patrick Ewing to do who would consign the Knicks to eternal crossings of the river Styx if he were to get back. There is hope for day traders if they go stay overnight.
Jay Pasch writes:
Words of wisdom on the treachery of daytrade margin as the rope seller is glad to offer plenty of product with which to fashion one's own noose…
Kim Zussman comments:
Don't think it's all the broker's fault. Blame EMH. E.g, if all the rational, logical, comfortable, patternistic things are bid every tick, the only things left are irrational, illogical, uncomfortable, and non-patterned. The only people who thrive like that are successful traders and schizophrenics.
Mar
24
The day-to-day changes in SPY (SP500) and TLT (20+yr Treasury ETF) was checked every 20 days (non-overlapping) for correlation. The attached plots correlation every 20D over time, 2002-present.
There is considerable variation, and two apparent regimes:
~7/03-6/07 with correlation varying around zero 6/07-present, with correlation bobbing around -0.5.
Is a high stock/bond risk dichotomy healthier?

Mar
21
The Effects of Electromagnetic Soup, from Kim Zussman
March 21, 2011 | 4 Comments
The increase in the intensity of the electromagnetic soup (the South Park boys call it smug) in urban areas over the past 3 decades has been exponential. The limited research on the health effects in this area has been entirely on the question of whether cell phone use caused brain cancer because the receiver was held so close to the ear. What has not been researched at all is the effect of having transmitters sprinkled everywhere - on airplanes, in hotels, etc. so that the exposure is constant for people who live in urban areas. It is a question that genuinely needs statistical research, especially since Wi-Fi and Cell Phones operate at a much higher frequency than the transmissions that people have previously been exposed to - i.e. AM-FM radio and over the air TV broadcasting.
Mar
21
Ancient Poems, from Kim Zussman
March 21, 2011 | Leave a Comment
Heisenberg Japan
Asset all up
Zero interest
Where to go?
Hunt old bear!
He is 20
And die soon
Can aim Nikkei
Can aim Yen
Better hit both
Mar
20
1995 and 2011 Japan Earthquakes, from Kim Zussman
March 20, 2011 | 1 Comment
The attached plots log(nikkei225). The dark line is from a year before to a year after the 1/17/95 Kobe earthquake (arrow). The red line is log Nikkei from a year ago to +5 days after the 3/11/2011 earthquake (arrow).
The 1995 event - which occurred in a market that was flat to slightly declining - was followed by a modest decline over 4 days, then a small rally, followed by a decline which deepened over the next 6 months.
The recent quake occurred with Nikkei substantially lower than in '95, and followed a flattish period which was rising (with all other markets) over the past 6 months. So far the 2011 tragedy has taken the form of a deep 2-day drop followed by a 3-day bounce.
In terms of contextual backdrop, arguably there are more differences than similarities: Earthquake size/damage/future ramifications, recent global financial crisis, etc.

Craig Mee writes:
Thanks, Kim.
Of note the SP in 1995 was up 18.8% in the following 6 months to 17/8/95.
A spread trade short Nikkei, against one of the more stable Indexes at the moment, (potentially one least effected over the last weeks volatility), maybe a consideration as of 3/20/11.
The Russell 2000 index of smaller companies has lost 1 percent since the earthquake in Japan, a slide that is less than half of the pullbacks of large company indexes like the Dow or S&P 500. That's a surprise, considering that the smaller, riskier companies tend to fall the most during stock downturns. Last year, for instance, the Russell index lost 2 percentage points more than the S&P 500 during a market drop that lasted from April to June.
Mar
19
Lunacy & Earthquakes, from Phil McDonnell
March 19, 2011 | Leave a Comment
 Does the orbit of the Moon trigger earthquakes ? If so then March 16 through the 22nd could be interesting. The Moon makes its closest approach Mar 19 during the new Moon.
Here is something from Nolle's web site: his March forecast.
On a more interesting note my research showed that the stock market performs better from the new Moon to the full Moon than during the waning half of the cycle.
Jon Longtin comments:
I wouldn't lose sleep over it.
The stress that the moon produces on the earth by constantly darting from one side to the other every day is orders of magnitude greater than the small variation in its distance to earth.
Put another way, high tide maybe a few thousandths of an inch higher when the moon is closest to the earth, on top of a several foot swing in sea level that day.
(But such events do make lovely fodder for the doomsayers…)
Peter Grieve writes:
The mixture of explicitly stated science with implied superstition seems to becoming an art form.
Jupiter and Saturn have a combined mass of less than .002 solar masses. And tidal effects vary like the inverse cube of distance. Which means that Jupiter's tidal effect is reduced by another factor of 1/64, since at its nearest it is 4 times further from us than the Sun is.
Putin will undoubtedly be pleased with dire predictions for the West.
Kim Zussman writes:
This kind of prediction is old news: see The Jupiter Effect .
As recalled, at the time astronomers estimated the net tidal pull of the 1982 planetary alignment on the sun (which, in turn, was to effect solar radiation and subsequently interact with earth's magnetic field) of ~1mm. The sun is about 864,000 miles in diameter.
Eventually with enough of these they'll get one right.
Pitt T. Maner III writes:
Here is a good video on "pseudo-predictions" for this weekend from down under. Multiple, vague predictions debunked by scatter graphs.
I would guess, however, that there will be a resurgence of interest in the writings of catastrophists– Velikovsky being considered one of the last of the old time breed…
Phil McDonnell comments:
Speaking of Velikovsky a version of his theory is now the most favored theory for the formation of the Moon. The exception being that he thought the Moon was formed during historical times and used Biblical references to date it. For example he claimed the parting of the Red Sea was a giant Moon tidal effect. Instead current thinking dates the Mars sized Earth impact at about 300 million years after the formation of the solar System.
More on Moon formation theory:
I also ran a test looking at all the earthquakes > 7.0M in 2010. I found that the number that were 'predicted' by Nolle's super Moon windows was 19%. But the number of days covered by the windows was only 10% of the year. On its face it seems like modest support, but the sample size of correct hits was only 4, so the jury is still out.
Mar
17
Flexionism of the Day, from Victor Niederhoffer
March 17, 2011 | 1 Comment
 So is the consensus now among us non flexions that the radiation danger is merely exaggerated 100 fold so that technology in the US will be set back 30 years, and government intervention will be lubricated for the next 4 years to deal with the crisis which seems so much worse to the US than the Japanese and IAEA? This is not meant to diminish the magnitude of the tragedy in Japan, but merely to wonder if we believe that the subsequent dangers have been much exaggerated for flexionic profit?
Anatoly Veltman writes:
Yes, of course. One thing to be sure about is that T.Boone Pickens' funds will start getting ahead, as Natural Gas projects (like gradual highway infrastructure to facilitate filling-up vehicles, especially trucks and such) should finally be given light-of-day.
Bill Rafter comments:
"Never let a crisis go to waste."
Jay Pasch writes:
Buy the clashing of bearish cymbals, and sell the euphoric opposite…
Kim Zussman ironizes:
Buy the clashing of bearish cymbals, and sell the euphoric opposite in flat/choppy markets. If markets ain't flat or choppy, don't buy and sell 'em.
Steve Ellison writes:
No doubt it was my poor judgment, but from the perspective of operating a specialty line in panics, the moments of panic in the past week in the S&P 500 seemed too brief and ephemeral to go all in. The changes since the earthquake were:
3/11 +11.7
3/14 -10.7
3/15 -15.2
3/16 -21.4
3/17 +14.9
There were three moderately large down days in a row, but for perspective, the S&P 500 futures are still up 1.5% year to date. Only for the briefest of moments did they trade below the 1247.9 year-end close of 2010.
Mar
17
Is The Century’s Easiest Trade Staring Us In The Face, from Anatoly Veltman
March 17, 2011 | 1 Comment
 As $/Yen exchange rate slowly, but as surely as the Geiger counter ticking through 80.00 and toward its all-time record in 79-handle - one pauses and contemplates: is this supposed to be real or surreal?
Here you have a liquid, instantly tradeable 24-hour instrument, which may allow as much as 100:1 leverage to those who qualify and wish to indulge. You have country plagued by apparently irreversible demographic deterioration, now hit with quite a real prospect of not wanting any new pregnancy for decades to come, period. Its Central Bank can, is and will print this currency in perpetuity. Am I wrong in assumption that the only current bidders for Yen are Japanese multinationals, that must temporarily curtail their offshore enterprises in favor of domestic operations? And no one else…
Kim Zussman writes:
A biblical flood: so much money it flows even where it doesn't belong.
Nigel Davies writes:
If Japan needs to spend a lot on reconstruction whilst having little power to export then surely a strong yen makes sense.
Tyler McClellan writes:
It's not relevant to what you guys are talking about,
but of course the truth is precisely the opposite. To the extent Japan needs to get real resources from the rest of the world and can offer fewer real resources as recompense, it ought to offer a greater real share on its future production (which of course can be brought about by having a weaker currency).This is all just water on the bridge, but at least provides a reasonable basis for the conventional idea that the currency should weaken.
But these economic flows arguments are dominated by the change in the relative stock affects. There is a preponderant group of people who want to exchange a stock of dollar denominated assets for yen denominated assets. For purposes of this example, it doesn't matter that they dont know in which form to hold these yen assets (certainly not in stocks).
There is a meal for a lifetime here, but it is a complex one. It has to do with this observation, what does it mean for a given type of assets to be priced as the marginal equilibrium between buying and selling? Does this sensitivity to various changes of marginal preferences say something about the assets class and how partial equilibrium is achieved?
Perhaps I'm being not being clear enough, for the foreigner who happened to hold his worth in indeterminant yen assets, this constellation of events has been perfect. Why should that be the case?
Mar
16
More Natural Disasters Likely? from Victor Niederhoffer
March 16, 2011 | Leave a Comment
 What is the geophysics of thinking that more natural disasters are more likely now that the earth quake has occurred?
Kim Zussman shares:
Read this article.
Rudolf Hauser writes:
Another factor to consider is the shifting of the magnetic poles. This is reportedly associated with violent swings in weather and more earthquakes and volcanic explosions. Apparently there has been a marked acceleration in the rate of shifting in the past few years. Some question whether this might be the cause of recent weather extremes and geological activity. Since such shifts occur only every half million years or so we obviously have little idea of how they progress. If this is a real reason for concern it is an issue far more immediate and important that the global warming fears.
Pitt T. Maner III writes:
There have been suggestions of a connection with renewed (regional?) vulcanism.
The last eruption of Mt. Fuji , for instance, occurred 49 days after the previous largest earthquake in Japanese history.
Another Japanese volcano has resumed activity but cause/effect from the March 11 quake may be tenuous.
The volcano, Shinmoedake, is famous for standing in as the villain's secret rocket base in the 1967 James Bond film, "You Only Live Twice".
Bill Rafter comments:
Earthquakes and volcanism are simply different manifestations of the goings on of plate tectonics.
Read this article from New Sceintist: "The megaquake connection: Are huge earthquakes linked?".
Mar
16
Dollar Cost Averaging vs. Buy/Hold in Flat vs. Up Market, from Kim Zussman
March 16, 2011 | Leave a Comment
Here are some returns for dollar cost averaging vs buy (all in from the beginning) and hold for SP500 over two different market conditions. I check three different kinds of DCA: buy month close if month was down, buy month close if month was up, and buy all month closes. All were $1000 purchases of the SP500 index (w/o div), held to the end of the period.
First, the "flat" 2000-2010 period. The final totals were:
. DN DCA UP DCA ALL DCA
.TOTAL 57215.72 75497.34 132713.06
.# BUYS 55 74 129
.P/L 1.04 1.02 1.03
(P/L is gain or loss for all invested capital; 1.0 = gain of zero) Buying after down had the best return of +4%, which was 2% more than buying after up and 1% more than buying every month. All forms of DCA were much better than B/H; had one invested all capital fully at the beginning of the period thru 11/10, the return was -13.7%.
Here is the same for the bull market 82-00:
. DN DCA UP DCA ALL DCA
.TOTAL 404718.14 627104.29 1031822.43
.# BUYS 75 139 214.P/L 5.4 4.51 4.82
Obviously a lot better performance than the recent decade, with buying after down months beating both other systems. BUT B/H from the beginning kills them all: balance as of 2000 is 12.98X the initial investment.
Conclusion:
If you could know whether your relevant holding period is up rather than flat/choppy, it is better to go all in from the start. If not (why not?), or if funds are available only incrementally over time, it is better to buy after down months.
Kim follows up:
Here is the DCA analysis for DJIA from 1928-1940 (another bad period):
.                DN DCA       UP DCA         ALL DCA

.TOTAL       70737.18      82558.73      153295.91

.# BUYS          62                83                145

.

.P/L             1.14             0.99               1.06

.

.B/H             0.44
While the DOW lost 56%, blind monthly DCA and after down DCA made money.
Mar
11
The Price of Pineapples on Popa Popa, from Kim Zussman
March 11, 2011 | Leave a Comment
 Popa Popa is a tiny island with a stable population. Years ago, the government mined all the gold on the island, decreed it the only currency, and put all of it into circulation and ruled that no gold be taken off or on the island (Though Popans are famed for following the rules, this is enforced with metal detectors and X-rated X-rays). Consequently, Popa Popa has no import or export business except for oil: it produces none, and is forced to import 100%.
Popans eat only pineapples (like Ramanujan, they get their B12 from insects on the fruit). All the arable land on the tiny island is planted with pineapples on three farms, and the farmers have fleets of trucks to transport pineapples to stores.
One morning Popans woke up to find that oil prices had doubled. The three pineapple farmers had a dilemma: High oil cuts into their profits, which they need to finance their many mistresses (The island was visited in the past by French painters). Do they:
1. Raise prices to maintain constant profits and diversified connubiality?
2. Maintain prices to keep customers happy and become celibate?
3. Maintain prices but also cut staff (and force them to work harder), employee perks, and office space to offset higher oil cost, and continue their sideline as HPV breeders?
(There is no law that pineapple farmers have to do the same thing, nor any preventing them from opening dairies of color)
Read more about it here .
Mar
11
 This article is something I don't understand. I can understand that rewards should reflect the risk that people are willing to take. What risks do financial advisors personally take to justify the rewards they reap? It seems to me that if you take a much bigger reward than the risk you personally take, then that reward is undeserved and a pure expression of greed vs. what you're truly entitled to. Am I missing something?
Gary Rogan writes:
Clearly the flexionic millionaires don't deserve their rewards, especially after their companies should be long bankrupt if left to the vagaries of the free market. Is the remuneration of a financial adviser, who without any governmental or otherwise illegal/unethical tricks, derives good income from seemingly simple work, "justified"? I suggest that this is another "angels on the head of a pin" questions that cannot be answered, because it's "ill posed". In a free market, anything you get from a voluntary exchange is "justified" by it's existence. If you want what he's got, try it on your own and see if you can do as well or better. I personally don't believe in the services of a "financial advisor" so I've never been to one. I have the same attitude towards them as I do toward well-paid athlete in a sport I don't care about: if somebody is willing to voluntarily pay them their salary, it's not my problem or concern.
The article, in a true populist fashion, confuses ill-gotten gains with the rewards of the free market. This "trick" is a favorite of revolutionaries, who use the existence of scoundrels to destroy any semblance of order and replace it with a dictatorship led by even worse scoundrels.
Mark Goulston replies:
Thank you Gary. It is aimed at the true "flexionic millionaires," and I am in favor of the free market and oof people who are willing to put themselves and finances at risk to reap the rewards when they pay off. I'm just not sure I agree with "flexionic" people reaping the rewards as a result of their risking other people's money.
Gary, Hit me with your best shot about: The Obsfuscation Conspiracy.
Gary Rogan responds:
Mark, I think that most of the "flexionic millionaires" are probably CEOs of large, mostly (but not exclusively) financial companies and to a lesser extent, some hedge and other fund managers. It seems from the context that you were referring to the latter group rather than some down-home financial advisors who take on a few clients personally. To the extent that they derive their gains from their flexionic connection they are just thieves. The problem is it's often hard to separate what percentage of their gains comes from their honest skills and what percentage comes from exploiting the illegal/unethical schemes.
The real truth is that in complex societies those who learn to exploit complicated "angles", legally or illegally do well. We should try to clamp down on the illegality because otherwise everything else becomes corrupt, as corruption cannot be contained to one sector. The quest however to link compensation to the social value of one's work by anything other than enforcing anti-corruption laws and encouraging such attitudes is likely to become a fight with windmills or worse, a populist revolutionary crusade with disastrous consequences. Freedom trumps unfairness, but unfairness due to corruption should fought by good people.
Fast Anonymous writes:
While the flexonic millionaire are an issue. The cause of this issue is those millionaires that made their money by skimming a small sliver of risks and put it on the unsuspecting. No body has gone to jail, for this willful blindness. Not only have they not gone to jail those very workers are the new untouchable, too big too fail, in with the government: flexons. Of course they can put together a new system built on trust (wink, wink, nod, nod). We have all heard of perhaps the urban legend "penny skimming" millionaire. The con where you simply take a few pennies from every account, and 99.9% never notice but simply adjusted their books each month it happens . Those that did notice, did not take the time to complain. those that complained never sued etc.
Many in Wall Street simply skimmed the risks, added more and more risks, to those that thought they were buying safety, got sold garbage. The truth got stretched further an further out. One in 1 in million soon became 1/1000, then 1/100 then 1/10 and thereafter bound to happen sooner or latter. Allstate has done a statistical study that proves without a reasonable doubt many of these mortgage pools were outright frauds. The audacity of the lies were staggering to me. AIG sold over $500 billion of insurance on such securitized products, that they could not cover. They eagerly took the premium thinking they were the ones selling worthless promises.
Craig Mee writes:
Give people an inch and they take a mile. How long is a piece of string… if you do something, your kids will follow. At times no doubt its to do with re-educating people. For example, when countries move to a greater minority group within their populace, initially sometimes, those then deem to capitalise on looseness within the system. The locals then realise they're paying higher premiums because of this and get in on the act. And then the snowball begins. (A mate recently in court with a bad neck from car crash…usd7000 was the going rate. Turns out 8 people were sitting beside him with their hand out, all from the same family two car accident, usd 56000, a nice down payment on small business.)
As banks have been shown to "take liberty" so has the public. On a recent problem with a bank in Australia, atm's started punching out cash regardless of balance… from an official : "we have some people innocently trying to get sums of money out and being given more, through to people pushing security guards out of the way to go and get to it."*
We breed it and deliver 4 year political terms for those to give our cash away at will to secure votes in a socialist environment, and pay the consequences.what the answer. Work Harder!
The old laborer had to stand together, from such risks skimmers, to make a safe work place.
Wall Street must stand up to these skimmers of risks also.
Mr. Krisrock writes:
I appreciate that you posted this because it exposes that you are a supporter of Obama's strategy to VILIFY 500,000 people working in financial services and millions more who work in service industries that support them and the capitalist methods of allocating capital.
VERY VERY VERY few of these people were responsible for the financial crisis and in fact, some of us saw the fact that these same people never chose to attack the PUBLIC PRIVATE SYNDICATE called Fannie Mae.
Craig Mee writes:
Mr Krisrock, you may want to set your scope on a more deserving recipient. How my idea that "banks have taken liberty" has anything to do with a slam dunk and vilification of 500,000 financial service workers I don't quite understand.
I am a supporter of less taxes, that's what I'm a supporter of, and a fair go, for those who are having a crack.
Kim Zussman comments:
The meme gains momentum.
Ralph Vince writes:
It's ALL about money. Nothing else. In ALL walks of life, medicine, teachers, cops, politicians, waitresses, hookers, traders and traitors. Pretending to be "Above it all," is alway, bankably, a phoney act. All the little people's greed is always at the fore of their consciousness (excepting in young men, where that greed is surrogated by something else).
And who says the compensation should be consistent with the risks one takes? Or the good one does? Or their intellect?
I love that expression "…what you are entitled to." It rather rings of the other one those kind of thinkers lob out there, "…fair share."
It's enough to make you think we don't really live in a jungle. My experience, is that these are expressions of the largest predators among us, their weaponry consisting of the very specious argument that we are not in a jungle.
Let's not believe that for one second.
Gary Rogan writes:
The way the world really works is that if you unleash the government to take from those who have to cure sick patients and to house homeless children, you will have more patients unable to pay and more homeless children. Not immediately though. The liberal argument is always about here and now: "If we take the money today, we can spend more of it on worthy causes immediately. How can you not see that those in pain deserve it more than the rich who have more than enough?". Michael Moore who inserted himself into the Wisconsin crisis the other day went further. His claim was that we don't have ANY financial crisis and no government is broke because there is this untapped resource which really belongs to "the people", the wealth of the rich, that is simply not being tapped.
The real argument in Wisconsin is actually more about power than money. In this case the money, more specifically the forcefully extracted union dues of the public employee union members, is what has kept the Democrats in power in a self-sustaining feedback loop: we give you more secure and better paying jobs, you keep getting us elected with your contributions. The left is having the proverbial cow that the election process has somehow gone so wrong as to break this loop. Their reaction is bewilderment and blind rage.
Mar
9
Stocks and Real Estate, from Kim Zussman
March 9, 2011 | Leave a Comment
 I was recently talking to my friend about how houses can be bought on 80% or 90% "margin," with fixed interest rates, in effect, being a giant option on the US dollar, favorable to the real estate owner in times of inflation, when real interest rates can be negative. He thought that was how most people who make money on real estate make money on real estate, although few talk about it this way.
It's an interesting point. If stocks and real estate borrowing were on equal terms (mortgage ~ margin) and both were able to refinance to take advantage of declining rates, stocks would out-perform. But they are not the same. With high loan/value risk is borne mostly by the lender whereas upside goes to the borrower. Even more so now with mandated principal write-downs in the cards.
More generally, what fraction of the very wealthy got that way without taking great advantage of credit-risk differences between lenders and borrowers?
Mar
9
Becoming a Mature Trader, from Kim Zussman
March 9, 2011 | Leave a Comment
 Growing up (which takes a lifetime) is like finding out what kind of canoe you're in - and learning how to row it safely and effectively - and learning to accept yours is not the best in the race.
The genetic factor in IQ is well established, which doesn't (and shouldn't) stop anyone from attempting to improve their knowledge and skill at reasoning. That said, people with no facility at math shouldn't aspire to be physicists, and good-looking, loquacious, charming people shouldn't sit all day behind a computer.
There is evidence that this analysis pertains to optimism/pessimism. Some investors may find they do very well in exuberant bull markets but crash when things go bad; others miss out on "irrational" bull runs, but cautiously avoid crashes. How would society look if everyone had the same rosy disposition, and philosophy that everything bad is temporary and will ultimately and triumphantly reverse by dint of inherent human goodness, the American way, and our G-dly chosen-ness amongst a universe of 10^100^100 habitable planets?
Pessimism (skepticism, risk-aversion, worry, etc) has its place. Some fraction of Jews living in pre-Nazi Europe fled at a time when others deemed flight too fearful and overwrought, with well known results. The survival/perpetuation of fear and pessimism in the population is evidence that it has value. And the difficulty buying when the world is on fire, and holding when money is free illustrates why the rich are in the minority, most heroes are dead, and Gini ratios naturally go up until acted on by the hands of governments or G-ds.
Feb
28
Sardines for Trading, from Rocky Humbert
February 28, 2011 | Leave a Comment
 A couple of weeks ago, The Chair discussed a dinner he had with Dimson — and that Dimson noted the "long term rate of return for everything other than stocks" is around 2.8%."
This morning, Steve Landsburg articulately expanded upon one of my points regarding utility value– demonstrating that headline numbers regarding long-term returns can be horribly misleading. In particular, he addressed James Glassman's recent WSJ op-ed where he admits that his Dow 36,000 call was wrong. But importantly, Glassman's mea culpa was wrong for the wrong reasons.
Landsburg's essay reminds me of the adage: "There are sardines for trading. And there are sardines for eating.
Duncan Coker writes:
I have known a number of developers as friends from having once lived in a resort town. During the go years when they would sometimes present a deal to me for a small share, I would point out the implicit 5 to 10 times leverage, or the large share of sweat equity they usually wanted. They would always look at me like I was an uneducated amateur who did not understand the main unspoken premise of building. Build it and they will come is always the motto, and you do have to admire their optimism.
Kim Zussman writes:
"The truth is that stocks appreciate faster than houses precisely because a house does not just sit there; it provides shelter, warmth, and closet space every single day that you own it. Stocks need to appreciate faster to compensate for the fact that they don't provide any comparable stream of services. If stocks and real estate appreciated at the same rate (counting the dividends as part of the appreciation, as Glassman does), nobody would own stocks."
Margin issues notwithstanding, very few would choose homelessness to be in the stock market. A better comparison would be a rental house held as an investment - where the shelter utility is capitalized - vs (initially equivalent value) investment held in stock(s):
Over time, stock will pay dividends (or reinvest earnings, etc), and the investment will grow by capital appreciation + dividends Over time an investment house will pay rental income, and the investment will grow by appreciation + rental income - upkeep
The Case-Shiller home price index shows real house prices approximately flat (with considerable variability) over the past century, whereas the stock market is up. It would be interesting to compare rental property - including rental income - to stocks over the same period. In theory rentals should go up more, to pay for the aggravation of being a landlord.
Henry Gifford writes:
An important factor usually left out of such discussions is that houses can be bought on 80% or 90% "margin," with fixed interest rates, in effect, being a giant option on the US dollar, favorable to the real estate owner in times of inflation, when real interest rates can be negative.I think this is how most people who make money on real estate make money on real estate, although few talk about it this way.
Feb
21
Market Quiz, from Kim Zussman
February 21, 2011 | 1 Comment
Extreme monthly declines in SP500 are preceded by rising or falling markets?
(don't look until you guess)
///////////////////////////////////////////////////////////////////////////////////////////////////////////////////
The mean of the 20 worst monthly declines in SP500 (1950-present) is -10.7%; the mean of the prior 6 month period was -4.6%:
One-Sample T: mo ret, pr 6mo
Test of mu = 0 vs not = 0
Variable N Mean StDev SE Mean 95% CI T
mo ret 20 -0.10739 0.03419 0.00764 (-0.12339, -0.09139) -14.05
pr 6mo 20 -0.04606 0.14976 0.03348 (-0.11617, 0.02403) -1.38
Extra credit:
After a many month stock rally to 3 year highs, when the middle east
catches fire:
a. buy the dip
b. sell the dip
c. skip the dip and take a trip (thanks to professor Leary)
Russ Sears writes:
The S&P has not quite hit its 3 year high and may not soon.
But looking at the previous points where S&P hit a 3 year high on the close and had not hit a previous 3 year high for at least 6 month prior from 6/53 to present there were only 17 such instances. It appears pretty bullish on the surface, see the comma delimited data below. I got 1038 new 3 yearly highs, that the 6 mnth prior cut-off boils down to only 17 seems to also imply bullishness, but how sure how to do such a significance test. This extra credit for the stats majors.
For the following 21 trading day periods (mnth) after a new 3 year high with no prior new 3 year highs in the previous 126 days (6 months).
stdev,2.39%,4.37%,3.50%,3.29%, 2.83%,3.82%,5.1%,5.1%,7.9%
max,6.2%,8.1%,6.1%,5.4%,6.6%,6.9%,11.8%,3.1%,18.6%
1st mnth,2nd mnth,3rd mnth,4th mnth,5th mnth,6th mnth,sum mnth 1-3,sum mnth 4-6,sum mnth 1-6
Feb
21
Where Have All The Good Men Gone, from Kim Zussman
February 21, 2011 | 6 Comments
 I read this article called "Where Have The Good Men Gone?" recently, and found it quite interesting. Here is the beginning:
Not so long ago, the average American man in his 20s had achieved most of the milestones of adulthood: a high-school diploma, financial independence, marriage and children. Today, most men in their 20s hang out in a novel sort of limbo, a hybrid state of semi-hormonal adolescence and responsible self-reliance. This "pre-adulthood" has much to recommend it, especially for the college-educated. But it's time to state what has become obvious to legions of frustrated young women: It doesn't bring out the best in men.
Between his lack of responsibilities and an entertainment media devoted to his every pleasure, today's young man has no reason to grow up, says author Kay Hymowitz. She discusses her book, "Manning Up: How the Rise of Women Has Turned Men Into Boys."
"We are sick of hooking up with guys," writes the comedian Julie Klausner, author of a touchingly funny 2010 book, "I Don't Care About Your Band: What I Learned from Indie Rockers, Trust Funders, Pornographers, Felons, Faux-Sensitive Hipsters and Other Guys I've Dated." What Ms. Klausner means by "guys" is males who are not boys or men but something in between. "Guys talk about 'Star Wars' like it's not a movie made for people half their age; a guy's idea of a perfect night is a hang around the PlayStation with his bandmates, or a trip to Vegas with his college friends…. They are more like the kids we babysat than the dads who drove us home." One female reviewer of Ms. Kausner's book wrote, "I had to stop several times while reading and think: Wait, did I date this same guy?"
For most of us, the cultural habitat of pre-adulthood no longer seems noteworthy. After all, popular culture has been crowded with pre-adults for almost two decades. Hollywood started the affair in the early 1990s with movies like "Singles," "Reality Bites," "Single White Female" and "Swingers." Television soon deepened the relationship, giving us the agreeable company of Monica, Joey, Rachel and Ross; Jerry, Elaine, George and Kramer; Carrie, Miranda, et al.
But for all its familiarity, pre-adulthood represents a momentous sociological development. It's no exaggeration to say that having large numbers of single young men and women living independently, while also having enough disposable income to avoid ever messing up their kitchens, is something entirely new in human experience. Yes, at other points in Western history young people have waited well into their 20s to marry, and yes, office girls and bachelor lawyers have been working and finding amusement in cities for more than a century. But their numbers and their money supply were always relatively small. Today's pre-adults are a different matter. They are a major demographic event.
John Watson writes:
As a member of the generation Dr. Zussman is describing, he has it totally wrong, but then again most people over age 35 don't understand us, nor do they have a clue.
Countless tomes have been written about our generation and most are wrong. Philosophers ever since Plato have been complaining about the laxness and laziness of the following generations and I expect this trend to continue until the Revelation or whatever the disciples of Dawkins believe. As I'm fond of telling my father (who, like you, doesn't get it either), we will get it right, the economy and world will muddle along, and I will still choose his retirement home. As for the debt crisis, as my dad says, nobody's going to pay it in real dollars anyways, so why worry, life will go on. Things will go on as always, except the media is managing to have a bit more control and people who take them seriously will get frightened by all the editorial.
As for addressing Dr. Zussman's shared article, one thing that really sticks out is it has an anti-male bias which I find very strange. In answer to that, I work quite hard and am preserving two languages and cultures most modernists consider irrelevant. I don't find many females in my field, and it's impossible to recruit them beyond doing restoration work, which is a different discipline. I am quite serious about my studies and future, and most of my associates and fellow students are just as serious as I am. We are not all dilletantes as described in this essay, and all of us are rather serious. We are your caretakers in your dotage and nonage, which should be stressed.
Anyways, what the article avoids mentioning is that the Asians are completely taking over academia, which is something I've noticed since I was 14 years old. That is the real issue that needs to be discussed, and my dad has theories but you'd have to ask him as I am not willing to go on record quoting his radical ideas regarding the Asians. There is a paradigm shift going on that is the most important discussion, that everyone just dances around. Dr. Zussman, you wouldn't happen to be a French intellectual would you?
Feb
17
Strait shootin’ FED, from Kim Zussman
February 17, 2011 | 1 Comment
The day-to-day progression of the SP500 has been nearly a perfect straight line for the 5 months since Sept 15, as seen when regressing SPY daily closes vs day number in the series [i.e. regression with a linear trend]:
Regression Analysis: Adj Close versus days
The regression equation is Adj Close = 111 + 0.190 days
The regression equation is
Adj Close = 111 + 0.190 days
Predictor Coef SE Coef T P
Constant 111.231 0.249 446.69 0.000
days 0.19006 0.003841 49.48 0.000
S = 1.22719 R-Sq = 95.9% R-Sq(adj) = 95.8%
The slope of 0.19 shows the precise angle of the non-ballistic trajectory; about 2 SPX points/day. Set your sights accordingly.

Feb
16
SP500 Per Current Fed Funds Rate, from Kim Zussman
February 16, 2011 | Leave a Comment
The attached plots log(SP500) monthly for the then-current Fed funds rate (1954-2011). Various dates are marked:
1981: Peak Fed rate of 19%, following a period ranging as low as 4%, with relatively range-bound stocks of the 70's
1984: Stocks rose as the rate fell from 10% to 8%, punctuated by a pause as Fed rate jumped and declined again around 1984
1989: Stocks rose as the rate declined from 9 to 6%, rose more as the rate went from 6 back to 10% in 1989, and continued to rise as the rate fell from 10% to 3% in 1993.
2000: The vertical rise in stocks from mid-90's to 2000 occurred while the rate stayed around 5-6%
2000-2011: Rates varied from 6% to the current zero, while stocks were substantially stuck over the decade. The back and forth in stocks and Fed rate over this decade approximates a line with positive slope: high (low) rates with high (low)stocks, which fits with a market-fixated FED (easing/tightening when stocks fall/rise).
The little vertical line between 2009 and 2011 is stock drop and rebound during the unprecedented (in this series) zero fund rate regime - giving the impression the FED might like to move things out of the endzone in order to keep playing.

Bud Conrad writes:
What a confusing way to present data. The usual Fed Model compared earnings yield against interest rates like the 10 year Treasury.
The conclusion is that lower Treasury yield supports stocks (through lower earnings yield (higher P/E)).
The only indirect indication in this chart is that as the Fed funds dropped, stock went up, sort of. (Negative slope after 1981).
Kim Zussman writes:
The point of plotting this way (stock per fed funds rate) vs other conventional published methods was to see what, if any, correlation Fed rates have with stocks. The Fed can and does vary this rate, but not long rates and not stock earnings.
Feb
9
Down Decades Followed by Up Decades, from Kim Zussman
February 9, 2011 | Leave a Comment
An interesting post of mine from last year:
"Using Prof. Shiller's monthly data of SP500 returns (including dividends and adjusted for inflation), below is a table of mean monthly return ("MMR") by decade, counting back 120 months from the end of Jan 2010 to Jan 1880 (non-overlapping monthly return by decade). Also shown is monthly stdev and T (comparing mean to zero).
10/14 decades had positive MMR, though only 3 were significantly greater than zero (T>2.0), and one significantly less. Note that all down-decades were followed by up-decades, and the decade with highest MMR (ending Jan 2000) was followed by the recent down decade."
Date av 120 sd 120 T 120
2010.01 -0.003 0.042 -0.81
2000.01 0.010 0.031 3.62
1990.01 0.006 0.038 1.72
1980.01 -0.004 0.039 -1.01
1970.01 0.002 0.030 0.73
1960.01 0.009 0.029 3.37
1950.01 -0.001 0.040 -0.26
1940.01 0.001 0.087 0.07
1930.01 0.010 0.044 2.37
1920.01 -0.006 0.033 -2.06
1910.01 0.003 0.038 0.88
1900.01 0.001 0.033 0.42
1890.01 0.003 0.029 1.17
1880.01 0.004 0.031 1.37
Feb
4
Heisenberg Market Principle, from Kim Zussman
February 4, 2011 | 7 Comments
 Heisenberg market principle:
If you are certain of what; you can't be of when
If you are certain of when; you can't be of how
If you are certain of how; you can't be of what
Feb
3
Marital Wealth Effect, from Kim Zussman
February 3, 2011 | Leave a Comment
 One notes that decay of net worth as a function of marriage # doesn't make a dollar of $10M until spouse 25.
Rocky Humbert writes:
Being an optimist, I note that there is a questionable assumption in Kim's chart that is relevant to the markets:
It presumes that each and every spouse has a diminutive effect on wealth. I see no a priori reason why all spouses should have a diminutive effect on post-divorce wealth. In fact, if one marries (and divorces) an infinite number of spouses, one should also benefit from some number of positive divorce settlements. This must be true, since it's a zero sum game (net of legal fees), and if you managed to marry EVERY woman at least once, there's an asymptotic function approaching the original wealth of all parties (less legal fees).
The market analogy/problem: what is the asymptotic P&L if you buy an infinite number of out of the money puts and calls — versus selling an infinite number of the exact same out of the money puts and calls? Theoretically, (net of transaction costs), it should be a zero sum game with an uncertain path. But it's the path that really matters….
Phil McDonnell writes:
In one sense the options are a zero sum game. That is when we consider that every option that wins is pretty much paid by an option that loses. As usual we ignore taxes and vig which would turn it into a negative sum game.
But the net sim is only part of the question. It is also possible for the buyers of options to mostly lose. Suppose we buy both a put and a call struck at 50 when the stock is at 50. Both will lose time value which they initially held when bought. At expiration all time value will be gone and they will trade point for point with the difference of the stock from 50.
The reverse is true for sellers they will tend to capture time value.
Feb
2
Thought of the Day, from Kim Zussman
February 2, 2011 | Leave a Comment
 Someone sent me an interesting essay about the significant bird-based omens in Homer's "The Iliad" the other day.
Mysteriously modern omens are still tweeted
Feb
2
Fosback Forever, from Kim Zussman
February 2, 2011 | Leave a Comment
If the first day of month/Fosback anomaly were dissipating, over time one would expect over time the last day of month to increase (bought earlier and earlier) and first day decrease (buying moved to LDOM).
SPY daily 12/99-present used for regressions; FDOM vs date
Regression Analysis: FDOM versus Date
The regression equation is
FDOM = - 0.0016 + 0.000000 Date
Predictor Coef SE Coef T P
Constant -0.00160 0.04447 -0.04 0.971
Date 0.00000012 0.00000115 0.11 0.915
S = 0.0157128 R-Sq = 0.0% R-Sq(adj) = 0.0%
>>slope = flat (and NS); cannot conclude FDOM return is changing over time.
////
Regression Analysis: LDOM versus Date
The regression equation is
LDOM = 0.0522 - 0.000001 Date
Predictor Coef SE Coef T P
Constant 0.05219 0.02840 1.84 0.068
Date -0.00000135 0.00000074 -1.84 0.069
S = 0.0100366 R-Sq = 2.5% R-Sq(adj) = 1.8%
LDOM vs date negative slope (borderline significant) >> LDOM return declining over time; opposite of expected if buying moved from FDOM to LDOM
Jan
31
Reversing From Markets to Medicine? shared by Kim Zussman
January 31, 2011 | Leave a Comment
Just finished this fascinating article, "Economist Revolutionizes Mapping of Genetic Pathway for Autism". Wanted to share.
« go back — keep looking »Archives
- July 2026
- June 2026
- May 2026
- April 2026
- March 2026
- February 2026
- January 2026
- December 2025
- November 2025
- October 2025
- September 2025
- August 2025
- July 2025
- June 2025
- May 2025
- April 2025
- March 2025
- February 2025
- January 2025
- December 2024
- November 2024
- October 2024
- September 2024
- August 2024
- July 2024
- June 2024
- May 2024
- April 2024
- March 2024
- February 2024
- January 2024
- December 2023
- November 2023
- October 2023
- September 2023
- August 2023
- July 2023
- June 2023
- May 2023
- April 2023
- March 2023
- February 2023
- January 2023
- December 2022
- November 2022
- October 2022
- September 2022
- August 2022
- July 2022
- June 2022
- May 2022
- April 2022
- March 2022
- February 2022
- January 2022
- December 2021
- November 2021
- October 2021
- September 2021
- August 2021
- July 2021
- June 2021
- May 2021
- April 2021
- March 2021
- February 2021
- January 2021
- December 2020
- November 2020
- October 2020
- September 2020
- August 2020
- July 2020
- June 2020
- May 2020
- April 2020
- March 2020
- February 2020
- January 2020
- December 2019
- November 2019
- October 2019
- September 2019
- August 2019
- July 2019
- June 2019
- May 2019
- April 2019
- March 2019
- February 2019
- January 2019
- December 2018
- November 2018
- October 2018
- September 2018
- August 2018
- July 2018
- June 2018
- May 2018
- April 2018
- March 2018
- February 2018
- January 2018
- December 2017
- November 2017
- October 2017
- September 2017
- August 2017
- July 2017
- June 2017
- May 2017
- April 2017
- March 2017
- February 2017
- January 2017
- December 2016
- November 2016
- October 2016
- September 2016
- August 2016
- July 2016
- June 2016
- May 2016
- April 2016
- March 2016
- February 2016
- January 2016
- December 2015
- November 2015
- October 2015
- September 2015
- August 2015
- July 2015
- June 2015
- May 2015
- April 2015
- March 2015
- February 2015
- January 2015
- December 2014
- November 2014
- October 2014
- September 2014
- August 2014
- July 2014
- June 2014
- May 2014
- April 2014
- March 2014
- February 2014
- January 2014
- December 2013
- November 2013
- October 2013
- September 2013
- August 2013
- July 2013
- June 2013
- May 2013
- April 2013
- March 2013
- February 2013
- January 2013
- December 2012
- November 2012
- October 2012
- September 2012
- August 2012
- July 2012
- June 2012
- May 2012
- April 2012
- March 2012
- February 2012
- January 2012
- December 2011
- November 2011
- October 2011
- September 2011
- August 2011
- July 2011
- June 2011
- May 2011
- April 2011
- March 2011
- February 2011
- January 2011
- December 2010
- November 2010
- October 2010
- September 2010
- August 2010
- July 2010
- June 2010
- May 2010
- April 2010
- March 2010
- February 2010
- January 2010
- December 2009
- November 2009
- October 2009
- September 2009
- August 2009
- July 2009
- June 2009
- May 2009
- April 2009
- March 2009
- February 2009
- January 2009
- December 2008
- November 2008
- October 2008
- September 2008
- August 2008
- July 2008
- June 2008
- May 2008
- April 2008
- March 2008
- February 2008
- January 2008
- December 2007
- November 2007
- October 2007
- September 2007
- August 2007
- July 2007
- June 2007
- May 2007
- April 2007
- March 2007
- February 2007
- January 2007
- December 2006
- November 2006
- October 2006
- September 2006
- August 2006
- Older Archives
Resources & Links
- The Letters Prize
- Pre-2007 Victor Niederhoffer Posts
- Vic’s NYC Junto
- Reading List
- Programming in 60 Seconds
- The Objectivist Center
- Foundation for Economic Education
- Tigerchess
- Dick Sears' G.T. Index
- Pre-2007 Daily Speculations
- Laurel & Vics' Worldly Investor Articles