Oct
11
The Pendulum Swings, from Rocky Humbert
October 11, 2010 |
 Every weekend I read through some classic papers from another era. With inflation expectations percolating, this weekend's reading were the many papers which pondered the failure of stocks to perform according to common sense during the inflation of the last secular cycle. (One suspects that the bear market of 2000- ? will give rise to a crop of similar articles that will provide amusement comparable to reading a Sears Roebuck catalog from the 1930s ….)
The Alpine Knock-About Fedora Hat for $0.69 and the silk ladies Clever Collar for $.29 reminds one of: R. Geske & R. Roll (J. Finance, March 1983) "The Fiscal and Monetary Linkager between Stock Returns and Inflation"
Abstract:
Contrary to economic theory and common sense, stock returns are negatively related to both expected and unexpected inflation. We argue that this puzzling empirical phenomenon does not indicate causality. Instead, stock returns are negatively related to contemporaneous changes in expected inflation because they signal a chain of events which results in a higher rate of monetary expansion. Exogenous shocks in real output, signaled by the stock market, induce changes in tax revenue, in the deficit, in Treasury borrowing and in Federal Reserve "monetization" of the increased debt. Rational bond and stock market investors realize this will happen. They adjust prices (and interest rates) accordingly and without delay.
Although expected inflation seems to have a negative effect on subsequent stock returns, this could be an empirical illusion, since a spurious causality is induced by a combination of (a) reversed adaptive inflation expectations model and (b) a reversed money growth/stock returns model. If the real interest rate is not a constant, using nominal interest proxies for expected inflation is dangerous, since small changes in real rates can cause large and opposite percentage changes in stock prices.
Finally, one notes that the real interest rate is currently -0.81% for cash, and 1.40% for the ten-year. Both are at 2-sigma lows. Where can they go but up? And is this bullish or bearish for stocks and bonds? Hmmm.
Vince Fulco writes:
One notes the newspaper boy hat has been creeping into Minneapolis clothing trends for the last 6 months. Some guys even wearing them in the height of summer. I guess what comes next is "a chicken in every pot" meme…
Kim Zussman writes:
Checked this using BLS monthly CPI data and SP500 returns. Here is regression of stock returns vs contemporaneous CPI change:
Regression Analysis: mo ret versus chg cpi
The regression equation is mo ret = 0.00935 - 0.00906 chg cpi
Predictor Coef SE Coef T P
Constant 0.009345 0.002033 4.60 0.000
chg cpi -0.009058 0.004278 -2.12 0.035
S = 0.0419261 R-Sq = 0.6% R-Sq(adj) = 0.5%
As they say, the correlation is significant and negative (though RSQ is small and thus CPI explains little of monthly stock return).
Checked also whether this month's change in CPI predicts next month in stocks (with the usual answer, no):
Regression Analysis: M ret versus M-1 cpi chg
The regression equation is M ret = 0.00811 - 0.00503 M-1 cpi chg
Predictor Coef SE Coef T P
Constant 0.008108 0.002040 3.97 0.000
M-1 cpi chg -0.005026 0.004291 -1.17 0.242
S = 0.0420445 R-Sq = 0.2% R-Sq(adj) = 0.1%
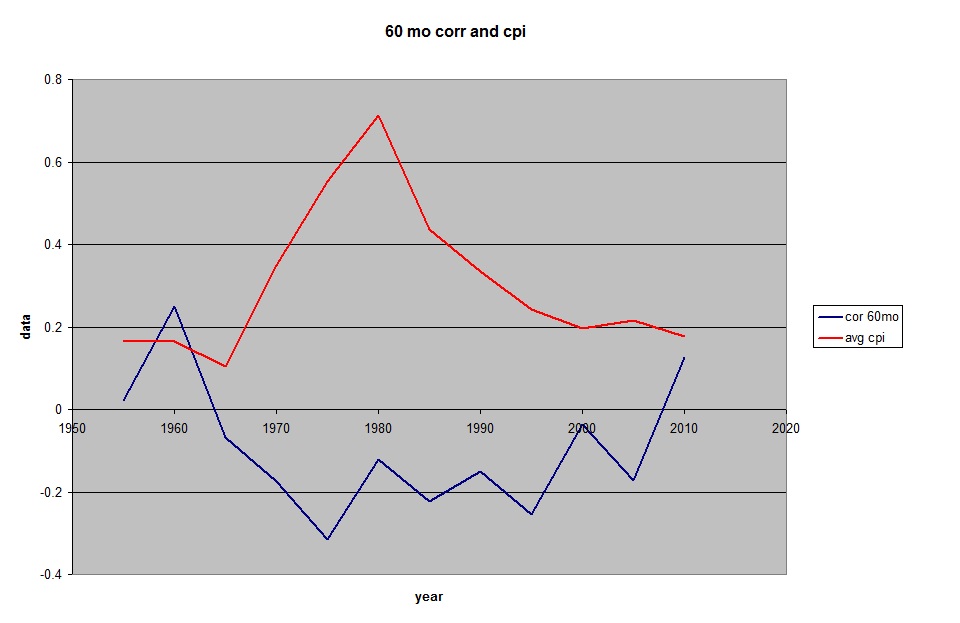
To see how this has evolved over time, checked correlation between chg cpi and SP500 ret for non-overlapping 60-month periods:
Year corr 60 avg cpi
2010 0.12 0.18
2005 -0.17 0.22
2000 -0.04 0.20
1995 -0.25 0.24
1990 -0.15 0.33
1985 -0.22 0.44
1980 -0.12 0.71
1975 -0.32 0.55
1970 -0.18 0.35
1965 -0.07 0.10
1960 0.25 0.17
1955 0.02 0.17
As shown on the attached graph of data above, most of the negative correlation between cpi and stocks occurred in the good old days of high-cpi (70's-80's), when certain parties where whipping inflation now.
What will they whip next?
Comments
Archives
- July 2026
- June 2026
- May 2026
- April 2026
- March 2026
- February 2026
- January 2026
- December 2025
- November 2025
- October 2025
- September 2025
- August 2025
- July 2025
- June 2025
- May 2025
- April 2025
- March 2025
- February 2025
- January 2025
- December 2024
- November 2024
- October 2024
- September 2024
- August 2024
- July 2024
- June 2024
- May 2024
- April 2024
- March 2024
- February 2024
- January 2024
- December 2023
- November 2023
- October 2023
- September 2023
- August 2023
- July 2023
- June 2023
- May 2023
- April 2023
- March 2023
- February 2023
- January 2023
- December 2022
- November 2022
- October 2022
- September 2022
- August 2022
- July 2022
- June 2022
- May 2022
- April 2022
- March 2022
- February 2022
- January 2022
- December 2021
- November 2021
- October 2021
- September 2021
- August 2021
- July 2021
- June 2021
- May 2021
- April 2021
- March 2021
- February 2021
- January 2021
- December 2020
- November 2020
- October 2020
- September 2020
- August 2020
- July 2020
- June 2020
- May 2020
- April 2020
- March 2020
- February 2020
- January 2020
- December 2019
- November 2019
- October 2019
- September 2019
- August 2019
- July 2019
- June 2019
- May 2019
- April 2019
- March 2019
- February 2019
- January 2019
- December 2018
- November 2018
- October 2018
- September 2018
- August 2018
- July 2018
- June 2018
- May 2018
- April 2018
- March 2018
- February 2018
- January 2018
- December 2017
- November 2017
- October 2017
- September 2017
- August 2017
- July 2017
- June 2017
- May 2017
- April 2017
- March 2017
- February 2017
- January 2017
- December 2016
- November 2016
- October 2016
- September 2016
- August 2016
- July 2016
- June 2016
- May 2016
- April 2016
- March 2016
- February 2016
- January 2016
- December 2015
- November 2015
- October 2015
- September 2015
- August 2015
- July 2015
- June 2015
- May 2015
- April 2015
- March 2015
- February 2015
- January 2015
- December 2014
- November 2014
- October 2014
- September 2014
- August 2014
- July 2014
- June 2014
- May 2014
- April 2014
- March 2014
- February 2014
- January 2014
- December 2013
- November 2013
- October 2013
- September 2013
- August 2013
- July 2013
- June 2013
- May 2013
- April 2013
- March 2013
- February 2013
- January 2013
- December 2012
- November 2012
- October 2012
- September 2012
- August 2012
- July 2012
- June 2012
- May 2012
- April 2012
- March 2012
- February 2012
- January 2012
- December 2011
- November 2011
- October 2011
- September 2011
- August 2011
- July 2011
- June 2011
- May 2011
- April 2011
- March 2011
- February 2011
- January 2011
- December 2010
- November 2010
- October 2010
- September 2010
- August 2010
- July 2010
- June 2010
- May 2010
- April 2010
- March 2010
- February 2010
- January 2010
- December 2009
- November 2009
- October 2009
- September 2009
- August 2009
- July 2009
- June 2009
- May 2009
- April 2009
- March 2009
- February 2009
- January 2009
- December 2008
- November 2008
- October 2008
- September 2008
- August 2008
- July 2008
- June 2008
- May 2008
- April 2008
- March 2008
- February 2008
- January 2008
- December 2007
- November 2007
- October 2007
- September 2007
- August 2007
- July 2007
- June 2007
- May 2007
- April 2007
- March 2007
- February 2007
- January 2007
- December 2006
- November 2006
- October 2006
- September 2006
- August 2006
- Older Archives
Resources & Links
- The Letters Prize
- Pre-2007 Victor Niederhoffer Posts
- Vic’s NYC Junto
- Reading List
- Programming in 60 Seconds
- The Objectivist Center
- Foundation for Economic Education
- Tigerchess
- Dick Sears' G.T. Index
- Pre-2007 Daily Speculations
- Laurel & Vics' Worldly Investor Articles