Commentary: It's
Now or Never . . .
One more week to go. One more week to get
a good grade for the year. It's final exam time.
The GTI needs to hit the books.
In case you're wondering, here's how I'll be
passing out the grades:
| 2005 Return | Grade |
| 100% or more | 100 |
| 25% to 100% | 90 |
| 15% to 25% | 80 |
| 7.5% to 15% | 70 |
| 0% to 7.5% | 60 |
| 0% to - 5% | 50 |
| - 5% to - 15% | 40 |
| - 15% to - 25% | 30 |
| - 25% to - 35% | 20 |
| - 35% to - 50% | 10 |
| - 50% or worse | 0 |
Barring something
dramatic, the GTI will earn a
60 or 70 for 2005. It's disappointing, but it's good
enough for promotion to the next grade, 2006.
Wait 'til next year, as we say in Beantown.
Speaking of which, you may recall the Zen state
of peace conferred on me by the 2004 Red Sox
season, when they took eight straight from the
Yankees and Cardinals to
win the
World Series.
I thought no disappointment involving the Red
Sox could ever again upset me.
But that was before
Johnny Damon signed with
the Yankees. Oh, the perfidy! He'd better hope
the barber the Yankees bring in to shave him
isn't a Red Sox fan.
Starting a week ago I went five days without a
single piece of spam. Usually I get 10 to 15 junk
posts a day. What could it be, a Christmas
Truce? In which case would a Tet Offensive
follow? As it turned out, I had messed up a
setting on my spam detector.
Case closed.
(P.S. It was my fault. Choice Mail is great.)
What a Thursday ride Wave Systems (WAVX)
had. After announcing before the open that it had
a new U.S. Army contract, it opened up 19% and
within a few minutes was up 30%. Alas, from
there it descended
all day, finishing up only 3%.
We WAVX owners are a long-suffering lot.
After more than six months without a change, the
Gilder list came in for some housecleaning. Three
companies were dropped and two were added in
the January GTR issued Wednesday.
Their names are probably no longer secret in the
Internet, where information wants to be free, but
for whatever good it may do, I'll keep silent for a
couple of weeks longer, so that GTR subscribers
may make the best use of what they pay for.
Since all three of the new companies are up
nicely since becoming Gilder stocks, maybe
knowledge of their identity is worth something.
Maybe The Gilder
Effect will live again. What a
bullish indicator that would be!
Merry Christmas to all.
The Week's Top Gainers and Losers
| Gainers | Losers | ||
| AMD | + 8.3% | XLNX | - 4.8% |
| TSM | + 4.0% | GLW | - 4.1% |
| LNOP | + 3.4% | SYNA | - 4.1% |
| NETL | + 2.7% | S | - 2.8% |
| FLEX | + 2.6% | SMI | - 2.2% |
NOTE: Excludes newly
added companies.
The Week Day
by Day:
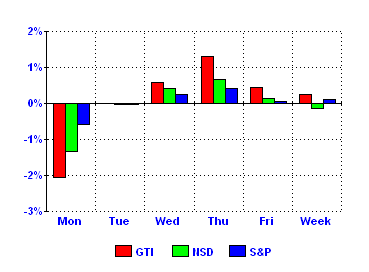
With most of the (optimistic, life
affirming) bulls
departing early for a spot of Christmas cheer,
leaving the (dull, gloomy, grouchy) bears to hold
sway on Wall Street, I feared the worst for the
market today. Yet we eked out a small gain, the
third in a row. It bodes well for the coming week.
Returns for the Week:
Gilder Technology Index (GTI):
+ 0.3%
Nasdaq Composite
Index (NSD): - 0.1%
S&P 500 Index (S&P): + 0.1%
Historical Returns:
| Period | GTI | NSD | S&P |
| 1997 (est'd) | 21% | 22% | 31% |
| 1998 (est'd) | 48% | 40% | 27% |
| 1999 | 284% | 86% | 20% |
| 2000 | - 44% | - 39% | - 10% |
| 2001 | - 43% | - 21% | - 13% |
| 2002 | - 56% | - 32% | - 23% |
| 2003 | 130% | 50% | 26% |
| 2004 | 3% | 9% | 9% |
| 2005 to Date | 7.6% | 3.4% | 4.7% |
| Avg for 8+ yrs | 10.4% | 6.4% | 6.2% |
| Last 52 wks | 9% | 4% | 5% |
|
Since the
high of 3/06/00 |
- 77% | - 55% | - 17% |
|
Since the low of 10/09/02 |
281% | 102% | 63% |
Comparison of Returns
for GTI Stocks
By Whether or Not They Pay Dividends:
| Year | Do Pay Dividends |
Do Not
Pay Dividends |
| 2004 | 11.6% | - 3.3% |
| 2005 to Date | 15.0% | 6.0% |
Makeup of the
GTI:
The GTI companies are those "Telecosm
Technologies" in the Gilder Technology
Report whose stock is readily available to
investors. If a company is not traded on the
NYSE, AMEX, or NASDAQ National Market,
it is not in the GTI.
There are now 27 companies in the GTI.
Advances vs. Declines:
Among the GTI stocks this week, there were
10 up, 17 down, 0 unchanged.

From the GTI's Origin (1/1/99) to Now:

Weekly Change in the GTI, Last 52 Weeks:

Trailing 3-Month Returns, Last 52 Weeks:

Volatility, Trend, Recovery:
As an indication of volatility, this table shows average weekly change in the GTI
each year:
| Year | Ave Wkly Change |
| 1999 | 4.2% |
| 2000 | 7.7% |
| 2001 | 8.5% |
| 2002 | 6.8% |
| 2003 | 4.3% |
| 2004 | 3.4% |
| 2005 to Date | 2.1% |
As an
indication of trend, this table shows
number of up weeks for the GTI each year:
|
Year |
Number of Up Weeks |
As a % |
| 1999 | 39 of 52 | 75% |
| 2000 | 24 of 52 | 46% |
| 2001 | 22 of 52 | 42% |
| 2002 | 19 of 52 | 37% |
| 2003 | 31 of 53 | 58% |
| 2004 | 28 of 52 | 54% |
| 2005 to Date | 26 of 51 | 51% |
The GTI
fell 94.1% from its March 6, 2000,
high to its October 9, 2002, low.
Click here
for the details of its long recovery attempt.