Commentary:
The 76% Solution
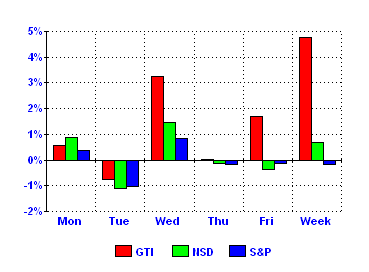
The GTI has been leaving the NASDAQ in the
dust. This week it was up 4.8%, compared to
0.7% for the NASDAQ. For the year, it's GTI
19.3%, NASDAQ 4.4%. Since the October, 2002,
low, it's GTI 344%, NASDAQ 107%.
If this keeps up, GG's handsome mug will once
again grace the covers of business magazines.
The Gilder Effect will rise again.
Look at the returns for the companies he has
added to the list since January 1, 2005:
|
|
Weeks |
Return |
|
ENER |
3 |
+ 2% |
|
FNSR |
10 |
+ 88% |
|
GLW |
49 |
+ 145% |
|
IKAN |
10 |
+ 70% |
|
NETL |
57 |
+ 210% |
|
SIGM |
10 |
+ 7% |
|
SKM |
45 |
+ 2% |
The average annual
return for the table above is
102%, or better than a one-year double. Those
who kept their faith in George and bought his
new selections have been well rewarded.
Yes, the GTI is inherently more risky and volatile
than the NASDAQ. It ought to do better in good
times, because it will probably do worse on the
way down. What finally matters is the ups and
downs combined. For that we have the period
1/1/97 to present, which shows the GTI returning
12.0%, the NASDAQ 6.5%. That's a big difference.
It suggest significant added value.
It always gives my competitive nature a lift when
the GTI beats the NASDAQ. But in addition, for
some time I've had a feeling that it was a bullish
indicator for our stocks. It seemed to me that
when the GTI beat the NASDAQ one week, then
the following week was likely to be a good one
for the GTI.
This week I finally got around to testing that
theory.
From the GTI's January 1, 1999, origin through
February 24 of this year, there were 372 weeks.
A little over half the time (188 weeks), the GTI beat
the NASDAQ. If we look at what happened in
each following week, this is what we find:
If for any given week the GTI has beaten the
NASDAQ, the next week averages a gain of .75%
for the GTI.
But if the NASDAQ has beaten the GTI, the next
week averages a loss of .11% for the GTI.
My theory is looking pretty good, but maybe I've
just been lucky. Maybe the result was a random
occurrence, like throwing several heads in a row.
My knowledge of statistics has been gathering
dust for almost 50 years, so I turned for help to a
pro, a man who makes his living distinguishing
between random and significant outcomes, my
old friend, Victor Niederhoffer.
After examining the data for the entire series, all
372 weeks' worth, he tells me there is a 24%
probability that my result was random.
That's disappointing, but being a glass-half-full
kind of guy, I'll take comfort in the 76% chance
that I'm on to something.
What you make of this information, that's up to
you. Since I'm a long-term-buy-and-hold kind of
guy, short term indicators aren't much use to me.
The Week's Top Gainers and Losers
| Gainers | Losers | ||
| FNSR | + 43.2% | MVIS | - 4.9% |
| BWNG | + 23.3% | FLEX | - 3.8% |
| NETL | + 12.6% | ENER | - 3.3% |
| SIGM | + 9.7% | AMD | - 2.5% |
| ZRAN | + 9.4% | KEYW | - 2.1% |
Finisar (FNSR) leads
the pack for the second
week in a row and continues as the top GTI
stock for 2006, with a gain of 96%. Close
behind is Broadwing (BWNG), up 86%.
The Week Day by Day:
Friday started with a betrayal by the Judas
of the
list, Intel (INTC), yet it still wound up a good day,
at least for Gilder stocks. This is a bull market, at
least for Gilder stocks.
Returns for the Week:
Gilder Technology Index (GTI):
+ 4.8%
Nasdaq Composite
Index (NSD): + 0.7%
S&P 500 Index (S&P): - 0.2%
Historical Returns:
| Period | GTI | NSD | S&P |
| 1997 (est'd) | 21% | 22% | 31% |
| 1998 (est'd) | 48% | 40% | 27% |
| 1999 | 284% | 86% | 20% |
| 2000 | - 44% | - 39% | - 10% |
| 2001 | - 43% | - 21% | - 13% |
| 2002 | - 56% | - 32% | - 23% |
| 2003 | 130% | 50% | 26% |
| 2004 | 3% | 9% | 9% |
| 2005 | 5.1% | 1.4% | 3.0% |
| 2006 to date | 19.3% | 4.4% | 3.1% |
| Avg for 9+ yrs | 12.0% | 6.5% | 6.2% |
| Last 52 wks | 33% | 11% | 5% |
|
Since the
high of 3/06/00 |
- 74% | - 54% | - 16% |
|
Since the low of 10/09/02 |
344% | 107% | 66% |
Comparison of Returns
for GTI Stocks
By Whether or Not They Pay Dividends:
| Year | Do Pay Dividends |
Do Not
Pay Dividends |
| 2004 | 11.6% | - 3.3% |
| 2005 | 11.1% | 4.2% |
| 2006 to date | 3.3% | 27.1% |
Makeup of the
GTI:
The GTI companies are those "Telecosm
Technologies" in the Gilder Technology
Report whose stock is readily available to
investors. If a company is not traded on the
NYSE, AMEX, or NASDAQ National Market,
it is not in the GTI.
There are now 28 companies in the GTI.
Advances vs. Declines:
Among the GTI stocks this week, there were
19 up, 9 down, 0 unchanged.

From the GTI's Origin (1/1/99) to Now:

Weekly Change in the GTI, Last 52 Weeks:

Trailing 3-Month Returns, Last 52 Weeks:

Volatility, Trend, Recovery:
As an indication of volatility, this table shows average weekly change in the GTI
each year:
| Year | Ave Wkly Change |
| 1999 | 4.2% |
| 2000 | 7.7% |
| 2001 | 8.5% |
| 2002 | 6.8% |
| 2003 | 4.3% |
| 2004 | 3.4% |
| 2005 | 2.1% |
| 2006 to date | 3.2% |
As an
indication of trend, this table shows
number of up weeks for the GTI each year:
|
Year |
Number of Up Weeks |
As a % |
| 1999 | 39 of 52 | 75% |
| 2000 | 24 of 52 | 46% |
| 2001 | 22 of 52 | 42% |
| 2002 | 19 of 52 | 37% |
| 2003 | 31 of 53 | 58% |
| 2004 | 28 of 52 | 54% |
| 2005 | 26 of 52 | 50% |
| 2006 to date | 5 of 9 | 56% |
The GTI
fell 94.1% from its March 6, 2000,
high to its October 9, 2002, low.
Click here
for the details of its long recovery attempt.