Commentary:
Santa Fe Trail Mix
For the second time this year, I'm writing
from
Santa Fe. This time it's the 70th birthday of a
dear old friend, a local
banker.
I've been coming to Santa Fe off and on for
almost 40 years, and I've always loved it.
There's something magic in the air here.
What is it about Santa Fe? Many things:
Santa Fe Style architecture, a blend of Pueblo
Indian adobe and Spanish Colonial. There are no
skyscrapers, and barely anything taller than two
stories. Buildings have soft, rounded edges and
are painted in warm earth colors. Santa Fe is the
state capital, but it's a small, cozy town.
The surrounding
desert, pueblos, and rugged
mountains, under dramatically sparkling skies.
"It never rains in Santa Fe."
The pervasive, glorious scent of burning piñon
(pine) wafting from the adobe houses with their
romantic corner fireplaces.
The cultural mix of Pueblo Indian, Old West,
Mexican settler, and Colonial Spain.
The Indian jewelry on women. Navajo
rugs,
Hopi kachina
dolls, Zuni
fetish sculptures,
native American
pottery. The Indians who
sell their
wares
in front of the Palace of the
Governors across from the Plaza in the
center of town.
Hotel
La Fonda, small, old fashioned, downtown,
colorful,
historic, though it wouldn't hurt if the
help were a little more on the ball.
The food. If you like it
hot, you're at home in
Santa Fe. The unique Northern New Mexico
cuisine is based on chile peppers, both dried
(red) and fresh (green). When I'm here I have
a chile fix three times a day. A bowl of green
at
Tia Sophia's is a great way to start the day.
Speaking of food, it's almost past lunch time
now. I must rush to Maria's,
a chile joint where
they wrote the book on margaritas. But before I
go, sure, Santa Fe has changed over the years.
What hasn't? But it hasn't lost the magic.
The Week's Top Gainers and Losers
| Gainers | Losers | ||
| IKAN | + 15.2% | MVIS | - 3.3% |
| CPHD | + 10.3% | INTC | - 3.2% |
| BWNG | + 6.0% | TSM | - 2.6% |
| S | + 5.5% | FNSR | - 2.3% |
| QCOM | + 3.5% | ENER | - 2.2% |
High-flying Ikanos (IKAN),
added in December,
is now the GTI's top gainer for 2006, up 67%.
Not far behind are Broadwing (BWNG), up 56%,
and Broadcom (BRCM), up 44%.
The Week Day by Day:
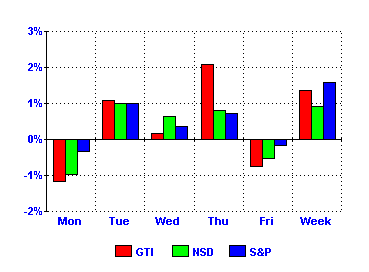
A wretched start to the week had me
worried, but
the gloom lifted Tuesday, just about the same
time as the snow was removed from New York
streets. It turned into a good week, with the bull
seeming resilient and full of strength.
Returns for the Week:
Gilder Technology Index (GTI):
+ 1.4%
Nasdaq Composite
Index (NSD): + 0.9%
S&P 500 Index (S&P): + 1.6%
Historical Returns:
| Period | GTI | NSD | S&P |
| 1997 (est'd) | 21% | 22% | 31% |
| 1998 (est'd) | 48% | 40% | 27% |
| 1999 | 284% | 86% | 20% |
| 2000 | - 44% | - 39% | - 10% |
| 2001 | - 43% | - 21% | - 13% |
| 2002 | - 56% | - 32% | - 23% |
| 2003 | 130% | 50% | 26% |
| 2004 | 3% | 9% | 9% |
| 2005 | 5.1% | 1.4% | 3.0% |
| 2006 to date | 14.9% | 3.5% | 3.1% |
| Avg for 9+ yrs | 11.6% | 6.4% | 6.2% |
| Last 52 wks | 31% | 11% | 7% |
|
Since the
high of 3/06/00 |
- 75% | - 55% | - 16% |
|
Since the low of 10/09/02 |
328% | 105% | 66% |
Comparison of Returns
for GTI Stocks
By Whether or Not They Pay Dividends:
| Year | Do Pay Dividends |
Do Not
Pay Dividends |
| 2004 | 11.6% | - 3.3% |
| 2005 | 11.1% | 4.2% |
| 2006 to date | 3.2% | 20.1% |
Makeup of the
GTI:
The GTI companies are those "Telecosm
Technologies" in the Gilder Technology
Report whose stock is readily available to
investors. If a company is not traded on the
NYSE, AMEX, or NASDAQ National Market,
it is not in the GTI.
There are now 28 companies in the GTI, but last week there were 27.
Advances vs. Declines:
Among the GTI stocks this week, there were
15 up, 13 down, 0 unchanged.

From the GTI's Origin (1/1/99) to Now:

Weekly Change in the GTI, Last 52 Weeks:

Trailing 3-Month Returns, Last 52 Weeks:

Volatility, Trend, Recovery:
As an indication of volatility, this table shows average weekly change in the GTI
each year:
| Year | Ave Wkly Change |
| 1999 | 4.2% |
| 2000 | 7.7% |
| 2001 | 8.5% |
| 2002 | 6.8% |
| 2003 | 4.3% |
| 2004 | 3.4% |
| 2005 | 2.1% |
| 2006 to date | 3.3% |
As an
indication of trend, this table shows
number of up weeks for the GTI each year:
|
Year |
Number of Up Weeks |
As a % |
| 1999 | 39 of 52 | 75% |
| 2000 | 24 of 52 | 46% |
| 2001 | 22 of 52 | 42% |
| 2002 | 19 of 52 | 37% |
| 2003 | 31 of 53 | 58% |
| 2004 | 28 of 52 | 54% |
| 2005 | 26 of 52 | 50% |
| 2006 to date | 4 of 7 | 57% |
The GTI
fell 94.1% from its March 6, 2000,
high to its October 9, 2002, low.
Click here
for the details of its long recovery attempt.