Power Outage
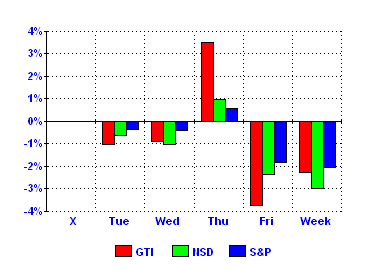
The market came to 2006 full of energy, but this
week someone pulled the plug.
The one exception was Thursday, when power
was gloriously restored for the day, especially
for Gilder stocks, with the GTI surging 3.5%.
But then came Friday, a meltdown.
The GTI has one power stock left over from the
Digital Power Report. It is Power-One (PWER),
one of the companies the Internet relies on for
uninterrupted power. While its products may not be prone to surges and
cutbacks, its stock is,
as may be seen from a one-year
price chart.
Snedens Landing, where I live, suffers power
failures itself. Though only 15 miles from Times
Square, it is a tiny, remote, rural hamlet, with
many old trees that fall on power lines. We incur
some 100 to 150 hours of blackout a year, in part
because the power company gets to us last
when it is restoring lost power. In Digital Power
terms, we manage less than two
nines.
My needs are far more modest than those of
Google, Yahoo, EBay, and other titans of the
Internet, who need nine or ten nines (only ten
milliseconds or so of outage a year) to ensure
smooth business continuity.
But the GTI is important to me. Also, I want to be
sure I can watch the Super Bowl on television,
and have ice in my drink while doing so.
This week we finally gave in and installed a
standby generator, a Cummins Onan 20 kW
model. No longer must I endure sitting in the
dark listening to neighbors' generators.
Now if we could only apply some of that spark
to the stock market.
The Week's Top Gainers and Losers
| Gainers | Losers | ||
| BWNG | + 13.4% | INTC | - 15.6% |
| KEYW | + 8.0% | SYNA | - 14.9% |
| AMD | + 4.6% | MVIS | - 11.1% |
| IKAN | + 3.4% | PWER | - 8.1% |
| NETL | + 0.9% | TSM | - 5.0% |
Way to go, BWNG, now
up 42% for the year.
The Week Day by Day:
As they say at the poker table, read 'em
and
weep. I thought Friday would never end. Our one consolation, and it's
not much, is that the GTI almost broke even between Thursday and Friday.
And hey, we beat the NASDAQ again this week.
Returns for the Week:
Gilder Technology Index (GTI): -
2.2%
Nasdaq Composite
Index (NSD): - 3.0%
S&P 500 Index (S&P): - 2.0%
Historical Returns:
| Period | GTI | NSD | S&P |
| 1997 (est'd) | 21% | 22% | 31% |
| 1998 (est'd) | 48% | 40% | 27% |
| 1999 | 284% | 86% | 20% |
| 2000 | - 44% | - 39% | - 10% |
| 2001 | - 43% | - 21% | - 13% |
| 2002 | - 56% | - 32% | - 23% |
| 2003 | 130% | 50% | 26% |
| 2004 | 3% | 9% | 9% |
| 2005 | 5.1% | 1.4% | 3.0% |
| 2006 to date | 8.7% | 1.9% | 1.1% |
| Avg for 9+ yrs | 11.0% | 6.3% | 6.1% |
| Last 52 wks | 27% | 10% | 8% |
|
Since the
high of 3/06/00 |
- 76% | - 55% | - 17% |
|
Since the low of 10/09/02 |
305% | 102% | 62% |
Comparison of Returns
for GTI Stocks
By Whether or Not They Pay Dividends:
| Year | Do Pay Dividends |
Do Not
Pay Dividends |
| 2004 | 11.6% | - 3.3% |
| 2005 | 11.1% | 4.2% |
| 2006 to date | 1.6% | 11.7% |
Makeup of the
GTI:
The GTI companies are those "Telecosm
Technologies" in the Gilder Technology
Report whose stock is readily available to
investors. If a company is not traded on the
NYSE, AMEX, or NASDAQ National Market,
it is not in the GTI.
There are now 27 companies in the GTI.
Advances vs. Declines:
Among the GTI stocks this week, there were
6 up, 20 down, 1 unchanged.

From the GTI's Origin (1/1/99) to Now:

Weekly Change in the GTI, Last 52 Weeks:

Trailing 3-Month Returns, Last 52 Weeks:

Volatility, Trend, Recovery:
As an indication of volatility, this table shows average weekly change in the GTI
each year:
| Year | Ave Wkly Change |
| 1999 | 4.2% |
| 2000 | 7.7% |
| 2001 | 8.5% |
| 2002 | 6.8% |
| 2003 | 4.3% |
| 2004 | 3.4% |
| 2005 | 2.1% |
| 2006 to date | 4.4% |
As an
indication of trend, this table shows
number of up weeks for the GTI each year:
|
Year |
Number of Up Weeks |
As a % |
| 1999 | 39 of 52 | 75% |
| 2000 | 24 of 52 | 46% |
| 2001 | 22 of 52 | 42% |
| 2002 | 19 of 52 | 37% |
| 2003 | 31 of 53 | 58% |
| 2004 | 28 of 52 | 54% |
| 2005 | 26 of 52 | 50% |
| 2006 to date | 2 of 3 | 67% |
The GTI
fell 94.1% from its March 6, 2000,
high to its October 9, 2002, low.
Click here
for the details of its long recovery attempt